Government Pension Fund Global Holding of equities at 31 ... - NBIM
Government Pension Fund Global Holding of equities at 31 ... - NBIM
Government Pension Fund Global Holding of equities at 31 ... - NBIM

You also want an ePaper? Increase the reach of your titles
YUMPU automatically turns print PDFs into web optimized ePapers that Google loves.
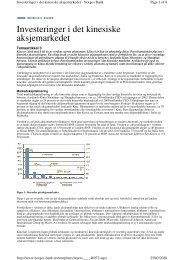
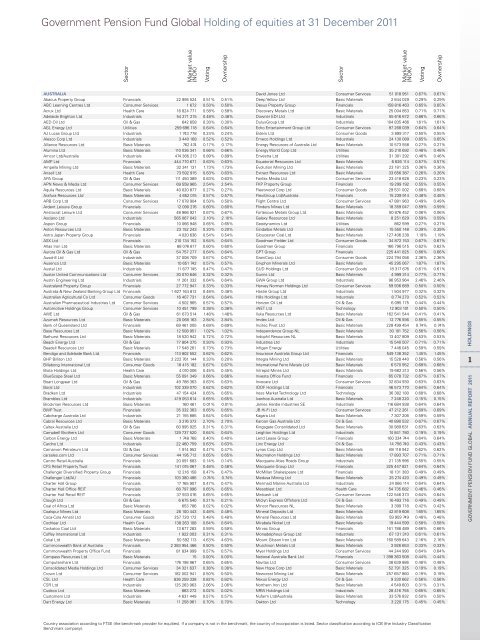
<strong>Government</strong> <strong>Pension</strong> <strong>Fund</strong> <strong>Global</strong> <strong>Holding</strong> <strong>of</strong> <strong>equities</strong> <strong>at</strong> <strong>31</strong> December 2011<br />
sector<br />
market value<br />
(noK)<br />
AUsTRALiA<br />
abacus Property Group Financials 22 995 524 0.51% 0.51%<br />
abC learning Centres ltd Consumer services 1 672 0.50% 0.50%<br />
acrux ltd Health Care 16 824 771 0.58% 0.58%<br />
adelaide brighton ltd industrials 54 271 215 0.48% 0.48%<br />
aeD oil ltd oil & Gas 642 658 0.30% 0.30%<br />
aGl energy ltd utilities 259 696 118 0.64% 0.64%<br />
aJ lucas Group ltd industrials 1 743 778 0.24% 0.24%<br />
alesco Corp ltd industrials 3 440 168 0.52% 0.52%<br />
alliance resources ltd basic m<strong>at</strong>erials 762 474 0.17% 0.17%<br />
alumina ltd basic m<strong>at</strong>erials 110 036 341 0.66% 0.66%<br />
amcor ltd/australia industrials 474 366 213 0.89% 0.89%<br />
amP ltd Financials 444 770 671 0.63% 0.63%<br />
ampella mining ltd basic m<strong>at</strong>erials 32 341 1<strong>31</strong> 1.73% 1.73%<br />
ansell ltd Health Care 73 592 915 0.63% 0.63%<br />
aPa Group oil & Gas 111 450 389 0.63% 0.63%<br />
aPn news & media ltd Consumer services 69 558 965 2.54% 2.54%<br />
aquila resources ltd basic m<strong>at</strong>erials 40 020 877 0.27% 0.27%<br />
arafura resources ltd basic m<strong>at</strong>erials 4 652 015 0.57% 0.57%<br />
arb Corp ltd Consumer services 17 078 904 0.50% 0.50%<br />
ardent leisure Group Financials 12 090 276 0.60% 0.60%<br />
aristocr<strong>at</strong> leisure ltd Consumer services 48 966 921 0.67% 0.67%<br />
asciano ltd industrials 565 067 042 2.10% 2.10%<br />
aspen Group Financials 10 066 948 0.65% 0.65%<br />
aston resources ltd basic m<strong>at</strong>erials 23 152 243 0.20% 0.20%<br />
astro Japan Property Group Financials 4 020 636 0.54% 0.54%<br />
asX ltd Financials 210 134 152 0.64% 0.64%<br />
<strong>at</strong>las iron ltd basic m<strong>at</strong>erials 88 076 817 0.60% 0.60%<br />
aurora oil & Gas ltd oil & Gas 54 757 277 0.64% 0.64%<br />
ausdrill ltd industrials 37 008 709 0.67% 0.67%<br />
ausenco ltd basic m<strong>at</strong>erials 10 651 742 0.57% 0.57%<br />
austal ltd industrials 11 677 745 0.47% 0.47%<br />
austar united Communic<strong>at</strong>ions ltd Consumer services 30 070 646 0.32% 0.32%<br />
austin engineering ltd industrials 11 261 332 0.64% 0.64%<br />
australand Property Group Financials 27 772 947 0.33% 0.33%<br />
australia & new Zealand banking Group ltd Financials 1 627 164 812 0.48% 0.48%<br />
australian agricultural Co ltd Consumer Goods 16 407 7<strong>31</strong> 0.64% 0.64%<br />
australian Pharmaceutical industries ltd Consumer services 4 502 965 0.57% 0.57%<br />
automotive <strong>Holding</strong>s Group Consumer services 10 451 799 0.38% 0.38%<br />
aWe ltd oil & Gas 61 673 514 1.48% 1.48%<br />
azumah resources ltd basic m<strong>at</strong>erials 20 068 163 2.84% 2.84%<br />
bank <strong>of</strong> Queensland ltd Financials 69 461 005 0.69% 0.69%<br />
base resources ltd basic m<strong>at</strong>erials 12 508 951 1.02% 1.02%<br />
b<strong>at</strong>hurst resources ltd basic m<strong>at</strong>erials 18 520 942 0.72% 0.72%<br />
beach energy ltd oil & Gas 77 804 375 0.93% 0.93%<br />
beadell resources ltd basic m<strong>at</strong>erials 17 548 261 0.73% 0.73%<br />
bendigo and adelaide bank ltd Financials 113 802 552 0.62% 0.62%<br />
bHP billiton ltd basic m<strong>at</strong>erials 2 222 761 144 0.33% 0.20%<br />
billabong intern<strong>at</strong>ional ltd Consumer Goods 18 415 182 0.67% 0.67%<br />
biota <strong>Holding</strong>s ltd Health Care 4 010 006 0.45% 0.45%<br />
bluescope steel ltd basic m<strong>at</strong>erials 55 091 349 0.66% 0.66%<br />
boart longyear ltd oil & Gas 49 788 363 0.63% 0.63%<br />
boral ltd industrials 102 339 070 0.62% 0.62%<br />
bradken ltd industrials 47 154 424 0.65% 0.65%<br />
brambles ltd industrials 419 053 614 0.65% 0.65%<br />
brockman resources ltd basic m<strong>at</strong>erials 160 461 0.01% 0.01%<br />
bWP trust Financials 35 332 363 0.65% 0.65%<br />
Cabcharge australia ltd industrials 21 155 885 0.64% 0.64%<br />
Cabral resources ltd basic m<strong>at</strong>erials 3 276 372 2.70% 2.70%<br />
Caltex australia ltd oil & Gas 60 995 925 0.<strong>31</strong>% 0.<strong>31</strong>%<br />
Campbell brothers ltd Consumer Goods 129 737 520 0.64% 0.64%<br />
Carbon energy ltd basic m<strong>at</strong>erials 1 748 768 0.40% 0.40%<br />
Cardno ltd industrials 22 460 759 0.63% 0.63%<br />
Carnarvon Petroleum ltd oil & Gas 1 914 952 0.47% 0.47%<br />
carsales.com ltd Consumer services 44 195 712 0.65% 0.65%<br />
Centro retail australia Financials 20 091 683 0.14% 0.14%<br />
CFs retail Property trust Financials 141 015 067 0.48% 0.48%<br />
Challenger Diversified Property Group Financials 12 216 158 0.47% 0.47%<br />
Challenger ltd/au Financials 103 380 486 0.74% 0.74%<br />
Charter Hall Group Financials 17 765 907 0.47% 0.47%<br />
Charter Hall <strong>of</strong>fice reit Financials 68 797 996 0.65% 0.65%<br />
Charter Hall retail reit Financials 37 933 076 0.65% 0.65%<br />
Clough ltd oil & Gas 6 675 540 0.21% 0.21%<br />
Coal <strong>of</strong> africa ltd basic m<strong>at</strong>erials 653 786 0.02% 0.02%<br />
Coalspur mines ltd basic m<strong>at</strong>erials 26 100 443 0.48% 0.48%<br />
Coca-Cola am<strong>at</strong>il ltd Consumer Goods 257 720 172 0.48% 0.48%<br />
Cochlear ltd Health Care 138 263 108 0.64% 0.64%<br />
Cock<strong>at</strong>oo Coal ltd basic m<strong>at</strong>erials 13 677 283 0.59% 0.59%<br />
C<strong>of</strong>fey intern<strong>at</strong>ional ltd industrials 1 922 003 0.<strong>31</strong>% 0.<strong>31</strong>%<br />
Cokal ltd basic m<strong>at</strong>erials 50 592 113 4.63% 4.63%<br />
Commonwealth bank <strong>of</strong> australia Financials 2 383 954 466 0.50% 0.50%<br />
Commonwealth Property <strong>of</strong>fice <strong>Fund</strong> Financials 81 834 999 0.57% 0.57%<br />
Compass resources ltd basic m<strong>at</strong>erials 15 0.00% 0.00%<br />
Computershare ltd Financials 176 198 967 0.65% 0.65%<br />
Consolid<strong>at</strong>ed media <strong>Holding</strong>s ltd Consumer services 34 321 637 0.38% 0.38%<br />
Crown ltd Consumer services 182 002 941 0.50% 0.50%<br />
Csl ltd Health Care 836 259 338 0.82% 0.82%<br />
Csr ltd industrials 125 263 963 2.06% 2.06%<br />
Cudeco ltd basic m<strong>at</strong>erials 863 272 0.02% 0.02%<br />
Customers ltd industrials 4 6<strong>31</strong> 449 0.57% 0.57%<br />
Dart energy ltd basic m<strong>at</strong>erials 11 258 961 0.70% 0.70%<br />
voting<br />
ownership<br />
sector<br />
market value<br />
(noK)<br />
David Jones ltd Consumer services 51 018 951 0.67% 0.67%<br />
Deep Yellow ltd basic m<strong>at</strong>erials 2 644 029 0.29% 0.29%<br />
Dexus Property Group Financials 158 816 463 0.65% 0.65%<br />
Discovery metals ltd basic m<strong>at</strong>erials 25 004 853 0.71% 0.71%<br />
Downer eDi ltd industrials 55 616 672 0.66% 0.66%<br />
DuluxGroup ltd industrials 104 835 466 1.61% 1.61%<br />
echo entertainment Group ltd Consumer services 97 268 039 0.64% 0.64%<br />
elders ltd Consumer Goods 3 899 <strong>31</strong>7 0.55% 0.55%<br />
emeco <strong>Holding</strong>s ltd industrials 24 130 089 0.65% 0.65%<br />
energy resources <strong>of</strong> australia ltd basic m<strong>at</strong>erials 10 573 558 0.27% 0.27%<br />
energy World Corp ltd utilities 35 210 692 0.48% 0.48%<br />
envestra ltd utilities <strong>31</strong> 301 292 0.46% 0.46%<br />
equ<strong>at</strong>orial resources ltd basic m<strong>at</strong>erials 6 626 114 0.57% 0.57%<br />
evolution mining ltd basic m<strong>at</strong>erials 23 181 325 0.36% 0.36%<br />
extract resources ltd basic m<strong>at</strong>erials 33 656 387 0.26% 0.26%<br />
Fairfax media ltd Consumer services 23 418 628 0.23% 0.23%<br />
FKP Property Group Financials 19 299 192 0.55% 0.55%<br />
Fleetwood Corp ltd Consumer Goods 29 5<strong>31</strong> 002 0.68% 0.68%<br />
FlexiGroup ltd/australia Financials 15 239 914 0.48% 0.48%<br />
Flight Centre ltd Consumer services 47 881 963 0.49% 0.49%<br />
Flinders mines ltd basic m<strong>at</strong>erials 18 359 047 0.59% 0.59%<br />
Fortescue metals Group ltd basic m<strong>at</strong>erials 50 876 452 0.06% 0.06%<br />
Galaxy resources ltd basic m<strong>at</strong>erials 8 251 629 0.59% 0.59%<br />
Geodynamics ltd utilities 862 599 0.27% 0.27%<br />
Gindalbie metals ltd basic m<strong>at</strong>erials 15 550 148 0.39% 0.39%<br />
Gloucester Coal ltd basic m<strong>at</strong>erials 127 406 238 1.19% 1.19%<br />
Goodman Fielder ltd Consumer Goods 34 872 153 0.67% 0.67%<br />
Goodman Group Financials 166 796 515 0.62% 0.62%<br />
GPt Group Financials 225 441 825 0.66% 0.66%<br />
GrainCorp ltd Consumer Goods 224 794 056 2.36% 2.36%<br />
Gryphon minerals ltd basic m<strong>at</strong>erials 45 295 067 1.87% 1.87%<br />
GuD <strong>Holding</strong>s ltd Consumer Goods 18 <strong>31</strong>7 676 0.61% 0.61%<br />
Gunns ltd basic m<strong>at</strong>erials 4 999 <strong>31</strong>4 0.77% 0.77%<br />
GWa Group ltd industrials 96 953 964 2.46% 2.46%<br />
Harvey norman <strong>Holding</strong>s ltd Consumer services 59 936 689 0.50% 0.50%<br />
Hastie Group ltd industrials 1 504 977 0.32% 0.32%<br />
Hills <strong>Holding</strong>s ltd industrials 8 774 270 0.52% 0.52%<br />
Horizon oil ltd oil & Gas 6 095 175 0.44% 0.44%<br />
iinet ltd technology 12 903 101 0.50% 0.50%<br />
iluka resources ltd basic m<strong>at</strong>erials 162 541 544 0.41% 0.41%<br />
imdex ltd oil & Gas 12 776 936 0.55% 0.55%<br />
incitec Pivot ltd basic m<strong>at</strong>erials 228 499 454 0.74% 0.74%<br />
independence Group nl basic m<strong>at</strong>erials 30 101 752 0.56% 0.56%<br />
indophil resources nl basic m<strong>at</strong>erials 13 407 809 0.53% 0.53%<br />
industrea ltd industrials 15 540 507 0.71% 0.71%<br />
infigen energy utilities 7 446 045 0.59% 0.59%<br />
insurance australia Group ltd Financials 549 138 352 1.45% 1.45%<br />
integra mining ltd basic m<strong>at</strong>erials 15 528 440 0.56% 0.56%<br />
intern<strong>at</strong>ional Ferro metals ltd basic m<strong>at</strong>erials 6 570 952 0.68% 0.68%<br />
intrepid mines ltd basic m<strong>at</strong>erials 19 682 <strong>31</strong>3 0.56% 0.56%<br />
investa <strong>of</strong>fice <strong>Fund</strong> Financials 65 078 732 0.67% 0.67%<br />
invocare ltd Consumer services 32 834 930 0.63% 0.63%<br />
iooF <strong>Holding</strong>s ltd Financials 46 573 770 0.64% 0.64%<br />
iress market technology ltd technology 36 382 180 0.68% 0.68%<br />
ivanhoe australia ltd basic m<strong>at</strong>erials 7 248 220 0.15% 0.15%<br />
James Hardie industries se industrials 116 684 938 0.64% 0.64%<br />
Jb Hi-Fi ltd Consumer services 47 212 261 0.69% 0.69%<br />
Kagara ltd basic m<strong>at</strong>erials 7 307 206 0.59% 0.59%<br />
Karoon Gas australia ltd oil & Gas 40 890 532 0.67% 0.67%<br />
Kingsg<strong>at</strong>e Consolid<strong>at</strong>ed ltd basic m<strong>at</strong>erials 30 989 6<strong>31</strong> 0.63% 0.63%<br />
leighton <strong>Holding</strong>s ltd industrials 74 841 780 0.19% 0.19%<br />
lend lease Group Financials 160 334 744 0.64% 0.64%<br />
linc energy ltd oil & Gas 14 756 740 0.43% 0.43%<br />
lynas Corp ltd basic m<strong>at</strong>erials 68 118 942 0.62% 0.62%<br />
macmahon <strong>Holding</strong>s ltd basic m<strong>at</strong>erials 17 893 707 0.71% 0.71%<br />
macquarie <strong>at</strong>las roads Group industrials 21 135 996 0.55% 0.55%<br />
macquarie Group ltd Financials 325 447 821 0.64% 0.64%<br />
mcmillan shakespeare ltd Financials 18 1<strong>31</strong> 383 0.49% 0.49%<br />
medusa mining ltd basic m<strong>at</strong>erials 25 274 420 0.49% 0.49%<br />
mermaid marine australia ltd industrials 24 066 114 0.64% 0.64%<br />
mesoblast ltd Health Care 54 735 682 0.46% 0.46%<br />
metcash ltd Consumer services 122 546 373 0.64% 0.64%<br />
miclyn express <strong>of</strong>fshore ltd oil & Gas 16 493 716 0.49% 0.49%<br />
mincor resources nl basic m<strong>at</strong>erials 3 399 718 0.42% 0.42%<br />
mineral Deposits ltd basic m<strong>at</strong>erials 42 819 608 1.65% 1.65%<br />
mineral resources ltd basic m<strong>at</strong>erials 59 959 749 0.48% 0.48%<br />
mirabela nickel ltd basic m<strong>at</strong>erials 19 444 599 0.58% 0.58%<br />
mirvac Group Financials 161 788 489 0.66% 0.66%<br />
monadelphous Group ltd industrials 67 1<strong>31</strong> <strong>31</strong>0 0.61% 0.61%<br />
mount Gibson iron ltd basic m<strong>at</strong>erials 160 589 643 2.16% 2.16%<br />
murchison metals ltd basic m<strong>at</strong>erials 3 926 653 0.33% 0.33%<br />
myer <strong>Holding</strong>s ltd Consumer services 44 244 990 0.64% 0.64%<br />
n<strong>at</strong>ional australia bank ltd Financials 1 398 363 508 0.44% 0.44%<br />
navitas ltd Consumer services 38 639 886 0.48% 0.48%<br />
new Hope Corp ltd basic m<strong>at</strong>erials 52 791 325 0.19% 0.19%<br />
newcrest mining ltd basic m<strong>at</strong>erials 257 657 860 0.19% 0.19%<br />
nexus energy ltd oil & Gas 9 330 662 0.56% 0.56%<br />
northern iron ltd basic m<strong>at</strong>erials 4 549 603 0.<strong>31</strong>% 0.<strong>31</strong>%<br />
nrW <strong>Holding</strong>s ltd industrials 28 416 755 0.65% 0.65%<br />
nufarm ltd/australia basic m<strong>at</strong>erials 33 576 832 0.50% 0.50%<br />
oakton ltd technology 3 220 175 0.45% 0.45%<br />
Country associ<strong>at</strong>ion according to Ftse (the benchmark provider for <strong>equities</strong>). if a company is not in the benchmark, the country <strong>of</strong> incorpor<strong>at</strong>ion is listed. sector classific<strong>at</strong>ion according to iCb (the industry Classific<strong>at</strong>ion<br />
benchmark company).<br />
voting<br />
ownership<br />
HOLdiNgs<br />
1<br />
<strong>Government</strong> <strong>Pension</strong> FunD <strong>Global</strong> ANNUAL REPORT 2011
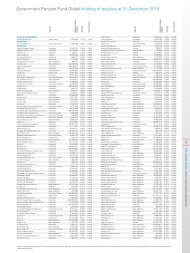
<strong>Government</strong> <strong>Pension</strong> <strong>Fund</strong> <strong>Global</strong> <strong>Holding</strong> <strong>of</strong> <strong>equities</strong> <strong>at</strong> <strong>31</strong> December 2011<br />
sector<br />
market value<br />
(noK)<br />
oil search ltd oil & Gas 498 903 209 0.98% 0.98%<br />
om <strong>Holding</strong>s ltd basic m<strong>at</strong>erials 3 481 693 0.35% 0.35%<br />
onesteel ltd basic m<strong>at</strong>erials 41 487 1<strong>31</strong> 0.72% 0.72%<br />
orica ltd basic m<strong>at</strong>erials 44 700 366 0.08% 0.08%<br />
origin energy ltd utilities 561 722 003 0.63% 0.63%<br />
oZ minerals ltd basic m<strong>at</strong>erials 12 732 448 0.07% 0.07%<br />
Pacific brands ltd Consumer Goods 21 322 673 0.69% 0.69%<br />
Paladin energy ltd basic m<strong>at</strong>erials 41 862 599 0.60% 0.60%<br />
Panaust ltd basic m<strong>at</strong>erials 228 067 075 1.96% 1.96%<br />
Panoramic resources ltd basic m<strong>at</strong>erials 4 507 <strong>31</strong>0 0.<strong>31</strong>% 0.<strong>31</strong>%<br />
PaperlinX ltd basic m<strong>at</strong>erials 1 605 115 0.51% 0.51%<br />
Peet ltd Financials 7 387 433 0.47% 0.47%<br />
Perpetual ltd Financials 36 9<strong>31</strong> 455 0.70% 0.70%<br />
Perseus mining ltd basic m<strong>at</strong>erials 61 299 036 0.92% 0.92%<br />
Pharmaxis ltd Health Care 12 382 476 0.64% 0.64%<br />
Pl<strong>at</strong>inum asset management ltd Financials 29 687 143 0.25% 0.25%<br />
Pl<strong>at</strong>inum australia ltd basic m<strong>at</strong>erials 1 188 955 0.49% 0.49%<br />
Premier investments ltd Financials 41 876 838 0.93% 0.93%<br />
Primary Health Care ltd Health Care 61 425 043 0.65% 0.65%<br />
Primeag australia ltd Consumer Goods 23 302 558 1.34% 1.34%<br />
Programmed maintenance services ltd industrials 8 808 064 0.55% 0.55%<br />
Qantas airways ltd Consumer services 61 900 171 0.<strong>31</strong>% 0.<strong>31</strong>%<br />
Qbe insurance Group ltd Financials 213 926 572 0.24% 0.24%<br />
ramelius resources ltd basic m<strong>at</strong>erials 12 263 588 0.56% 0.56%<br />
ramsay Health Care ltd Health Care 115 913 708 0.49% 0.49%<br />
r<strong>at</strong>el Group ltd basic m<strong>at</strong>erials 1 362 976 0.81% 0.81%<br />
rea Group ltd Financials 25 924 487 0.26% 0.26%<br />
regis resources ltd basic m<strong>at</strong>erials 56 859 445 0.63% 0.63%<br />
reject shop ltd/the Consumer services 7 656 673 0.47% 0.47%<br />
resolute mining ltd basic m<strong>at</strong>erials <strong>31</strong> 566 367 0.65% 0.65%<br />
rex minerals ltd basic m<strong>at</strong>erials 6 976 060 0.53% 0.53%<br />
roc oil Co ltd oil & Gas 4 748 269 0.45% 0.45%<br />
rubicon america trust Financials 498 0.20% 0.20%<br />
sai <strong>Global</strong> ltd industrials 33 6<strong>31</strong> 934 0.60% 0.60%<br />
sandfire resources nl basic m<strong>at</strong>erials 87 138 451 1.43% 1.43%<br />
santos ltd oil & Gas 466 093 7<strong>31</strong> 0.66% 0.66%<br />
saracen mineral <strong>Holding</strong>s ltd basic m<strong>at</strong>erials 16 960 137 0.62% 0.62%<br />
seek ltd industrials 77 855 557 0.67% 0.67%<br />
seven Group <strong>Holding</strong>s ltd Consumer services 26 685 017 0.20% 0.20%<br />
seven West media ltd Consumer services 22 809 5<strong>31</strong> 0.18% 0.18%<br />
sigma Pharmaceuticals ltd Consumer services 25 447 309 0.64% 0.64%<br />
silex systems ltd industrials 18 874 551 0.74% 0.74%<br />
silver lake resources ltd basic m<strong>at</strong>erials 21 290 778 0.52% 0.52%<br />
sims metal management ltd basic m<strong>at</strong>erials 12 574 076 0.08% 0.08%<br />
skilled Group ltd industrials 12 7<strong>31</strong> 573 0.54% 0.54%<br />
sonic Healthcare ltd Health Care 173 476 961 0.64% 0.64%<br />
sP ausnet utilities 57 519 481 0.35% 0.35%<br />
spark infrastructure Group utilities 68 417 393 0.61% 0.61%<br />
spotless Group ltd industrials 52 779 591 1.37% 1.37%<br />
st barbara ltd basic m<strong>at</strong>erials 25 246 036 0.65% 0.65%<br />
stockland Financials 300 970 888 0.67% 0.67%<br />
straits resources ltd basic m<strong>at</strong>erials 8 717 080 0.67% 0.67%<br />
stW Communic<strong>at</strong>ions Group ltd Consumer services 7 827 035 0.42% 0.42%<br />
suncorp Group ltd Financials 426 722 845 0.65% 0.65%<br />
sundance resources ltd basic m<strong>at</strong>erials 42 467 489 0.60% 0.60%<br />
sunland Group ltd Financials 5 194 006 0.64% 0.64%<br />
super retail Group ltd Consumer services 72 918 305 1.16% 1.16%<br />
sydney airport industrials 86 546 895 0.29% 0.29%<br />
tabCorP <strong>Holding</strong>s ltd Consumer services 74 411 429 0.62% 0.62%<br />
tandou ltd Consumer Goods 13 501 577 4.50% 4.50%<br />
tap oil ltd oil & Gas 3 217 <strong>31</strong>8 0.37% 0.37%<br />
t<strong>at</strong>ts Group ltd Consumer services 129 037 756 0.64% 0.64%<br />
telstra Corp ltd telecommunic<strong>at</strong>ions 57 850 366 0.02% 0.02%<br />
ten network <strong>Holding</strong>s ltd Consumer services 25 290 814 0.47% 0.47%<br />
tiger resources ltd basic m<strong>at</strong>erials 9 436 807 0.63% 0.63%<br />
toll <strong>Holding</strong>s ltd industrials 118 555 967 0.64% 0.64%<br />
tPG telecom ltd telecommunic<strong>at</strong>ions 16 505 120 0.26% 0.26%<br />
transfield services ltd industrials 50 748 164 0.70% 0.70%<br />
transpacific industries Group ltd industrials 132 469 865 1.68% 1.68%<br />
transurban Group industrials 427 602 107 0.86% 0.86%<br />
treasury Wine est<strong>at</strong>es ltd Consumer Goods 362 761 132 2.49% 2.49%<br />
troy resources ltd basic m<strong>at</strong>erials 14 730 747 0.64% 0.64%<br />
uGl ltd industrials 80 233 844 0.66% 0.66%<br />
virgin australia <strong>Holding</strong>s ltd Consumer services 23 987 079 0.62% 0.62%<br />
W<strong>at</strong>pac ltd industrials 9 825 005 0.82% 0.82%<br />
Wesfarmers ltd Consumer services 1 347 157 924 0.64% 0.64%<br />
Western areas nl basic m<strong>at</strong>erials 28 583 924 0.51% 0.51%<br />
Westfield Group Financials 552 234 066 0.50% 0.50%<br />
Westfield retail trust Financials 307 363 005 0.66% 0.66%<br />
Westpac banking Corp Financials 1 439 056 756 0.39% 0.39%<br />
White energy Co ltd basic m<strong>at</strong>erials 3 945 723 0.54% 0.54%<br />
Whitehaven Coal ltd basic m<strong>at</strong>erials 50 432 620 0.32% 0.32%<br />
WHK Group ltd Financials 5 805 711 0.43% 0.43%<br />
Woodside Petroleum ltd oil & Gas 985 134 929 0.65% 0.65%<br />
Woolworths ltd Consumer services 1 204 153 435 0.64% 0.64%<br />
WorleyParsons ltd oil & Gas 245 190 859 0.65% 0.65%<br />
Wotif.com <strong>Holding</strong>s ltd Consumer services 17 118 237 0.37% 0.37%<br />
AUsTRiA<br />
andritz aG industrials 435 767 376 1.69% 1.69%<br />
<strong>at</strong>rium european real est<strong>at</strong>e ltd Financials 156 032 013 1.55% 1.55%<br />
bWt aG industrials 7 552 598 0.42% 0.42%<br />
voting<br />
ownership<br />
sector<br />
market value<br />
(noK)<br />
Ca immobilien anlagen aG Financials 142 650 619 2.53% 2.53%<br />
Conwert immobilien invest se Financials 143 467 963 2.54% 2.54%<br />
erste Group bank aG Financials 570 728 763 1.42% 1.42%<br />
Flughafen Wien aG industrials 45 336 355 0.95% 0.95%<br />
immoFinanZ aG Financials 449 913 019 2.87% 2.87%<br />
intercell aG Health Care 14 341 529 2.01% 2.01%<br />
Kapsch trafficCom aG industrials 45 955 722 0.78% 0.78%<br />
lenzing aG basic m<strong>at</strong>erials 79 257 920 0.58% 0.58%<br />
mayr melnh<strong>of</strong> Karton aG industrials 93 921 100 0.93% 0.93%<br />
oesterreichische Post aG industrials 139 994 243 1.15% 1.15%<br />
omv aG oil & Gas 473 472 218 0.80% 0.80%<br />
Palfinger aG industrials 15 624 024 0.46% 0.46%<br />
raiffeisen bank intern<strong>at</strong>ional aG Financials 193 789 826 0.64% 0.64%<br />
rHi aG industrials 77 792 350 1.67% 1.67%<br />
s immo aG Financials 18 371 418 0.77% 0.77%<br />
schoeller-bleckmann oilfield equipment aG oil & Gas 134 549 142 1.59% 1.59%<br />
semperit aG <strong>Holding</strong> industrials 67 757 561 1.43% 1.43%<br />
strabag se industrials 125 337 421 0.64% 0.64%<br />
telekom austria aG telecommunic<strong>at</strong>ions 1 162 606 525 3.67% 3.67%<br />
verbund aG utilities 291 526 848 0.52% 0.52%<br />
vienna insurance Group aG Wiener<br />
versicherung Gruppe Financials 11 700 508 0.04% 0.04%<br />
voestalpine aG basic m<strong>at</strong>erials 1 032 463 959 3.64% 3.64%<br />
Warimpex Finanz- und beteiligungs aG Financials 8 203 009 2.96% 2.96%<br />
Wienerberger aG industrials 142 191 066 2.24% 2.24%<br />
Zumtobel aG industrials 39 694 470 1.10% 1.10%<br />
BAHRAiN<br />
aluminium bahrain bsC basic m<strong>at</strong>erials 454 144 167 0.00% 3.06%<br />
BELgiUm<br />
ackermans & van Haaren nv Financials 253 304 208 1.69% 1.69%<br />
ageas Financials 1 381 573 488 5.66% 5.87%<br />
aGFa-Gevaert nv industrials 45 395 489 2.77% 2.77%<br />
anheuser-busch inbev nv Consumer Goods 7 100 761 403 1.21% 1.21%<br />
barco nv industrials 70 214 170 1.83% 1.83%<br />
befimmo sCa sicafi Financials 169 467 138 2.39% 2.39%<br />
belgacom sa telecommunic<strong>at</strong>ions 265 391 065 0.42% 0.42%<br />
Cie d’entreprises CFe industrials 84 592 488 2.20% 2.20%<br />
Cie maritime belge sa industrials 50 875 892 1.11% 1.11%<br />
C<strong>of</strong>inimmo Financials 225 712 928 2.10% 2.10%<br />
Colruyt sa Consumer services 379 733 971 1.00% 1.00%<br />
Delhaize Group sa Consumer services 772 694 974 2.26% 2.26%<br />
Dexia sa Financials 40 651 782 0.91% 0.91%<br />
D’ieteren sa/nv Consumer services 160 748 910 1.10% 1.10%<br />
Duvel moortg<strong>at</strong> sa Consumer Goods 4 696 371 0.16% 0.16%<br />
elia system oper<strong>at</strong>or sa/nv utilities 7 647 0.02% 0.02%<br />
euronav nv industrials 12 156 991 0.81% 0.81%<br />
evs broadcast equipment sa industrials 113 485 625 2.72% 2.72%<br />
exmar nv industrials 2 002 0.00% 0.00%<br />
Gimv nv Financials 77 947 046 1.18% 1.18%<br />
Groupe bruxelles lambert sa Financials 958 556 150 1.49% 1.49%<br />
intervest <strong>of</strong>fices & Warehouses Financials 6 037 658 0.<strong>31</strong>% 0.<strong>31</strong>%<br />
ion beam applic<strong>at</strong>ions Health Care 6 407 890 0.63% 0.63%<br />
KbC ancora Financials 18 010 176 0.61% 0.61%<br />
KbC Groep nv Financials 208 <strong>31</strong>4 063 0.77% 0.77%<br />
melexis nv technology 45 762 390 1.32% 1.32%<br />
mobistar sa telecommunic<strong>at</strong>ions 34 696 396 0.18% 0.18%<br />
nv bekaert sa industrials 225 393 606 1.96% 1.96%<br />
nyrstar basic m<strong>at</strong>erials 282 261 728 3.51% 3.51%<br />
omega Pharma Health Care 123 288 552 1.83% 1.83%<br />
recticel sa basic m<strong>at</strong>erials 4 222 892 0.41% 0.41%<br />
rHJ intern<strong>at</strong>ional Financials 40 723 072 1.75% 1.75%<br />
roularta media Group nv Consumer services 13 798 576 0.93% 0.93%<br />
sipef sa Consumer Goods 16 362 828 0.41% 0.41%<br />
s<strong>of</strong>ina sa Financials 183 198 872 1.12% 1.12%<br />
solvay sa basic m<strong>at</strong>erials 448 684 575 1.07% 1.07%<br />
telenet Group <strong>Holding</strong> nv Consumer services 1 168 528 025 4.51% 4.51%<br />
tessenderlo Chemie nv basic m<strong>at</strong>erials 108 947 472 2.32% 2.32%<br />
thromboGenics nv Health Care 95 754 324 2.02% 2.02%<br />
uCb sa Health Care 752 498 953 1.63% 1.63%<br />
umicore sa basic m<strong>at</strong>erials 492 727 632 1.66% 1.66%<br />
van de velde nv Consumer Goods 22 093 478 0.61% 0.61%<br />
Warehouses De Pauw sCa Financials 34 303 032 0.88% 0.88%<br />
Wereldhave belgium nv Financials 5 678 429 0.21% 0.21%<br />
BERmUdA<br />
madagascar oil ltd oil & Gas 9 878 677 2.73% 2.73%<br />
omega insurance <strong>Holding</strong>s ltd Financials 46 114 644 3.70% 3.70%<br />
BRAziL<br />
aes tiete sa utilities 89 278 635 0.29% 0.29%<br />
aliansce shopping Centers sa Financials 68 887 548 1.08% 1.08%<br />
all america l<strong>at</strong>ina logistica sa industrials 1<strong>31</strong> 001 646 0.64% 0.64%<br />
alparg<strong>at</strong>as sa Consumer Goods 375 060 350 0.00% 2.67%<br />
amil Participacoes sa Health Care 9 793 514 0.05% 0.05%<br />
autometal sa industrials 133 387 745 2.39% 2.39%<br />
banco bradesco sa Financials 1 546 605 634 0.00% 0.41%<br />
banco do brasil sa Financials 571 994 138 0.26% 0.26%<br />
banco santander brasil sa/brazil Financials 488 386 729 0.27% 0.27%<br />
bm&Fbovespa sa Financials 329 905 778 0.53% 0.53%<br />
br malls Participacoes sa Financials 226 943 842 0.87% 0.87%<br />
br Properties sa Financials 12 286 6<strong>31</strong> 0.12% 0.12%<br />
bradespar sa Financials 415 462 743 0.00% 1.17%<br />
brasil telecom sa telecommunic<strong>at</strong>ions 234 628 407 0.00% 1.12%<br />
Country associ<strong>at</strong>ion according to Ftse (the benchmark provider for <strong>equities</strong>). if a company is not in the benchmark, the country <strong>of</strong> incorpor<strong>at</strong>ion is listed. sector classific<strong>at</strong>ion according to iCb (the industry Classific<strong>at</strong>ion<br />
benchmark company).<br />
voting<br />
ownership<br />
HOLdiNgs<br />
2<br />
<strong>Government</strong> <strong>Pension</strong> FunD <strong>Global</strong> ANNUAL REPORT 2011
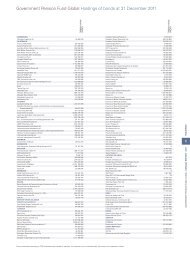
<strong>Government</strong> <strong>Pension</strong> <strong>Fund</strong> <strong>Global</strong> <strong>Holding</strong> <strong>of</strong> <strong>equities</strong> <strong>at</strong> <strong>31</strong> December 2011<br />
sector<br />
market value<br />
(noK)<br />
brF - brasil Foods sa Consumer Goods 463 109 607 0.42% 0.46%<br />
Camargo Correa Desenvolvimento<br />
imobiliario sa Financials 4 390 360 0.30% 0.30%<br />
CCr sa industrials 148 213 043 0.21% 0.21%<br />
Centrais eletricas brasileiras sa utilities 102 294 205 0.16% 0.13%<br />
CetiP sa - balcao organizado de <strong>at</strong>ivos<br />
e Deriv<strong>at</strong>ivos Financials 62 491 297 0.29% 0.29%<br />
Cia de bebidas das americas Consumer Goods 1 156 786 086 0.00% 0.17%<br />
Cia de Gas de sao Paulo utilities 26 247 669 0.00% 0.16%<br />
Cia de saneamento de minas Gerais-CoPasa utilities 13 472 550 0.11% 0.11%<br />
Cia energetica de sao Paulo utilities 754 551 683 0.00% 2.18%<br />
Cia Ferro ligas da bahia - Ferbasa basic m<strong>at</strong>erials 115 843 021 0.00% 4.99%<br />
Cia Hering Consumer Goods 612 0<strong>31</strong> 357 3.61% 3.61%<br />
Cia Paranaense de energia utilities 345 626 864 0.25% 1.03%<br />
Cia Providencia industria e Comercio sa basic m<strong>at</strong>erials 19 837 175 1.25% 1.25%<br />
Cielo sa Financials 469 025 932 0.56% 0.56%<br />
Confab industrial sa basic m<strong>at</strong>erials 179 013 041 0.00% 3.<strong>31</strong>%<br />
Cosan ltd Consumer Goods 24 232 889 0.03% 0.14%<br />
Cosan sa industria e Comercio Consumer Goods 388 983 235 1.11% 1.11%<br />
Cr2 empreendimentos imobiliarios sa Financials 26 989 697 2.97% 2.97%<br />
Diagnosticos da america sa Health Care 186 454 465 1.21% 1.21%<br />
Dur<strong>at</strong>ex sa industrials 28 064 660 0.18% 0.18%<br />
ecorodovias infraestrutura e logistica sa industrials 14 822 342 0.06% 0.06%<br />
eDP - energias do brasil sa utilities 398 104 126 1.89% 1.89%<br />
embraer sa industrials 59 554 243 0.21% 0.21%<br />
equ<strong>at</strong>orial energia sa utilities 177 429 817 4.01% 4.01%<br />
euc<strong>at</strong>ex sa industria e Comercio industrials 21 084 997 0.00% 1.08%<br />
even Construtora e incorporadora sa Financials 99 649 649 2.16% 2.16%<br />
ez tec empreendimentos e Participacoes sa Financials 148 949 8<strong>31</strong> 2.01% 2.01%<br />
Gerdau sa basic m<strong>at</strong>erials 518 975 737 0.14% 0.66%<br />
Helbor empreendimentos sa Financials 122 539 994 2.84% 2.84%<br />
Hrt Participacoes em Petroleo sa oil & Gas 27 805 320 0.26% 0.26%<br />
Hypermarcas sa Consumer Goods 140 309 087 0.82% 0.82%<br />
iochpe-maxion sa Consumer Goods 351 485 772 4.59% 4.59%<br />
itau unibanco <strong>Holding</strong> sa Financials 1 946 489 614 0.01% 0.39%<br />
itausa - investimentos itau sa Financials 1 <strong>31</strong>7 823 852 0.00% 0.83%<br />
Klabin sa industrials 73 534 026 0.00% 0.<strong>31</strong>%<br />
light sa utilities 389 737 607 2.07% 2.07%<br />
llX logistica sa industrials 442 230 739 5.91% 5.91%<br />
localiza rent a Car sa Consumer services 139 562 627 0.84% 0.84%<br />
lojas americanas sa Consumer services 152 869 755 0.00% 0.43%<br />
lojas renner sa Consumer services 28 364 220 0.15% 0.15%<br />
lup<strong>at</strong>ech sa oil & Gas 15 469 984 2.28% 2.28%<br />
m Dias branco sa Consumer Goods 116 100 070 0.67% 0.67%<br />
mahle-metal leve sa industria e Comercio Consumer Goods 32 932 062 0.57% 0.57%<br />
marcopolo sa industrials 397 650 482 0.00% 3.91%<br />
marfrig alimentos sa Consumer Goods 38 371 027 0.40% 0.40%<br />
metalfrio solutions sa Consumer Goods 18 213 406 2.50% 2.50%<br />
metalurgica Gerdau sa basic m<strong>at</strong>erials 2 271 066 0.00% 0.01%<br />
millennium inorganic Chemicals do brasil sa basic m<strong>at</strong>erials 46 153 426 0.00% 4.44%<br />
multiplan empreendimentos imobiliarios sa Financials 137 440 264 0.67% 0.63%<br />
multiplus sa Consumer services 436 584 242 2.62% 2.62%<br />
n<strong>at</strong>ura Cosmeticos sa Consumer Goods 768 174 665 1.54% 1.54%<br />
obrascon Huarte lain brasil sa industrials 133 544 237 0.99% 0.99%<br />
oGX Petroleo e Gas Participacoes sa oil & Gas 201 606 255 0.14% 0.14%<br />
osX brasil sa oil & Gas 79 185 082 0.77% 0.77%<br />
Parana banco sa Financials 20 851 533 0.00% 0.69%<br />
PDG realty sa empreendimentos<br />
e Participacoes Financials 277 526 379 1.<strong>31</strong>% 1.<strong>31</strong>%<br />
Petroleo brasileiro sa oil & Gas 6 868 568 282 0.40% 0.74%<br />
Porto seguro sa Financials 22 302 456 0.10% 0.10%<br />
Positivo inform<strong>at</strong>ica sa technology 9 757 507 0.60% 0.60%<br />
QGeP Participacoes sa oil & Gas 38 484 874 0.27% 0.27%<br />
randon Participacoes sa industrials 54 447 723 0.00% 0.82%<br />
redecard sa Financials 550 466 015 0.88% 0.88%<br />
santos brasil Participacoes sa industrials 150 282 288 0.00% 1.45%<br />
sao Carlos empreendimentos<br />
e Participacoes sa Financials 14 170 973 0.32% 0.32%<br />
sao martinho sa Consumer Goods 85 756 148 1.42% 1.42%<br />
schulz sa Consumer Goods 81 588 380 0.00% 4.00%<br />
slC agricola sa Consumer Goods 51 995 566 1.06% 1.06%<br />
sonae sierra brasil sa Financials 48 051 217 0.82% 0.82%<br />
suzano Papel e Celulose sa basic m<strong>at</strong>erials 65 134 883 0.00% 0.74%<br />
tam sa Consumer services 97 052 135 0.00% 0.54%<br />
technos sa Consumer Goods 118 582 815 3.08% 3.08%<br />
tecnisa sa Consumer Goods 168 336 036 2.82% 2.82%<br />
tele norte leste telecommunic<strong>at</strong>ions 188 585 719 0.80% 0.63%<br />
telefonica brasil sa telecommunic<strong>at</strong>ions 1 2<strong>31</strong> 796 353 0.00% 0.66%<br />
telemar norte leste sa telecommunic<strong>at</strong>ions 15 301 833 0.00% 0.03%<br />
tim Participacoes sa telecommunic<strong>at</strong>ions 103 473 263 0.14% 0.14%<br />
tPi - triunfo Participacoes e investimentos sa industrials 187 444 947 4.27% 4.27%<br />
tractebel energia sa utilities 150 161 430 0.24% 0.24%<br />
tupy sa basic m<strong>at</strong>erials 74 393 481 1.47% 1.46%<br />
ultrapar Participacoes sa utilities 260 606 945 0.47% 0.47%<br />
usinas siderurgicas de minas Gerais sa basic m<strong>at</strong>erials 25 038 514 0.00% 0.08%<br />
vale sa basic m<strong>at</strong>erials 3 508 679 724 0.38% 0.53%<br />
valid solucoes e servicos de seguranca em<br />
meios de Pagamento e identificacao s.a industrials <strong>31</strong> 387 530 0.81% 0.81%<br />
Weg sa industrials 51 716 961 0.14% 0.14%<br />
voting<br />
ownership<br />
sector<br />
market value<br />
(noK)<br />
CANAdA<br />
advantage oil & Gas ltd oil & Gas 27 201 947 0.66% 0.66%<br />
aecon Group inc industrials 25 472 673 0.74% 0.74%<br />
aGF management ltd Financials 61 271 768 0.00% 0.69%<br />
agnico-eagle mines ltd basic m<strong>at</strong>erials 251 789 115 0.68% 0.68%<br />
agrium inc basic m<strong>at</strong>erials 816 168 426 1.29% 1.29%<br />
alacer Gold Corp basic m<strong>at</strong>erials 116 732 147 0.68% 0.68%<br />
alamos Gold inc basic m<strong>at</strong>erials 85 328 191 0.70% 0.70%<br />
algonquin Power & utilities Corp utilities 12 109 181 0.24% 0.24%<br />
aliment<strong>at</strong>ion Couche tard inc Consumer services 158 686 790 0.13% 0.48%<br />
allied Properties real est<strong>at</strong>e investment<br />
trust Financials 53 891 291 0.71% 0.71%<br />
altaGas ltd oil & Gas 107 727 683 0.65% 0.63%<br />
arC resources ltd oil & Gas 224 104 433 0.53% 0.53%<br />
artis real est<strong>at</strong>e investment trust Financials 48 691 952 0.67% 0.67%<br />
astral media inc Consumer services 77 204 290 0.00% 0.67%<br />
<strong>at</strong>co ltd/Canada utilities 125 098 647 0.00% 0.61%<br />
<strong>at</strong>habasca oil sands Corp oil & Gas 198 856 608 0.68% 0.68%<br />
<strong>at</strong>lantic Power Corp utilities 64 222 211 0.67% 0.67%<br />
<strong>at</strong>rium innov<strong>at</strong>ions inc Consumer Goods 9 472 613 0.42% 0.42%<br />
<strong>at</strong>s autom<strong>at</strong>ion tooling systems inc industrials 23 096 534 0.70% 0.70%<br />
aura minerals inc basic m<strong>at</strong>erials 7 054 445 0.42% 0.42%<br />
aurico Gold inc basic m<strong>at</strong>erials 89 942 444 0.67% 0.67%<br />
aurizon mines ltd basic m<strong>at</strong>erials <strong>31</strong> 961 134 0.67% 0.67%<br />
avion Gold Corp basic m<strong>at</strong>erials 21 277 284 0.51% 0.51%<br />
azure Dynamics Corp oil & Gas 1 410 520 0.47% 0.47%<br />
b2Gold Corp basic m<strong>at</strong>erials 27 584 303 0.40% 0.40%<br />
ballard Power systems inc oil & Gas 39 972 0.01% 0.01%<br />
bank <strong>of</strong> montreal Financials 1 406 418 452 0.67% 0.67%<br />
bank <strong>of</strong> nova scotia Financials 2 180 386 755 0.67% 0.67%<br />
bankers Petroleum ltd oil & Gas 88 988 287 1.38% 1.38%<br />
banro Corp basic m<strong>at</strong>erials 24 976 819 0.57% 0.57%<br />
baytex energy Corp oil & Gas 181 941 342 0.46% 0.46%<br />
bCe inc telecommunic<strong>at</strong>ions 250 881 808 0.13% 0.13%<br />
bell aliant inc telecommunic<strong>at</strong>ions 59 525 005 0.16% 0.16%<br />
bioexx specialty Proteins ltd basic m<strong>at</strong>erials 937 758 0.44% 0.44%<br />
birchcliff energy ltd oil & Gas 71 457 027 0.71% 0.71%<br />
blackPearl resources inc oil & Gas 45 611 823 0.67% 0.67%<br />
boardwalk real est<strong>at</strong>e investment trust Financials 98 071 102 0.64% 0.64%<br />
bombardier inc industrials 237 895 226 0.29% 0.57%<br />
bonavista energy Corp oil & Gas 106 484 248 0.49% 0.43%<br />
bonterra energy Corp oil & Gas 37 199 722 0.64% 0.64%<br />
brookfield asset management inc Financials 696 212 471 0.68% 0.68%<br />
brookfield <strong>of</strong>fice Properties inc Financials 237 5<strong>31</strong> 245 0.50% 0.50%<br />
Cae inc industrials 103 842 905 0.70% 0.70%<br />
Calfrac Well services ltd oil & Gas 34 932 183 0.48% 0.48%<br />
Calloway real est<strong>at</strong>e investment trust Financials 110 862 369 0.57% 0.57%<br />
Cameco Corp basic m<strong>at</strong>erials 297 037 282 0.70% 0.70%<br />
Canaccord Financial inc Financials 26 122 544 0.68% 0.68%<br />
Canadian apartment Properties reit Financials 71 690 244 0.65% 0.65%<br />
Canadian imperial bank <strong>of</strong> Commerce/Canada Financials 1 154 748 <strong>31</strong>3 0.67% 0.67%<br />
Canadian n<strong>at</strong>ional railway Co industrials 1 018 183 786 0.49% 0.49%<br />
Canadian n<strong>at</strong>ural resources ltd oil & Gas 1 901 347 015 0.78% 0.78%<br />
Canadian oil sands ltd oil & Gas 298 794 183 0.45% 0.45%<br />
Canadian Pacific railway ltd industrials 467 304 809 0.68% 0.68%<br />
Canadian real est<strong>at</strong>e investment trust Financials 93 061 981 0.67% 0.67%<br />
Canadian tire Corp ltd Consumer services 207 966 164 0.00% 0.66%<br />
Canadian utilities ltd utilities 213 360 769 0.00% 0.46%<br />
Canadian Western bank Financials 75 027 585 0.66% 0.66%<br />
Canfor Corp basic m<strong>at</strong>erials 48 220 695 0.54% 0.54%<br />
Capital Power Corp utilities 33 420 754 0.00% 0.46%<br />
Capstone mining Corp basic m<strong>at</strong>erials 41 115 715 0.67% 0.67%<br />
Cardiome Pharma Corp Health Care 7 405 134 0.77% 0.77%<br />
Cascades inc basic m<strong>at</strong>erials 14 772 368 0.60% 0.60%<br />
CCl industries inc industrials 36 747 928 0.00% 0.60%<br />
Celestica inc industrials 58 911 741 0.20% 0.62%<br />
Celtic explor<strong>at</strong>ion ltd oil & Gas 94 219 672 0.67% 0.67%<br />
Cenovus energy inc oil & Gas 1 012 210 768 0.68% 0.68%<br />
Centerra Gold inc basic m<strong>at</strong>erials 129 321 799 0.52% 0.52%<br />
CGa mining ltd basic m<strong>at</strong>erials 26 496 491 0.66% 0.66%<br />
CGi Group inc technology 175 763 892 0.28% 0.60%<br />
Chartwell seniors Housing real est<strong>at</strong>e<br />
investment trust Financials 51 652 553 0.72% 0.72%<br />
China Gold intern<strong>at</strong>ional resources Corp ltd basic m<strong>at</strong>erials 45 447 261 0.80% 0.80%<br />
Chinook energy inc oil & Gas 10 342 234 0.51% 0.51%<br />
Ci Financial Corp Financials 182 377 651 0.52% 0.52%<br />
Cineplex inc Consumer services 37 933 669 0.43% 0.43%<br />
Clifton star resources inc basic m<strong>at</strong>erials 30 392 207 5.94% 5.94%<br />
Cml HealthCare inc Health Care 35 062 935 0.69% 0.69%<br />
Cogeco Cable inc Consumer services 69 246 167 0.12% 0.47%<br />
Cominar real est<strong>at</strong>e investment trust Financials 58 305 222 0.59% 0.59%<br />
Connacher oil and Gas ltd oil & Gas 22 054 080 1.10% 1.10%<br />
Corridor resources inc oil & Gas 105 876 0.02% 0.02%<br />
Corus entertainment inc Consumer services 63 958 2<strong>31</strong> 0.00% 0.64%<br />
Cott Corp Consumer Goods 22 846 184 0.64% 0.64%<br />
Crescent Point energy Corp oil & Gas 509 458 447 0.67% 0.67%<br />
Crew energy inc oil & Gas 140 770 812 1.78% 1.78%<br />
Davis & Henderson Corp industrials 39 345 534 0.67% 0.67%<br />
Denison mines Corp basic m<strong>at</strong>erials 18 272 413 0.64% 0.64%<br />
Detour Gold Corp basic m<strong>at</strong>erials 99 267 925 0.68% 0.68%<br />
Dollarama inc Consumer services 126 804 077 0.66% 0.66%<br />
Country associ<strong>at</strong>ion according to Ftse (the benchmark provider for <strong>equities</strong>). if a company is not in the benchmark, the country <strong>of</strong> incorpor<strong>at</strong>ion is listed. sector classific<strong>at</strong>ion according to iCb (the industry Classific<strong>at</strong>ion<br />
benchmark company).<br />
voting<br />
ownership<br />
HOLdiNgs<br />
3<br />
<strong>Government</strong> <strong>Pension</strong> FunD <strong>Global</strong> ANNUAL REPORT 2011
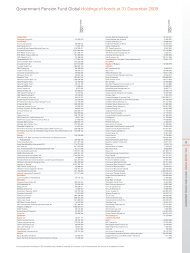
<strong>Government</strong> <strong>Pension</strong> <strong>Fund</strong> <strong>Global</strong> <strong>Holding</strong> <strong>of</strong> <strong>equities</strong> <strong>at</strong> <strong>31</strong> December 2011<br />
sector<br />
market value<br />
(noK)<br />
Dorel industries inc Consumer Goods 29 611 961 0.28% 0.62%<br />
Dundee Corp Financials 45 473 109 0.21% 0.62%<br />
Dundee Precious metals inc basic m<strong>at</strong>erials 168 598 771 2.79% 2.79%<br />
Dundee real est<strong>at</strong>e investment trust Financials 85 915 995 0.65% 0.65%<br />
eastern Pl<strong>at</strong>inum ltd basic m<strong>at</strong>erials 18 975 020 0.66% 0.66%<br />
eldorado Gold Corp basic m<strong>at</strong>erials 304 946 417 0.67% 0.67%<br />
emera inc utilities 160 163 <strong>31</strong>2 0.68% 0.68%<br />
empire Co ltd Consumer services 79 985 014 0.00% 0.34%<br />
enbridge inc oil & Gas 629 448 191 0.36% 0.36%<br />
encana Corp oil & Gas 474 032 293 0.58% 0.58%<br />
endeavour silver Corp basic m<strong>at</strong>erials 28 050 849 0.55% 0.55%<br />
enerflex ltd oil & Gas 39 600 383 0.66% 0.66%<br />
enerplus Corp oil & Gas 151 942 095 1.<strong>31</strong>% 0.55%<br />
ensign energy services inc oil & Gas 102 478 881 0.70% 0.70%<br />
entertainment one ltd Consumer services 80 054 432 2.02% 2.02%<br />
european Goldfields ltd basic m<strong>at</strong>erials 89 249 565 0.70% 0.70%<br />
extendicare real est<strong>at</strong>e investment trust Financials 30 <strong>31</strong>5 038 0.72% 0.72%<br />
Fairborne energy ltd oil & Gas 12 856 712 0.72% 0.72%<br />
Fairfax Financial <strong>Holding</strong>s ltd Financials 349 406 216 0.39% 0.64%<br />
Finning intern<strong>at</strong>ional inc industrials 153 572 594 0.69% 0.69%<br />
First Capital realty inc Financials 44 961 618 0.26% 0.26%<br />
First majestic silver Corp basic m<strong>at</strong>erials 63 293 227 0.60% 0.60%<br />
First n<strong>at</strong>ional Financial Corp Financials 11 973 346 0.20% 0.20%<br />
First Quantum minerals ltd basic m<strong>at</strong>erials 380 822 873 0.68% 0.68%<br />
Firstservice Corp/Canada Financials <strong>31</strong> 574 767 0.36% 0.67%<br />
Flint energy services ltd oil & Gas 97 732 794 2.72% 2.72%<br />
Fortis inc/Canada utilities 247 921 973 0.68% 0.68%<br />
Franco-nevada Corp Financials 400 217 877 1.27% 1.27%<br />
Gabriel resources ltd basic m<strong>at</strong>erials 49 200 614 0.35% 0.35%<br />
Genworth mi Canada inc Financials 43 829 964 0.37% 0.37%<br />
George Weston ltd Consumer services 138 722 722 0.27% 0.27%<br />
Gibson energy inc oil & Gas 37 195 519 0.36% 0.36%<br />
Gildan activewear inc Consumer Goods 94 107 508 0.69% 0.69%<br />
GmP Capital inc Financials 20 423 687 0.70% 0.70%<br />
Goldcorp inc basic m<strong>at</strong>erials 1 069 468 546 0.47% 0.50%<br />
Golden star resources ltd basic m<strong>at</strong>erials 17 044 520 0.67% 0.67%<br />
Gre<strong>at</strong> basin Gold ltd basic m<strong>at</strong>erials 17 728 764 0.67% 0.67%<br />
Gre<strong>at</strong> Canadian Gaming Corp Consumer services 29 861 177 0.74% 0.74%<br />
Gre<strong>at</strong>-West lifeco inc Financials 229 873 766 0.20% 0.20%<br />
Groupe aeroplan inc Consumer services 86 888 167 0.71% 0.71%<br />
Guide explor<strong>at</strong>ion ltd oil & Gas 139 794 0.01% 0.01%<br />
Guyana Goldfields inc basic m<strong>at</strong>erials 87 976 741 2.39% 2.39%<br />
GWr <strong>Global</strong> W<strong>at</strong>er resources Corp utilities 7 123 911 3.98% 3.98%<br />
H&r real est<strong>at</strong>e investment trust Financials 153 146 801 0.65% 0.65%<br />
Hanfeng evergreen inc basic m<strong>at</strong>erials 151 007 0.02% 0.02%<br />
Harry Winston Diamond Corp basic m<strong>at</strong>erials 27 883 041 0.52% 0.52%<br />
Home Capital Group inc Financials 66 925 116 0.67% 0.67%<br />
HomeQ Corp Financials 1 122 0.00% 0.00%<br />
Hudbay minerals inc basic m<strong>at</strong>erials 72 000 771 0.70% 0.70%<br />
Husky energy inc oil & Gas 327 228 196 0.24% 0.24%<br />
iamGolD Corp basic m<strong>at</strong>erials 239 159 407 0.67% 0.67%<br />
iGm Financial inc Financials 226 188 517 0.34% 0.34%<br />
imax Corp Consumer services 46 613 342 0.66% 0.66%<br />
imperial metals Corp basic m<strong>at</strong>erials 65 609 940 1.21% 1.21%<br />
imperial oil ltd oil & Gas 613 552 632 0.27% 0.27%<br />
industrial alliance insurance & Financial<br />
services inc Financials 93 437 201 0.67% 0.67%<br />
inmet mining Corp basic m<strong>at</strong>erials 178 368 202 0.67% 0.67%<br />
innergex renewable energy inc utilities 22 743 284 0.46% 0.46%<br />
innvest real est<strong>at</strong>e investment trust Financials 14 344 499 0.63% 0.63%<br />
intact Financial Corp Financials 302 940 403 0.68% 0.68%<br />
ithaca energy inc oil & Gas 50 269 368 1.55% 1.55%<br />
ivanhoe mines ltd/Ca basic m<strong>at</strong>erials 207 600 735 0.26% 0.26%<br />
Jaguar mining inc basic m<strong>at</strong>erials 24 749 451 0.77% 0.77%<br />
Jean Coutu Group PJC inc/the Consumer services 54 333 829 0.06% 0.32%<br />
Just energy Group inc utilities 45 907 509 0.49% 0.47%<br />
K<strong>at</strong>anga mining ltd basic m<strong>at</strong>erials 16 818 033 0.13% 0.13%<br />
Keegan resources inc basic m<strong>at</strong>erials 9 903 990 0.58% 0.58%<br />
Keyera Corp oil & Gas 62 513 287 0.30% 0.30%<br />
Kinross Gold Corp basic m<strong>at</strong>erials 727 806 455 0.94% 0.94%<br />
Kirkland lake Gold inc basic m<strong>at</strong>erials 137 266 779 2.17% 2.17%<br />
Kulczyk oil ventures inc oil & Gas 32 174 723 3.79% 3.79%<br />
labrador iron mines <strong>Holding</strong>s ltd basic m<strong>at</strong>erials 25 164 854 1.59% 1.59%<br />
lake shore Gold Corp basic m<strong>at</strong>erials 18 696 222 0.62% 0.62%<br />
laurentian bank <strong>of</strong> Canada Financials 43 479 900 0.65% 0.65%<br />
legacy oil + Gas inc oil & Gas 60 099 843 0.68% 0.68%<br />
linamar Corp Consumer Goods 32 953 059 0.62% 0.62%<br />
loblaw Cos ltd Consumer services 173 334 387 0.27% 0.27%<br />
lundin mining Corp basic m<strong>at</strong>erials 65 602 956 0.50% 0.50%<br />
macDonald Dettwiler & associ<strong>at</strong>es ltd industrials 58 298 463 0.66% 0.66%<br />
magna intern<strong>at</strong>ional inc Consumer Goods <strong>31</strong>8 244 455 0.68% 0.68%<br />
major Drilling Group intern<strong>at</strong>ional oil & Gas 47 980 624 0.67% 0.67%<br />
manitoba telecom services inc telecommunic<strong>at</strong>ions 24 501 874 0.21% 0.21%<br />
manulife Financial Corp Financials <strong>31</strong>1 386 214 0.27% 0.27%<br />
maple leaf Foods inc Consumer Goods 42 821 985 0.48% 0.42%<br />
martinrea intern<strong>at</strong>ional inc Consumer Goods 24 240 702 0.67% 0.67%<br />
meG energy Corp oil & Gas 407 153 7<strong>31</strong> 0.87% 0.87%<br />
melcor Developments ltd Financials 3 341 829 0.14% 0.14%<br />
merc<strong>at</strong>or minerals ltd basic m<strong>at</strong>erials 14 639 129 0.67% 0.67%<br />
methanex Corp basic m<strong>at</strong>erials 85 719 384 0.67% 0.67%<br />
metro inc Consumer services 219 578 619 0.62% 0.68%<br />
voting<br />
ownership<br />
sector<br />
market value<br />
(noK)<br />
midas Gold Corp basic m<strong>at</strong>erials 32 834 456 1.35% 1.35%<br />
minefinders Corp basic m<strong>at</strong>erials 35 020 653 0.68% 0.68%<br />
molson Coors Canada inc Consumer Goods 7 <strong>31</strong>4 554 0.00% 0.12%<br />
morguard real est<strong>at</strong>e investment trust Financials 27 778 640 0.51% 0.51%<br />
mullen Group ltd industrials 64 153 748 0.69% 0.69%<br />
nal energy Corp oil & Gas 34 249 651 0.49% 0.49%<br />
n<strong>at</strong>ional bank <strong>of</strong> Canada Financials 462 976 589 0.68% 0.68%<br />
nautilus minerals inc basic m<strong>at</strong>erials 42 199 106 2.04% 2.04%<br />
neo m<strong>at</strong>erial technologies inc basic m<strong>at</strong>erials 27 632 752 0.55% 0.55%<br />
nevsun resources ltd basic m<strong>at</strong>erials 74 085 743 1.12% 1.12%<br />
new Gold inc basic m<strong>at</strong>erials 182 001 058 0.67% 0.67%<br />
nexen inc oil & Gas 339 232 463 0.68% 0.68%<br />
nGex resources inc basic m<strong>at</strong>erials 16 952 963 0.68% 0.68%<br />
niko resources ltd oil & Gas 97 484 005 0.67% 0.67%<br />
norbord inc industrials 5 232 346 0.25% 0.25%<br />
nordion inc Health Care 22 270 507 0.71% 0.71%<br />
north West Co inc/the Consumer services 22 143 896 0.39% 0.39%<br />
northern Dynasty minerals ltd basic m<strong>at</strong>erials 16 144 983 0.47% 0.47%<br />
northland Power inc utilities 23 898 053 0.29% 0.29%<br />
novagold resources inc basic m<strong>at</strong>erials 64 929 373 0.53% 0.53%<br />
nuvista energy ltd oil & Gas 20 256 001 0.66% 0.66%<br />
oceanaGold Corp basic m<strong>at</strong>erials 22 214 599 0.64% 0.64%<br />
onex Corp industrials 158 226 187 0.70% 0.70%<br />
open text Corp technology 115 635 645 0.65% 0.65%<br />
orezone Gold Corp basic m<strong>at</strong>erials 49 326 066 3.83% 3.83%<br />
osisko mining Corp basic m<strong>at</strong>erials 222 293 926 1.00% 1.00%<br />
Pacific rubiales energy Corp oil & Gas 245 085 329 0.82% 0.82%<br />
Paladin labs inc Health Care 8 593 385 0.17% 0.17%<br />
Pan american silver Corp basic m<strong>at</strong>erials 93 981 087 0.68% 0.68%<br />
Paramount resources ltd oil & Gas 70 573 727 0.33% 0.33%<br />
Pason systems inc oil & Gas 30 390 530 0.53% 0.53%<br />
Pembina Pipeline Corp utilities 195 998 642 0.67% 0.67%<br />
Pengrowth energy Corp oil & Gas 74 836 796 0.33% 0.33%<br />
Penn West Petroleum ltd oil & Gas 250 626 556 0.45% 0.45%<br />
Petrobakken energy ltd oil & Gas 36 937 706 0.26% 0.26%<br />
Petrobank energy & resources ltd oil & Gas 43 379 620 0.66% 0.66%<br />
Petrominerales ltd oil & Gas 163 134 411 1.66% 1.66%<br />
Peyto explor<strong>at</strong>ion & Development Corp oil & Gas 90 977 905 0.46% 0.46%<br />
Power Corp <strong>of</strong> Canada Financials 386 691 556 0.<strong>31</strong>% 0.60%<br />
Power Financial Corp Financials 288 590 337 0.27% 0.27%<br />
Precision Drilling Corp oil & Gas 117 655 205 0.69% 0.69%<br />
Pretium resources inc basic m<strong>at</strong>erials 201 354 645 3.16% 3.16%<br />
Primaris retail real est<strong>at</strong>e investment trust Financials 63 332 426 0.65% 0.65%<br />
Progress energy resources Corp oil & Gas 123 667 633 0.69% 0.69%<br />
Progressive Waste solutions ltd industrials 607 557 463 4.34% 4.34%<br />
Provident energy ltd oil & Gas 42 226 559 0.27% 0.27%<br />
Quadra FnX mining ltd basic m<strong>at</strong>erials 113 924 359 0.67% 0.67%<br />
Quebecor inc industrials 59 574 228 0.12% 0.46%<br />
reitmans Canada ltd Consumer services 34 636 920 0.00% 0.61%<br />
research in motion ltd technology 323 494 756 0.71% 0.71%<br />
rioCan real est<strong>at</strong>e investment trust Financials 281 902 843 0.67% 0.67%<br />
ritchie bros auctioneers inc industrials 111 773 835 0.80% 0.80%<br />
rogers Communic<strong>at</strong>ions inc telecommunic<strong>at</strong>ions 22 747 415 0.00% 0.02%<br />
romarco minerals inc basic m<strong>at</strong>erials 151 916 783 4.11% 4.11%<br />
rona inc Consumer services 51 751 953 0.69% 0.69%<br />
royal bank <strong>of</strong> Canada Financials 2 953 225 530 0.67% 0.67%<br />
rubicon minerals Corp basic m<strong>at</strong>erials 38 433 367 0.71% 0.71%<br />
russel metals inc basic m<strong>at</strong>erials 56 359 413 0.71% 0.71%<br />
saputo inc Consumer Goods 235 388 655 0.51% 0.51%<br />
savanna energy services Corp oil & Gas 25 337 158 0.68% 0.68%<br />
seabridge Gold inc basic m<strong>at</strong>erials 27 963 880 0.67% 0.67%<br />
semaFo inc basic m<strong>at</strong>erials 73 870 566 0.70% 0.70%<br />
shaw Communic<strong>at</strong>ions inc Consumer services 329 647 194 0.00% 0.63%<br />
shawCor ltd oil & Gas 66 370 618 0.21% 0.56%<br />
sherritt intern<strong>at</strong>ional Corp basic m<strong>at</strong>erials 62 879 383 0.66% 0.66%<br />
shoppers Drug mart Corp Consumer services 215 286 818 0.42% 0.42%<br />
sierra Wireless inc technology 7 923 849 0.60% 0.60%<br />
silver standard resources inc basic m<strong>at</strong>erials 43 853 120 0.66% 0.66%<br />
silver Whe<strong>at</strong>on Corp basic m<strong>at</strong>erials 413 658 476 0.68% 0.68%<br />
silvercorp metals inc basic m<strong>at</strong>erials 45 689 996 0.70% 0.70%<br />
sinopec Daylight energy ltd ltd oil & Gas 2 557 906 0.02% 0.02%<br />
smart technologies inc technology 5 377 708 0.03% 0.20%<br />
snC-lavalin Group inc industrials 304 573 744 0.67% 0.67%<br />
southGobi resources ltd basic m<strong>at</strong>erials 9 530 176 0.15% 0.15%<br />
sprott inc Financials 9 536 141 0.17% 0.17%<br />
stantec inc industrials 50 879 028 0.69% 0.69%<br />
sun life Financial inc Financials 260 499 509 0.40% 0.40%<br />
suncor energy inc oil & Gas 1 762 339 301 0.65% 0.65%<br />
superior Plus Corp Consumer services 26 606 919 0.72% 0.72%<br />
sXC Health solutions Corp technology 140 032 121 0.67% 0.67%<br />
tahoe resources inc basic m<strong>at</strong>erials 33 014 671 0.22% 0.22%<br />
talisman energy inc oil & Gas 1 041 562 463 1.33% 1.33%<br />
taseko mines ltd basic m<strong>at</strong>erials 20 548 2<strong>31</strong> 0.64% 0.64%<br />
teck resources ltd basic m<strong>at</strong>erials 928 154 014 0.29% 0.75%<br />
telus Corp telecommunic<strong>at</strong>ions 169 652 001 0.01% 0.16%<br />
thompson Creek metals Co inc basic m<strong>at</strong>erials 46 166 568 0.66% 0.66%<br />
thomson reuters Corp Consumer services <strong>31</strong>6 064 966 0.24% 0.24%<br />
tim Hortons inc Consumer services 309 034 289 0.68% 0.68%<br />
tmX Group inc Financials 170 496 051 0.94% 0.94%<br />
toromont industries ltd industrials 63 671 203 0.66% 0.66%<br />
toronto-Dominion bank/the Financials 2 710 822 186 0.67% 0.67%<br />
Country associ<strong>at</strong>ion according to Ftse (the benchmark provider for <strong>equities</strong>). if a company is not in the benchmark, the country <strong>of</strong> incorpor<strong>at</strong>ion is listed. sector classific<strong>at</strong>ion according to iCb (the industry Classific<strong>at</strong>ion<br />
benchmark company).<br />
voting<br />
ownership<br />
HOLdiNgs<br />
4<br />
<strong>Government</strong> <strong>Pension</strong> FunD <strong>Global</strong> ANNUAL REPORT 2011
<strong>Government</strong> <strong>Pension</strong> <strong>Fund</strong> <strong>Global</strong> <strong>Holding</strong> <strong>of</strong> <strong>equities</strong> <strong>at</strong> <strong>31</strong> December 2011<br />
sector<br />
market value<br />
(noK)<br />
torstar Corp Consumer services 23 987 822 0.00% 0.62%<br />
tourmaline oil Corp oil & Gas 84 <strong>31</strong>6 814 0.34% 0.34%<br />
transalta Corp utilities 185 514 055 0.67% 0.67%<br />
trans<strong>at</strong> <strong>at</strong> inc Consumer services 9 721 121 0.64% 0.62%<br />
transCanada Corp oil & Gas 1 653 437 369 0.90% 0.90%<br />
transcontinental inc industrials 34 517 325 0.13% 0.58%<br />
transForce inc industrials 46 701 895 0.64% 0.64%<br />
trican Well service ltd oil & Gas 104 168 911 0.69% 0.69%<br />
trilogy energy Corp oil & Gas 93 834 649 0.50% 0.37%<br />
trinidad Drilling ltd oil & Gas 38 258 408 0.70% 0.70%<br />
uranium one inc basic m<strong>at</strong>erials 42 <strong>31</strong>4 445 0.35% 0.35%<br />
valeant Pharmaceuticals intern<strong>at</strong>ional inc Health Care 598 908 027 0.72% 0.72%<br />
veresen inc oil & Gas 49 088 939 0.29% 0.29%<br />
vermilion energy inc oil & Gas 173 495 455 0.68% 0.68%<br />
viterra inc Consumer Goods 161 048 452 0.69% 0.69%<br />
West Fraser timber Co ltd basic m<strong>at</strong>erials 48 799 036 0.47% 0.47%<br />
Western Wind energy Corp utilities 17 891 173 2.89% 2.89%<br />
Westport innov<strong>at</strong>ions inc industrials 108 716 535 1.13% 1.13%<br />
Wi-lan inc technology 27 571 257 0.65% 0.65%<br />
Yamana Gold inc basic m<strong>at</strong>erials 443 134 461 0.68% 0.68%<br />
Yellowhead mining inc basic m<strong>at</strong>erials 8 138 713 3.27% 4.90%<br />
CAymAN isLANds<br />
endeavour mining Corp basic m<strong>at</strong>erials 10 476 181 0.29% 0.29%<br />
CHiLE<br />
administradora de Fondos de <strong>Pension</strong>es<br />
Provida sa Financials 6 162 181 0.07% 0.07%<br />
aes Gener sa utilities 77 860 327 0.<strong>31</strong>% 0.<strong>31</strong>%<br />
banco de Chile Financials 141 679 975 0.20% 0.20%<br />
banco de Credito e inversiones Financials 79 724 735 0.23% 0.23%<br />
banco santander Chile Financials 105 818 412 0.13% 0.13%<br />
besalco sa industrials 5 611 708 0.12% 0.12%<br />
CaP sa basic m<strong>at</strong>erials 241 981 870 0.74% 0.74%<br />
Cencosud sa Consumer services 245 742 723 0.32% 0.32%<br />
CFr Pharmaceuticals sa Health Care 99 742 450 0.00% 0.84%<br />
Cia Cervecerias unidas sa Consumer Goods 86 677 483 0.35% 0.35%<br />
Cia sud americana de vapores sa industrials 19 585 764 0.19% 0.19%<br />
Colbun sa utilities 67 101 911 0.25% 0.25%<br />
Corpbanca Financials 92 206 051 0.48% 0.48%<br />
e.Cl sa utilities 70 979 463 0.42% 0.42%<br />
embotelladora andina sa Consumer Goods 27 545 911 0.04% 0.14%<br />
empresa nacional de electricidad sa/Chile utilities 291 757 874 0.30% 0.40%<br />
empresas CmPC sa basic m<strong>at</strong>erials 109 901 804 0.23% 0.23%<br />
empresas CoPeC sa oil & Gas 235 097 324 0.23% 0.23%<br />
empresas Hites sa Consumer services 5 912 529 0.42% 0.42%<br />
empresas la Polar sa Consumer services 21 594 247 2.61% 2.61%<br />
enaex sa basic m<strong>at</strong>erials 13 <strong>31</strong>8 721 0.17% 0.17%<br />
enersis sa utilities 228 361 419 0.24% 0.33%<br />
entel Chile sa telecommunic<strong>at</strong>ions 96 546 966 0.37% 0.37%<br />
inversiones aguas metropolitanas sa utilities 25 577 321 0.28% 0.28%<br />
lan airlines sa Consumer services 153 335 908 0.32% 0.32%<br />
madeco sa technology 5 346 730 0.27% 0.27%<br />
masisa sa industrials 8 535 063 0.23% 0.23%<br />
norte Grande sa Financials 3 581 216 0.07% 0.07%<br />
Parque arauco sa Financials 5 141 427 0.08% 0.08%<br />
Quinenco sa industrials 9 302 870 0.05% 0.05%<br />
saCi Falabella Consumer services 346 476 429 0.<strong>31</strong>% 0.<strong>31</strong>%<br />
sociedad Quimica y minera de Chile sa basic m<strong>at</strong>erials 199 705 141 0.24% 0.24%<br />
vina Concha y toro sa Consumer Goods 12 621 005 0.15% 0.15%<br />
CHiNA<br />
21vianet Group inc technology 54 606 743 2.02% 1.76%<br />
acheng relay Co ltd industrials 702 614 0.04% 0.04%<br />
advanced technology & m<strong>at</strong>erials Co ltd basic m<strong>at</strong>erials 4 691 202 0.03% 0.03%<br />
aeolus tyre Co ltd Consumer Goods 483 457 0.02% 0.02%<br />
aerospace Communic<strong>at</strong>ions <strong>Holding</strong> Co ltd Consumer Goods 481 692 0.02% 0.02%<br />
aerospace Hi-tech <strong>Holding</strong>s Grp ltd Consumer Goods 780 445 0.03% 0.03%<br />
aier eye Hospital Group Co ltd Health Care 37 852 0.00% 0.00%<br />
air China ltd Consumer services 4 293 996 0.01% 0.01%<br />
aisino Co ltd industrials 22 237 767 0.13% 0.13%<br />
aluminum Corp <strong>of</strong> China ltd basic m<strong>at</strong>erials 9 297 479 0.01% 0.01%<br />
an Hui Wenergy Co ltd utilities 390 733 0.01% 0.01%<br />
andon Health Co ltd Health Care 8 714 0.00% 0.00%<br />
angang steel Co ltd basic m<strong>at</strong>erials 192 544 835 0.62% 0.62%<br />
angel Yeast Co ltd Consumer Goods 1 285 566 0.01% 0.01%<br />
anhui Conch Cement Co ltd industrials <strong>31</strong>4 411 092 0.34% 0.34%<br />
anhui expressway Co industrials 530 785 0.01% 0.01%<br />
anhui Golden seed Winery Co ltd Consumer Goods 2 485 138 0.03% 0.03%<br />
anhui Gu<strong>of</strong>eng Plastic industry Co ltd basic m<strong>at</strong>erials 640 621 0.04% 0.04%<br />
anhui Heli Co ltd-a industrials 9 172 597 0.22% 0.22%<br />
anhui Hengyuan Coal-electricity Group Co ltd basic m<strong>at</strong>erials 2 394 659 0.02% 0.02%<br />
anhui Huamao textile Co Consumer Goods 721 665 0.01% 0.01%<br />
anhui Huaxing Chemical industry Co ltd basic m<strong>at</strong>erials 276 494 0.02% 0.02%<br />
anhui Jianghuai automobile Co ltd Consumer Goods 1 741 151 0.02% 0.02%<br />
anhui shanying Paper industry Co ltd basic m<strong>at</strong>erials 506 018 0.02% 0.02%<br />
anhui ustC iFlytek Co ltd technology 5 595 840 0.07% 0.07%<br />
anhui Wanwei upd<strong>at</strong>ed High-tech m<strong>at</strong>erial<br />
industry Co ltd basic m<strong>at</strong>erials 583 801 0.02% 0.02%<br />
anhui Xinke new m<strong>at</strong>erials Co ltd basic m<strong>at</strong>erials 1 514 283 0.06% 0.06%<br />
anhui Zhongding sealing Parts Co ltd industrials 1 122 210 0.02% 0.02%<br />
anXin trust & investment Co ltd Financials 1 474 403 0.03% 0.03%<br />
anyang iron & steel Co ltd basic m<strong>at</strong>erials 1 297 489 0.02% 0.02%<br />
asia Cement China <strong>Holding</strong>s Corp industrials 14 183 690 0.33% 0.33%<br />
voting<br />
ownership<br />
sector<br />
market value<br />
(noK)<br />
aviC aero-engine Controls Co ltd industrials 877 965 0.01% 0.01%<br />
avic Heavy machinery Co ltd industrials 922 892 0.01% 0.01%<br />
baidu inc/China technology 1 079 024 772 0.15% 0.45%<br />
bank <strong>of</strong> China ltd Financials 380 340 997 0.06% 0.06%<br />
baoding swan Co ltd basic m<strong>at</strong>erials 641 847 0.02% 0.02%<br />
baoding tianwei baobian electric Co ltd industrials 3 471 245 0.02% 0.02%<br />
baoji titanium industry Co ltd basic m<strong>at</strong>erials 1 135 043 0.02% 0.02%<br />
baoshan iron & steel Co ltd basic m<strong>at</strong>erials 42 729 093 0.05% 0.05%<br />
baosheng science and technology<br />
innov<strong>at</strong>ion Co ltd industrials 437 423 0.02% 0.02%<br />
baotou Huazi industry Co ltd Consumer Goods 596 491 0.02% 0.02%<br />
baotou tomorrow technology <strong>Holding</strong> Co ltd basic m<strong>at</strong>erials 538 898 0.05% 0.05%<br />
baoxin auto Group ltd Consumer services 76 466 939 0.52% 0.52%<br />
baoye Group Co ltd industrials 74 857 362 4.09% 4.09%<br />
bbmG Corp industrials 17 676 000 0.10% 0.10%<br />
beihai Yinhe Hi-tech industrial Co ltd industrials 506 100 0.03% 0.03%<br />
beijing aerospace Changfeng Co ltd industrials 835 968 0.04% 0.04%<br />
beijing bashi media Co ltd Consumer services 403 666 0.01% 0.01%<br />
beijing Capital Co ltd utilities 1 619 907 0.01% 0.01%<br />
beijing Capital intern<strong>at</strong>ional airport Co ltd industrials 168 093 929 1.30% 1.30%<br />
beijing Capital retailing Group Co ltd Consumer services 913 409 0.01% 0.01%<br />
beijing Dabeinong technology Group Co ltd Consumer Goods 1 766 396 0.01% 0.01%<br />
beijing Dinghan technology Co ltd technology 17 001 0.00% 0.00%<br />
beijing Double Crane Pharmaceutical Co ltd Health Care 2 327 057 0.03% 0.03%<br />
beijing enterprises <strong>Holding</strong>s ltd industrials 528 114 397 1.30% 1.30%<br />
beijing enterprises W<strong>at</strong>er Group ltd utilities 32 580 676 0.29% 0.29%<br />
beijing Gehua C<strong>at</strong>v network Co ltd Consumer services 2 247 069 0.03% 0.03%<br />
beijing Haohua energy resource Co ltd basic m<strong>at</strong>erials 2 100 480 0.01% 0.01%<br />
beijing Hualian Hypermarket Consumer services 875 148 0.02% 0.02%<br />
beijing Jingkelong Co ltd Consumer services 37 245 245 1.78% 1.78%<br />
beijing new building m<strong>at</strong>erial PlC industrials 866 656 0.01% 0.01%<br />
beijing orient landscape Co ltd industrials 1 974 146 0.02% 0.02%<br />
beijing sanyuan Foods Co ltd Consumer Goods 441 182 0.01% 0.01%<br />
beijing shiji inform<strong>at</strong>ion technology Co ltd technology 694 851 0.01% 0.01%<br />
beijing shougang Co ltd basic m<strong>at</strong>erials 914 <strong>31</strong>2 0.01% 0.01%<br />
beijing shunxin agriculture Co Consumer Goods 709 559 0.01% 0.01%<br />
beijing sJ environmental Protection and<br />
new m<strong>at</strong>erial Co ltd basic m<strong>at</strong>erials 14 593 0.00% 0.00%<br />
beijing sl Pharmaceutical Co ltd Health Care 1 855 066 0.02% 0.02%<br />
beijing teamsun technology Co ltd technology 698 028 0.01% 0.01%<br />
beijing tiantan biological Products Co Health Care 1 157 248 0.01% 0.01%<br />
beijing tongrentang Co ltd Health Care 2 805 272 0.02% 0.02%<br />
beijing Wangfujing Department store<br />
Group Co ltd Consumer services 12 274 058 0.09% 0.09%<br />
beijing Yanjing brewery-a Consumer Goods 2 373 402 0.02% 0.02%<br />
beijing Zhongke sanhuan High-tech Co ltd industrials 23 878 060 0.25% 0.25%<br />
beiqi Foton motor Co ltd Consumer Goods 3 548 670 0.03% 0.03%<br />
better life Commercial Chain share Co ltd Consumer services 513 915 0.01% 0.01%<br />
blue star new Chemical m<strong>at</strong>erial Co ltd basic m<strong>at</strong>erials 772 545 0.02% 0.02%<br />
boe technology Group Co ltd industrials 2 725 538 0.01% 0.01%<br />
boer Power <strong>Holding</strong>s ltd industrials 26 187 487 2.06% 2.06%<br />
bohai leasing Co ltd industrials 1 786 335 0.02% 0.02%<br />
bright Dairy & Food Co ltd Consumer Goods 848 636 0.01% 0.01%<br />
bright oceans inter-telecom Corp technology 1 869 601 0.05% 0.05%<br />
brilliance China automotive <strong>Holding</strong>s ltd Consumer Goods 497 615 764 1.54% 1.54%<br />
byd Co ltd industrials 88 991 297 0.29% 0.29%<br />
Canal scientific & technological Co ltd Consumer Goods 583 605 0.03% 0.03%<br />
Celestial nutrifoods ltd Consumer Goods 1 327 0.45% 0.45%<br />
Centre testing intern<strong>at</strong>ional shenzhen Co ltd industrials 13 844 247 0.45% 0.45%<br />
Chang Jiang runfa machinery Co ltd industrials 4 760 0.00% 0.00%<br />
Chang Jiang shipping Group Phoenix Co ltd industrials 746 <strong>31</strong>2 0.04% 0.04%<br />
Changchai Co ltd industrials 469 263 0.02% 0.02%<br />
Changchun eurasia Group Co ltd Consumer services <strong>31</strong> 253 044 0.78% 0.78%<br />
Changchun Faway automobile<br />
Components Co ltd Consumer Goods 1 297 133 0.03% 0.03%<br />
Changchun Gas Co ltd basic m<strong>at</strong>erials 1 333 392 0.04% 0.04%<br />
Changchun High & new technology<br />
industries inc Health Care 1 712 145 0.04% 0.04%<br />
Changchunjingkai Group Co ltd utilities 671 341 0.04% 0.04%<br />
Changfeng axle China Co industrials 6 108 662 1.08% 1.08%<br />
Changjiang & Jingong steel building<br />
Group Co ltd industrials 964 344 0.02% 0.02%<br />
Changlin Co ltd industrials 814 973 0.03% 0.03%<br />
Changsha tongcheng <strong>Holding</strong>s Co ltd Consumer services 658 495 0.03% 0.03%<br />
Changyuan Group ltd industrials 1 485 636 0.03% 0.03%<br />
Chengdu b-ray media Co ltd Consumer services 1 710 348 0.02% 0.02%<br />
Chengdu Dr Peng telecom & media<br />
Group Co ltd technology 930 143 0.01% 0.01%<br />
Chengdu Xingrong investment Co ltd basic m<strong>at</strong>erials 3 302 876 0.04% 0.04%<br />
Chengshang Group Co ltd Consumer services 1 257 393 0.04% 0.04%<br />
Chengzhi Co ltd Health Care 698 571 0.03% 0.03%<br />
Chenzhou mining Group Co ltd basic m<strong>at</strong>erials 28 <strong>31</strong>4 928 0.27% 0.27%<br />
China aerospace times electronics Co ltd industrials 1 926 712 0.03% 0.03%<br />
China agri-industries <strong>Holding</strong>s ltd Consumer Goods 233 977 681 1.28% 1.28%<br />
China animal Husbandry industry Co Health Care 1 100 774 0.02% 0.02%<br />
China avi<strong>at</strong>ion optical-electrical<br />
technology Co ltd industrials 1 755 114 0.03% 0.03%<br />
China CamC engineering Co ltd industrials 2 379 178 0.02% 0.02%<br />
China CiFCo investment Co ltd Consumer services 1 032 086 0.04% 0.04%<br />
China Cnr Corp ltd industrials 5 229 849 0.02% 0.02%<br />
China Coal energy Co ltd basic m<strong>at</strong>erials 351 148 122 0.40% 0.40%<br />
Country associ<strong>at</strong>ion according to Ftse (the benchmark provider for <strong>equities</strong>). if a company is not in the benchmark, the country <strong>of</strong> incorpor<strong>at</strong>ion is listed. sector classific<strong>at</strong>ion according to iCb (the industry Classific<strong>at</strong>ion<br />
benchmark company).<br />
voting<br />
ownership<br />
HOLdiNgs<br />
5<br />
<strong>Government</strong> <strong>Pension</strong> FunD <strong>Global</strong> ANNUAL REPORT 2011
<strong>Government</strong> <strong>Pension</strong> <strong>Fund</strong> <strong>Global</strong> <strong>Holding</strong> <strong>of</strong> <strong>equities</strong> <strong>at</strong> <strong>31</strong> December 2011<br />
sector<br />
market value<br />
(noK)<br />
China Communic<strong>at</strong>ions Construction Co ltd industrials 154 988 759 0.22% 0.22%<br />
China Construction bank Corp Financials 718 835 972 0.07% 0.07%<br />
China CosCo <strong>Holding</strong>s Co ltd industrials 1 812 748 0.00% 0.00%<br />
China CssC <strong>Holding</strong>s ltd industrials 2 586 676 0.01% 0.01%<br />
China CYts tours <strong>Holding</strong> Co ltd Consumer services 1 815 339 0.03% 0.03%<br />
China Dalian intern<strong>at</strong>ional Cooper<strong>at</strong>ion<br />
Group Co industrials 645 006 0.03% 0.03%<br />
China D<strong>at</strong>ang Corp renewable Power Co ltd utilities 84 255 848 1.07% 1.07%<br />
China Dongfanghong spaces<strong>at</strong> Co ltd technology 2 738 380 0.02% 0.02%<br />
China eastern airlines Corp ltd Consumer services 4 586 915 0.01% 0.01%<br />
China enterprise Co ltd Financials 1 220 038 0.02% 0.02%<br />
China erzhong Group Deyang Heavy<br />
equipment Co ltd industrials 1 286 987 0.01% 0.01%<br />
China everbright intern<strong>at</strong>ional ltd industrials 10 302 626 0.13% 0.13%<br />
China Fangda Group Co ltd industrials 482 640 0.02% 0.02%<br />
China Fiberglass Co ltd basic m<strong>at</strong>erials 1 044 078 0.01% 0.01%<br />
China First Heavy industries Co ltd industrials 3 082 506 0.02% 0.02%<br />
China Foods ltd Consumer Goods 78 123 092 0.60% 0.60%<br />
China Forestry <strong>Holding</strong>s Co ltd basic m<strong>at</strong>erials 5 169 247 0.75% 0.75%<br />
China Gezhouba Group Co ltd industrials 7 683 226 0.03% 0.03%<br />
China Gre<strong>at</strong>wall Computer shenzhen Co ltd technology 1 370 217 0.02% 0.02%<br />
China Hongqiao Group ltd basic m<strong>at</strong>erials 373 298 477 1.98% 1.98%<br />
China Hongxing sports ltd Consumer Goods 9 518 366 0.64% 0.64%<br />
China Hydroelectric Corp utilities 603 358 0.06% 0.17%<br />
China intern<strong>at</strong>ional marine Containers<br />
Group Co ltd industrials 60 330 951 0.20% 0.20%<br />
China intern<strong>at</strong>ional travel service Corp ltd Consumer services 2 803 084 0.01% 0.01%<br />
China Jialing industrial Co ltd Consumer Goods 630 816 0.02% 0.02%<br />
China life insurance Co ltd Financials 412 932 165 0.10% 0.10%<br />
China lodging Group ltd Consumer services 12 042 249 0.24% 0.24%<br />
China longyuan Power Group Corp oil & Gas 260 898 806 0.75% 0.75%<br />
China medical technologies inc Health Care 13 557 860 2.47% 2.47%<br />
China merchants bank Co ltd Financials 248 136 987 0.10% 0.10%<br />
China merchants energy shipping Co ltd industrials 1 723 759 0.02% 0.02%<br />
China milk Products Group ltd Consumer Goods 1 713 0.50% 0.50%<br />
China ming Yang Wind Power Group ltd oil & Gas 3 115 745 0.18% 0.18%<br />
China minsheng banking Corp ltd Financials 78 867 623 0.06% 0.06%<br />
China minzhong Food Corp ltd Consumer Goods 17 791 524 0.85% 0.85%<br />
China mobile ltd telecommunic<strong>at</strong>ions 41 992 189 0.00% 0.00%<br />
China modern Dairy <strong>Holding</strong>s ltd Consumer Goods 24 359 588 0.40% 0.40%<br />
China molybdenum Co ltd basic m<strong>at</strong>erials 153 751 408 1.24% 1.24%<br />
China n<strong>at</strong>ional accord medicines Corp ltd Health Care 749 028 0.01% 0.01%<br />
China n<strong>at</strong>ional building m<strong>at</strong>erial Co ltd industrials 937 273 117 2.56% 2.56%<br />
China n<strong>at</strong>ional Complete Plant import &<br />
export Co ltd industrials 1 291 671 0.05% 0.05%<br />
China n<strong>at</strong>ional medicines Corp ltd Health Care 1 232 386 0.02% 0.02%<br />
China n<strong>at</strong>ional s<strong>of</strong>tware & service Co ltd technology 345 902 0.01% 0.01%<br />
China nonferrous metal industry’s Foreign<br />
engineering and Construction Co ltd basic m<strong>at</strong>erials 4 305 435 0.03% 0.03%<br />
China north optical-electrical<br />
technology Co ltd industrials 810 708 0.02% 0.02%<br />
China oilfield services ltd oil & Gas 3 024 035 0.00% 0.00%<br />
China overseas land & investment ltd Financials 37 821 370 0.05% 0.05%<br />
China Pacific insurance Group Co ltd Financials 865 660 492 0.59% 0.59%<br />
China Petroleum & Chemical Corp oil & Gas 586 749 571 0.11% 0.11%<br />
China Quanjude Group Co ltd Consumer services 607 957 0.02% 0.02%<br />
China railway Construction Corp ltd industrials 4 726 892 0.01% 0.01%<br />
China railway erju Co ltd industrials 1 308 423 0.02% 0.02%<br />
China railway Group ltd industrials 5 436 117 0.01% 0.01%<br />
China railway tielong Container<br />
logistics Co ltd industrials 45 943 164 0.40% 0.40%<br />
China resources Cement <strong>Holding</strong>s ltd industrials 175 517 251 0.61% 0.61%<br />
China resources Power <strong>Holding</strong>s Co ltd utilities 276 696 956 0.51% 0.51%<br />
China resources sanjiu medical &<br />
Pharmaceutical Co ltd Health Care 2 148 898 0.01% 0.01%<br />
China s<strong>at</strong>com Guomai Communic<strong>at</strong>ions<br />
Co ltd telecommunic<strong>at</strong>ions 385 044 0.01% 0.01%<br />
China shenhua energy Co ltd basic m<strong>at</strong>erials 402 889 977 0.08% 0.08%<br />
China shipbuilding industry Co ltd industrials 6 046 141 0.01% 0.01%<br />
China shipping Development Co ltd industrials 26 701 913 0.21% 0.21%<br />
China shipping Haisheng Co ltd industrials 737 405 0.03% 0.03%<br />
China sky Chemical Fibre Co ltd Consumer Goods 571 808 0.15% 0.15%<br />
China st<strong>at</strong>e Construction engineering<br />
Corp ltd industrials 12 943 377 0.02% 0.02%<br />
China st<strong>at</strong>e Construction intern<strong>at</strong>ional<br />
<strong>Holding</strong>s ltd industrials 3 812 736 0.03% 0.03%<br />
China sun bio-chem technology<br />
Group Co ltd basic m<strong>at</strong>erials 127 0.03% 0.03%<br />
China suntien Green energy Corp ltd utilities 59 666 244 1.76% 1.76%<br />
China taiping insurance <strong>Holding</strong>s Co ltd Financials 40 190 785 0.21% 0.21%<br />
China telecom Corp ltd telecommunic<strong>at</strong>ions 1 282 667 367 0.47% 0.47%<br />
China unicom Hong Kong ltd telecommunic<strong>at</strong>ions 2 128 436 550 0.72% 0.72%<br />
China united network Communic<strong>at</strong>ions ltd telecommunic<strong>at</strong>ions 34 725 201 0.03% 0.03%<br />
China vanke Co ltd Financials 108 640 648 0.15% 0.15%<br />
China XD electric Co ltd industrials 12 745 509 0.08% 0.08%<br />
China Yangtze Power Co ltd utilities 10 930 940 0.01% 0.01%<br />
China Zhengtong auto services <strong>Holding</strong>s ltd Consumer services 38 735 742 0.30% 0.30%<br />
China Zhenhua Group science &<br />
technology Co ltd industrials 593 681 0.03% 0.03%<br />
China-Kinwa High technology Co ltd industrials 916 523 0.02% 0.02%<br />
Chongqing brewery Co Consumer Goods 2 781 246 0.02% 0.02%<br />
voting<br />
ownership<br />
sector<br />
market value<br />
(noK)<br />
Chongqing Changan automobile Co ltd Consumer Goods 1 817 396 0.01% 0.01%<br />
Chongqing Department store Consumer services 1 653 583 0.01% 0.01%<br />
Chongqing Dima industry Co ltd industrials 8<strong>31</strong> 382 0.04% 0.04%<br />
Chongqing Huapont Pharm Co ltd Health Care 1 470 116 0.03% 0.03%<br />
Chongqing iron & steel Co ltd basic m<strong>at</strong>erials 378 982 0.01% 0.01%<br />
Chongqing Jianfeng Chemical Co ltd basic m<strong>at</strong>erials 297 378 0.01% 0.01%<br />
Chongqing Jiulong electric Power Co ltd utilities 1 144 564 0.02% 0.02%<br />
Chongqing road & bridge Co industrials 1 663 061 0.06% 0.06%<br />
Chongqing shanxian Paints Co industrials 281 403 0.03% 0.03%<br />
Chongqing taiji industry Group Co ltd Health Care 586 724 0.02% 0.02%<br />
Chongqing W<strong>at</strong>er Group Co ltd utilities 1 894 623 0.01% 0.01%<br />
Chongqing Zongshen Power<br />
machinery Co ltd Consumer Goods 893 223 0.02% 0.02%<br />
CitiC Guoan inform<strong>at</strong>ion industry Co ltd technology 3 440 870 0.03% 0.03%<br />
CitiC Guoan vine Co ltd Consumer Goods 630 725 0.02% 0.02%<br />
Citic <strong>of</strong>fshore Helicopter Co ltd industrials 851 741 0.02% 0.02%<br />
Citic Pacific ltd industrials 24 850 450 0.06% 0.06%<br />
CitiC securities Co ltd Financials 224 914 505 0.21% 0.21%<br />
Citichamp Dartong Co ltd industrials 1 187 010 0.03% 0.03%<br />
CnHtC Jinan truck Co ltd industrials 698 004 0.01% 0.01%<br />
Cninsure inc Financials 161 682 508 0.39% 7.80%<br />
CnooC ltd oil & Gas 69 8<strong>31</strong> 270 0.01% 0.01%<br />
C<strong>of</strong>co biochemical Co ltd Consumer Goods 1 578 276 0.03% 0.03%<br />
CoFCo tunhe Co ltd Consumer Goods 925 970 0.02% 0.02%<br />
Concord medical services <strong>Holding</strong>s ltd Health Care 29 971 045 1.09% 3.27%<br />
CosCo Pacific ltd industrials 536 762 891 2.84% 2.84%<br />
CosCo shipping Co ltd industrials 988 429 0.01% 0.01%<br />
CrbC intern<strong>at</strong>ional Co ltd industrials 1 107 911 0.02% 0.02%<br />
CsC nanjing tanker Corp industrials 762 151 0.01% 0.01%<br />
CsG <strong>Holding</strong> Co ltd industrials 4 555 027 0.03% 0.03%<br />
Csr Corp ltd industrials 14 375 304 0.03% 0.03%<br />
Ctrip.com intern<strong>at</strong>ional ltd Consumer services 106 236 247 0.00% 0.53%<br />
Da an Gene Co ltd sun Y<strong>at</strong>-sen university Health Care 1 660 262 0.06% 0.06%<br />
Daheng new epoch technology inc technology 1 603 472 0.07% 0.07%<br />
Dalian Daxian enterprises <strong>Holding</strong>s Co ltd Consumer Goods 1 373 <strong>31</strong>1 0.03% 0.03%<br />
Dalian Huarui Heavy industry Group Co ltd industrials 690 998 0.01% 0.01%<br />
Dalian Port PDa Co ltd industrials 10 119 620 0.16% 0.16%<br />
Dalian refriger<strong>at</strong>ion Co ltd industrials 611 141 0.02% 0.02%<br />
Dalian Zhangzidao Fishery Group Co ltd Consumer Goods 4 222 761 0.03% 0.03%<br />
Danhua Chemical technology Co ltd basic m<strong>at</strong>erials 1 598 150 0.02% 0.02%<br />
Daqin railway Co ltd industrials 54 543 876 0.05% 0.05%<br />
Dare technology Co ltd industrials 423 442 0.02% 0.02%<br />
Dashang Group Co ltd Consumer services 44 246 036 0.48% 0.48%<br />
D<strong>at</strong>ang Huayin electric Power Co ltd utilities 473 840 0.02% 0.02%<br />
D<strong>at</strong>ang intern<strong>at</strong>ional Power Gener<strong>at</strong>ion<br />
Co ltd utilities 3 287 695 0.01% 0.01%<br />
D<strong>at</strong>ang telecom technology Co ltd technology 1 189 152 0.03% 0.03%<br />
D<strong>at</strong>ong Coal industry Co ltd basic m<strong>at</strong>erials 3 640 032 0.02% 0.02%<br />
Daye special steel Co ltd basic m<strong>at</strong>erials 1 496 755 0.04% 0.04%<br />
Dazhong transport<strong>at</strong>ion Group Co ltd Consumer services 1 260 4<strong>31</strong> 0.02% 0.02%<br />
DHC s<strong>of</strong>tware Co ltd technology 1 148 523 0.01% 0.01%<br />
Do-Fluoride Chemicals Co ltd basic m<strong>at</strong>erials 17 484 0.00% 0.00%<br />
Dongfang electric Corp ltd industrials 119 172 882 0.33% 0.33%<br />
Dongfang electronics Co ltd industrials 1 073 919 0.04% 0.04%<br />
DongFeng automobile Co ltd Consumer Goods 939 350 0.02% 0.02%<br />
Dongguan Development <strong>Holding</strong>s Co ltd industrials 513 275 0.01% 0.01%<br />
Dongling Grain & oil Co ltd Consumer Goods 512 476 0.02% 0.02%<br />
Double Coin <strong>Holding</strong>s ltd Consumer Goods 1 217 803 0.01% 0.01%<br />
east China engineering science and<br />
technology Co ltd industrials 5 077 497 0.03% 0.03%<br />
edifier technology Co ltd Consumer Goods 8 960 0.00% 0.00%<br />
eGing Photovoltaic technology Co ltd Consumer Goods 1 389 049 0.01% 0.01%<br />
elec-tech intern<strong>at</strong>ional Co ltd Consumer Goods 2 105 257 0.03% 0.03%<br />
emei shan tourism Co Consumer services 21 496 552 0.53% 0.53%<br />
eternal asia supply Chain management ltd industrials 366 097 0.01% 0.01%<br />
Fangda Carbon new m<strong>at</strong>erial Co ltd basic m<strong>at</strong>erials 1 691 641 0.02% 0.02%<br />
Fangda special steel technology Co ltd Consumer Goods 970 515 0.02% 0.02%<br />
Far east Horizon ltd Financials 83 188 656 0.55% 0.55%<br />
FaW Car Co ltd Consumer Goods 2 796 901 0.02% 0.02%<br />
Feilo acoustics Co ltd industrials 1 556 397 0.04% 0.04%<br />
Fengfan Co ltd Consumer Goods 1 126 376 0.03% 0.03%<br />
Fenghua advanced technology <strong>Holding</strong><br />
Co ltd industrials 1 416 589 0.03% 0.03%<br />
FerroChina ltd basic m<strong>at</strong>erials 1 755 0.48% 0.48%<br />
Fiberhome telecommunic<strong>at</strong>ion<br />
technologies Co ltd technology 20 771 955 0.18% 0.18%<br />
FibreChem technologies ltd basic m<strong>at</strong>erials 1 961 0.47% 0.47%<br />
First tractor Co ltd industrials <strong>31</strong> 797 541 0.67% 0.67%<br />
Focus media <strong>Holding</strong> ltd Consumer services 109 056 686 0.67% 0.67%<br />
Focus technology Co ltd technology 20 102 0.00% 0.00%<br />
Foshan electrical and lighting Co ltd Consumer Goods 1 791 295 0.02% 0.02%<br />
Founder technology Group Corp technology 1 806 803 0.03% 0.03%<br />
Franshion Properties China ltd Financials 28 474 282 0.27% 0.27%<br />
FsPG Hi-tech Co ltd basic m<strong>at</strong>erials 1 358 235 0.03% 0.03%<br />
Fujian Cement inc industrials 768 847 0.03% 0.03%<br />
Fujian Dongbai Group Co ltd Consumer services 1 006 285 0.04% 0.04%<br />
Fujian expressway Development Co ltd industrials 956 097 0.02% 0.02%<br />
Fujian longking Co ltd industrials 2 541 823 0.05% 0.05%<br />
Fujian longxi bearing Group Co ltd industrials 305 560 0.01% 0.01%<br />
Fujian newland Computer Co ltd technology 1 117 258 0.02% 0.02%<br />
Fujian Qingshan Paper indus basic m<strong>at</strong>erials 1 132 281 0.04% 0.04%<br />
Country associ<strong>at</strong>ion according to Ftse (the benchmark provider for <strong>equities</strong>). if a company is not in the benchmark, the country <strong>of</strong> incorpor<strong>at</strong>ion is listed. sector classific<strong>at</strong>ion according to iCb (the industry Classific<strong>at</strong>ion<br />
benchmark company).<br />
voting<br />
ownership<br />
HOLdiNgs<br />
6<br />
<strong>Government</strong> <strong>Pension</strong> FunD <strong>Global</strong> ANNUAL REPORT 2011
<strong>Government</strong> <strong>Pension</strong> <strong>Fund</strong> <strong>Global</strong> <strong>Holding</strong> <strong>of</strong> <strong>equities</strong> <strong>at</strong> <strong>31</strong> December 2011<br />
sector<br />
market value<br />
(noK)<br />
Fujian sanmu Group Co industrials 382 557 0.03% 0.03%<br />
Fujian septwolves industry Co ltd Consumer Goods 20 685 290 0.22% 0.22%<br />
Fujian sunnada Communic<strong>at</strong>ion Co ltd technology 10 084 0.00% 0.00%<br />
Fuyao Glass industry Group Co ltd Consumer Goods 89 132 525 0.59% 0.59%<br />
Gansu Dunhuang seed Co ltd Consumer Goods 1 603 458 0.04% 0.04%<br />
Gansu Jiu steel Group Hongxing iron &<br />
steel Co ltd basic m<strong>at</strong>erials 26 <strong>31</strong>9 734 0.18% 0.18%<br />
Gansu mogao industrial Development Co ltd Consumer Goods 1 663 371 0.06% 0.06%<br />
Gansu Qilianshan Cement Group Co ltd industrials 1 008 436 0.02% 0.02%<br />
Gansu ronghua industry Group Co ltd Consumer Goods 1 508 351 0.03% 0.03%<br />
Gansu Yasheng industrial Group Co-a Consumer Goods 1 459 360 0.02% 0.02%<br />
GD midea <strong>Holding</strong> Co ltd Consumer Goods 62 862 799 0.16% 0.16%<br />
GD Power Development Co ltd utilities 9 222 530 0.02% 0.02%<br />
Gem-Year industrial Co ltd industrials 1 622 106 0.02% 0.02%<br />
Glodon s<strong>of</strong>tware Co ltd technology 2 307 798 0.03% 0.03%<br />
Goertek inc technology 3 094 823 0.02% 0.02%<br />
Gre<strong>at</strong> Wall motor Co ltd Consumer Goods 436 0.00% 0.00%<br />
Gre<strong>at</strong>Wall inform<strong>at</strong>ion industry Co ltd technology 414 901 0.02% 0.02%<br />
Gree electric appliances inc Consumer Goods <strong>31</strong> 124 618 0.07% 0.07%<br />
GrG banking equipment Co ltd industrials 1 483 976 0.02% 0.02%<br />
Grinm semiconductor m<strong>at</strong>erials Co ltd technology 567 960 0.03% 0.03%<br />
Guangdong advertising Co ltd Consumer services 20 191 0.00% 0.00%<br />
Guangdong baolihua new energy<br />
stock Co ltd utilities 1 479 258 0.03% 0.03%<br />
Guangdong China sunshine media Co ltd Consumer services 772 102 0.02% 0.02%<br />
Guangdong Dongyangguang<br />
aluminum Co ltd basic m<strong>at</strong>erials 618 172 0.01% 0.01%<br />
Guangdong electric Power<br />
Development Co ltd utilities 1 462 027 0.01% 0.01%<br />
Guangdong Golden Dragon Development inc utilities 504 746 0.02% 0.02%<br />
Guangdong Golden Horse tourism Group Co basic m<strong>at</strong>erials 1 367 679 0.01% 0.01%<br />
Guangdong Goworld Co ltd industrials 702 426 0.02% 0.02%<br />
Guangdong Haid Group Co ltd Consumer Goods 33 463 848 0.34% 0.34%<br />
Guangdong Highsun Group Co ltd Financials 1 782 343 0.03% 0.03%<br />
Guangdong investment ltd utilities 5 768 677 0.03% 0.03%<br />
Guangdong Kaiping Chunhui Co ltd basic m<strong>at</strong>erials 824 827 0.03% 0.03%<br />
Guangdong macro Co ltd industrials 655 593 0.02% 0.02%<br />
Guangdong meiyan Hydropower Co ltd utilities 1 269 499 0.03% 0.03%<br />
Guangdong mingzhu Group Co ltd industrials 646 528 0.03% 0.03%<br />
Guangdong Provincial expressway<br />
Development Co ltd industrials 436 668 0.01% 0.01%<br />
Guangdong rongtai industry Co ltd basic m<strong>at</strong>erials 705 986 0.02% 0.02%<br />
Guangdong shaoneng Group utilities 930 801 0.03% 0.03%<br />
Guangdong shengyi science<br />
technology Co ltd industrials 2 254 217 0.03% 0.03%<br />
Guangdong taiantang Pharmaceutical Co ltd Health Care 10 136 0.00% 0.00%<br />
Guangdong Yihua timber industry Co ltd Consumer Goods 999 421 0.02% 0.02%<br />
Guangdong Zhongsheng<br />
Pharmaceutical Co ltd Health Care 23 564 0.00% 0.00%<br />
Guangshen railway Co ltd Consumer services 24 189 926 0.15% 0.15%<br />
Guangxi Guiguan electric Power Co ltd utilities 15 630 594 0.19% 0.19%<br />
Guangxi Guitang Group Co basic m<strong>at</strong>erials 1 409 584 0.07% 0.07%<br />
Guangxi liugong machinery Co ltd industrials 2 710 815 0.02% 0.02%<br />
Guangxi Wuzhou Zhongheng Group Co ltd Health Care 3 221 667 0.03% 0.03%<br />
Guangxia Yinchuan-a Consumer Goods 978 349 0.02% 0.02%<br />
Guangzhou baiyun intern<strong>at</strong>ional airport<br />
Co ltd industrials 1 355 817 0.02% 0.02%<br />
Guangzhou baiyunshan Pharmaceutical<br />
stock Co ltd Health Care 1 887 473 0.03% 0.03%<br />
Guangzhou Development industry<br />
<strong>Holding</strong>s Co utilities 1 483 382 0.01% 0.01%<br />
Guangzhou echom science &<br />
technology Co ltd industrials 6 116 0.00% 0.00%<br />
Guangzhou Friendship Group Co ltd Consumer services 827 429 0.02% 0.02%<br />
Guangzhou Grandbuy Co ltd Consumer services 549 643 0.02% 0.02%<br />
Guangzhou Hengyun enterprises<br />
<strong>Holding</strong>s ltd utilities 475 322 0.02% 0.02%<br />
Guangzhou Pharmaceutical Co ltd Health Care 1 051 565 0.01% 0.01%<br />
Guangzhou shipyard intern<strong>at</strong>ional Co ltd industrials 1 144 <strong>31</strong>4 0.01% 0.01%<br />
Guilin sanjin Pharmaceutical Co ltd Health Care 1 591 851 0.02% 0.02%<br />
Guizhou Changzheng electric Co ltd industrials 1 342 046 0.03% 0.03%<br />
Guizhou Chitianhua Co ltd basic m<strong>at</strong>erials 684 124 0.02% 0.02%<br />
Guizhou Guihang automotive<br />
Components Co ltd Consumer Goods 422 804 0.02% 0.02%<br />
Guizhou Panjiang refined Coal Co ltd basic m<strong>at</strong>erials 3 299 587 0.02% 0.02%<br />
Guizhou red star Developing Co ltd basic m<strong>at</strong>erials 1 394 601 0.04% 0.04%<br />
Guizhou space appliance Co ltd industrials 791 388 0.02% 0.02%<br />
Guizhou Yibai Pharmaceutical Co ltd Health Care 2 443 285 0.04% 0.04%<br />
Guodian nanjing autom<strong>at</strong>ion Co ltd industrials 1 662 802 0.04% 0.04%<br />
Guodian technology & environment<br />
Group Co ltd industrials 58 692 797 0.58% 0.58%<br />
Guoguang electric Co ltd Consumer Goods 1 156 007 0.05% 0.05%<br />
Guomai technologies inc technology 858 327 0.02% 0.02%<br />
Hafei avi<strong>at</strong>ion industry Co ltd industrials 1 <strong>31</strong>5 048 0.02% 0.02%<br />
Haikou agriculture & industry Co Consumer Goods 1 273 933 0.04% 0.04%<br />
Haima automobile Group Co ltd Consumer Goods 435 555 0.01% 0.01%<br />
Hainan airlines Co ltd Consumer services 2 380 106 0.01% 0.01%<br />
Hainan expressway Co ltd industrials 1 283 358 0.04% 0.04%<br />
Hainan Haiyao Co ltd Health Care 2 556 851 0.05% 0.05%<br />
Hainan strait shipping Co ltd industrials 14 960 0.00% 0.00%<br />
Hainan Yedao Co ltd Consumer Goods 1 760 505 0.06% 0.06%<br />
voting<br />
ownership<br />
sector<br />
market value<br />
(noK)<br />
Haining China le<strong>at</strong>her market Co ltd Consumer Goods 2 128 603 0.02% 0.02%<br />
Haitong securities Co ltd Financials 10 286 167 0.02% 0.02%<br />
Hand enterprise solutions Co ltd technology 19 773 043 0.67% 0.67%<br />
Hangzhou Hangyang Co ltd industrials <strong>31</strong> 874 0.00% 0.00%<br />
Hangzhou Hikvision Digital technology Co ltd industrials 3 032 166 0.01% 0.01%<br />
Hangzhou iron & steel Co basic m<strong>at</strong>erials 477 011 0.02% 0.02%<br />
Hangzhou silan microelectronics Co ltd technology 971 158 0.03% 0.03%<br />
Hangzhou steam turbine Co industrials 24 359 543 0.61% 0.61%<br />
Han’s laser technology Co ltd industrials 2 117 035 0.03% 0.03%<br />
Hanwang technology Co ltd technology 614 695 0.03% 0.03%<br />
Harbin air Conditioning Co ltd industrials 588 774 0.03% 0.03%<br />
Harbin Dongan auto engine Co Consumer Goods 443 187 0.02% 0.02%<br />
Harbin electric Co ltd industrials 51 619 041 0.72% 0.72%<br />
Harbin Gloria Pharmaceuticals Co ltd Health Care 1 176 585 0.03% 0.03%<br />
Harbin Gong Da High-tech enterprise<br />
Development Co ltd Consumer Goods 280 505 0.02% 0.02%<br />
Harbin H<strong>at</strong>ou investment Co ltd utilities 1 044 052 0.03% 0.03%<br />
Harbin Pharmaceutical Group Co ltd Health Care 3 679 980 0.03% 0.03%<br />
Harbin Pharmaceutical Group sanjing<br />
Pharmaceutical Co ltd Health Care 622 978 0.01% 0.01%<br />
Hebei Cangzhou Dahua Co ltd basic m<strong>at</strong>erials 339 325 0.02% 0.02%<br />
Hebei Chengde lolo Co Consumer Goods 1 053 325 0.02% 0.02%<br />
Hebei Hengshui laobaigan liquor Co ltd Consumer Goods 1 335 163 0.05% 0.05%<br />
Hebei iron & steel Co ltd basic m<strong>at</strong>erials 4 419 506 0.02% 0.02%<br />
Hefei Department store Group Co ltd Consumer services 20 391 785 0.29% 0.29%<br />
Hefei Fengle seed Co ltd Consumer Goods 1 916 360 0.05% 0.05%<br />
Hefei meiling Co ltd Consumer Goods 1 134 642 0.04% 0.04%<br />
Heilongjiang agriculture Co ltd Consumer Goods 1 966 626 0.01% 0.01%<br />
HeilongJiang HeiHua Co basic m<strong>at</strong>erials 429 564 0.03% 0.03%<br />
Henan ancai Hi-tech Co ltd industrials 488 538 0.03% 0.03%<br />
Henan Huanghe Whirlwind Co ltd basic m<strong>at</strong>erials 1 208 828 0.04% 0.04%<br />
Henan lianhua Gourmet Powder Co Consumer Goods 1 272 347 0.04% 0.04%<br />
Henan Pinggao electric Co ltd industrials 2 614 173 0.04% 0.04%<br />
Henan rebecca Hair Products Co ltd Consumer Goods 1 2<strong>31</strong> 541 0.02% 0.02%<br />
Henan shenhuo Coal & Power Co ltd basic m<strong>at</strong>erials 4 855 472 0.03% 0.03%<br />
Henan shuanghui investment &<br />
Development Co ltd Consumer Goods 127 195 783 0.32% 0.32%<br />
Henan Xindaxin m<strong>at</strong>erials Co ltd technology 22 927 0.00% 0.00%<br />
Henan Yinge industrial investment<br />
<strong>Holding</strong> Co ltd basic m<strong>at</strong>erials 1 005 850 0.02% 0.02%<br />
Henan Yuguang Gold & lead Co ltd basic m<strong>at</strong>erials 927 416 0.02% 0.02%<br />
Henan Zhongfu industry Co ltd basic m<strong>at</strong>erials 2 335 351 0.03% 0.03%<br />
Henan Zhongyuan expressway Co ltd industrials 990 411 0.02% 0.02%<br />
Hengbao Co ltd industrials 1 408 165 0.04% 0.04%<br />
Hengdian Group DmeGC magnetics Co ltd industrials 885 203 0.01% 0.01%<br />
Hengtong optic-electric Co ltd technology 574 493 0.02% 0.02%<br />
Hisense electric Co ltd Consumer Goods 1 960 036 0.02% 0.02%<br />
Hollysys autom<strong>at</strong>ion technologies ltd industrials 29 136 582 1.05% 1.05%<br />
Hongrun Construction Group Co ltd industrials 359 151 0.01% 0.01%<br />
Huabei expressway Co ltd industrials 451 084 0.01% 0.01%<br />
Huadian energy Co ltd utilities 478 303 0.01% 0.01%<br />
Huadian Power intern<strong>at</strong>ional Co utilities 842 021 0.00% 0.00%<br />
Huadong medicine Co ltd Health Care 1 414 909 0.01% 0.01%<br />
Huagong tech Co ltd industrials 1 042 571 0.02% 0.02%<br />
Hualan biological engineering inc Health Care 4 483 089 0.03% 0.03%<br />
Huaneng Power intern<strong>at</strong>ional inc utilities 3 457 722 0.00% 0.00%<br />
Huaneng renewables Corp ltd oil & Gas 120 596 545 0.97% 0.97%<br />
Huangshan tourism Development Co ltd Consumer services 577 <strong>31</strong>0 0.01% 0.01%<br />
Hu<strong>at</strong>ian Hotel Group Co ltd Consumer services 567 303 0.02% 0.02%<br />
Huawen media investment Group Corp Consumer services 2 453 034 0.03% 0.03%<br />
Huaxin Cement Co ltd industrials 668 708 0.01% 0.01%<br />
Huayi electric Co ltd industrials 465 785 0.01% 0.01%<br />
Huayu automotive systems Co ltd Consumer Goods 3 791 334 0.02% 0.02%<br />
Huazhi <strong>Holding</strong> Zhejiang Co ltd industrials 555 795 0.04% 0.04%<br />
Hubei biocause Pharmaceutical Co ltd basic m<strong>at</strong>erials 1 346 862 0.04% 0.04%<br />
Hubei Chutian expressway Co ltd industrials 436 128 0.01% 0.01%<br />
Hubei eastern Gold Jade Co ltd Consumer services 1 209 537 0.03% 0.03%<br />
Hubei Fuxing science & technique Co ltd basic m<strong>at</strong>erials 1 268 130 0.03% 0.03%<br />
Hubei Guangji Pharmaceutical Co ltd Health Care 398 933 0.02% 0.02%<br />
Hubei mailyard share Co ltd Consumer Goods 823 9<strong>31</strong> 0.04% 0.04%<br />
Hubei sanonda Co ltd basic m<strong>at</strong>erials 389 413 0.01% 0.01%<br />
Hubei sanxia new building m<strong>at</strong>erial Co ltd industrials 1 181 592 0.05% 0.05%<br />
Hubei shuanghuan science and<br />
technology stock Co ltd basic m<strong>at</strong>erials 608 290 0.02% 0.02%<br />
Hubei Xingfa Chemicals Group Co ltd basic m<strong>at</strong>erials 1 979 078 0.03% 0.03%<br />
Hubei Yihua Chemical industry Co ltd basic m<strong>at</strong>erials 33 002 745 0.<strong>31</strong>% 0.<strong>31</strong>%<br />
Huludao Zinc industry Co basic m<strong>at</strong>erials 1 426 175 0.03% 0.03%<br />
Hunan Corun new energy Co ltd basic m<strong>at</strong>erials 1 267 075 0.03% 0.03%<br />
Hunan Friendship & apollo Cmmericial Co ltd Consumer services 26 220 858 0.51% 0.51%<br />
Hunan investment Group Co ltd industrials 375 395 0.02% 0.02%<br />
Hunan Jinjian Cereals industry Co Consumer Goods 456 411 0.02% 0.02%<br />
Hunan mendale Hometextile Co ltd Consumer Goods 29 811 0.00% 0.00%<br />
Hunan tv & broadcast intermediary Co ltd Consumer services 2 997 302 0.03% 0.03%<br />
Hunan valin steel Co ltd basic m<strong>at</strong>erials 1 080 666 0.01% 0.01%<br />
Hundsun electronics Co ltd technology 2 964 746 0.04% 0.04%<br />
Huolinhe opencut Coal industry Co ltd <strong>of</strong><br />
inner mongolia basic m<strong>at</strong>erials 1 329 996 0.01% 0.01%<br />
industrial & Commercial bank <strong>of</strong> China Financials 1 393 249 273 0.11% 0.11%<br />
industrial bank Co ltd Financials 39 364 201 0.03% 0.03%<br />
inner mongolia baotou steel rare-earth<br />
Hi-tech Co ltd basic m<strong>at</strong>erials 8 758 884 0.02% 0.02%<br />
Country associ<strong>at</strong>ion according to Ftse (the benchmark provider for <strong>equities</strong>). if a company is not in the benchmark, the country <strong>of</strong> incorpor<strong>at</strong>ion is listed. sector classific<strong>at</strong>ion according to iCb (the industry Classific<strong>at</strong>ion<br />
benchmark company).<br />
voting<br />
ownership<br />
HOLdiNgs<br />
7<br />
<strong>Government</strong> <strong>Pension</strong> FunD <strong>Global</strong> ANNUAL REPORT 2011
<strong>Government</strong> <strong>Pension</strong> <strong>Fund</strong> <strong>Global</strong> <strong>Holding</strong> <strong>of</strong> <strong>equities</strong> <strong>at</strong> <strong>31</strong> December 2011<br />
sector<br />
market value<br />
(noK)<br />
inner mongolia eerduosi resourses Co ltd Consumer Goods 550 993 0.00% 0.00%<br />
inner mongolia Jinyu Group ltd Health Care 882 335 0.03% 0.03%<br />
inner mongolia lantai industrial Co ltd basic m<strong>at</strong>erials 530 715 0.02% 0.02%<br />
inner mongolia mengDian Huaneng<br />
thermal Power Co ltd utilities 2 320 078 0.01% 0.01%<br />
inner mongolia Pingzhuang energy Co ltd basic m<strong>at</strong>erials 1 441 524 0.01% 0.01%<br />
inner mongolia Xingye mining Co ltd utilities 1 167 257 0.03% 0.03%<br />
inner mongolia Yili industrial Group Co ltd Consumer Goods 62 933 676 0.20% 0.20%<br />
inner mongolia Yuan Xing energy Co ltd basic m<strong>at</strong>erials 1 891 889 0.05% 0.05%<br />
inner mongolian baotou steel union Co ltd basic m<strong>at</strong>erials 4 205 814 0.02% 0.02%<br />
insigma technology Co ltd technology 1 238 332 0.03% 0.03%<br />
iriCo Display Devices Co ltd industrials 935 395 0.02% 0.02%<br />
Ja solar <strong>Holding</strong>s Co ltd oil & Gas 2 880 786 0.21% 0.21%<br />
Jiangling motors Corp ltd Consumer Goods 1 071 761 0.01% 0.01%<br />
Jiangnan Heavy industry industrials 2 347 575 0.03% 0.03%<br />
Jiangsu aoyang technology Corp basic m<strong>at</strong>erials 503 576 0.03% 0.03%<br />
Jiangsu Changfa refriger<strong>at</strong>ion Co ltd industrials 6 500 0.00% 0.00%<br />
Jiangsu Changjiang electronics<br />
technology Co ltd technology 1 615 354 0.04% 0.04%<br />
Jiangsu Changqing agricultureal and<br />
Chemical Co ltd basic m<strong>at</strong>erials 13 332 0.00% 0.00%<br />
Jiangsu Chengxing Phosph-Chemicals Co ltd basic m<strong>at</strong>erials 1 142 697 0.03% 0.03%<br />
Jiangsu expressway Co ltd industrials 1 934 690 0.01% 0.01%<br />
Jiangsu Guotai intern<strong>at</strong>ional Group<br />
Guomao Co ltd Consumer Goods 1 268 200 0.03% 0.03%<br />
Jiangsu Hengrui medicine Co ltd Health Care 54 751 692 0.17% 0.17%<br />
Jiangsu Holly Corp Consumer services 869 805 0.04% 0.04%<br />
Jiangsu Hongdou industry Co ltd Consumer Goods 666 422 0.03% 0.03%<br />
Jiangsu Hongtu High technology Co ltd technology 908 568 0.02% 0.02%<br />
Jiangsu Huachang Chemical Co ltd basic m<strong>at</strong>erials 328 730 0.02% 0.02%<br />
Jiangsu Huaxicun Co ltd Consumer Goods 1 042 804 0.03% 0.03%<br />
Jiangsu Jianghuai engine Co ltd industrials 2 136 498 0.03% 0.03%<br />
Jiangsu Jiangnan High Polymer Fiber Co ltd basic m<strong>at</strong>erials 702 772 0.03% 0.03%<br />
Jiangsu Kanion Pharmaceutical Co ltd Health Care 1 701 541 0.03% 0.03%<br />
Jiangsu lianyungang Port Co ltd industrials 459 595 0.02% 0.02%<br />
Jiangsu sihuan bioengineering Co ltd Health Care 1 286 167 0.03% 0.03%<br />
Jiangsu skyrun corp Consumer Goods 453 504 0.02% 0.02%<br />
Jiangsu sunshine Co ltd Consumer Goods 1 434 413 0.03% 0.03%<br />
Jiangsu Wujiang China eastern silk<br />
market Co ltd Consumer Goods 776 929 0.02% 0.02%<br />
Jiangsu Wuzhong industrial Co Consumer Goods 1 455 643 0.03% 0.03%<br />
Jiangsu Yanghe brewery Joint-stock Co ltd Consumer Goods 6 433 865 0.01% 0.01%<br />
Jiangsu Yangnong Chemical Co ltd basic m<strong>at</strong>erials 385 1<strong>31</strong> 0.02% 0.02%<br />
Jiangsu Yongding Co-a industrials 1 100 572 0.05% 0.05%<br />
Jiangsu Yueda investment Co ltd industrials 2 204 229 0.03% 0.03%<br />
Jiangsu Yuyue medical equipment &<br />
supply Co ltd Health Care 16 273 100 0.20% 0.20%<br />
Jiangsu Zhongda new m<strong>at</strong>erial Group Co ltd basic m<strong>at</strong>erials 471 704 0.03% 0.03%<br />
Jiangsu Zhongnan Construction Group Co ltd industrials 1 989 567 0.02% 0.02%<br />
Jiangsu Zhongtian technologies Co ltd technology 1 798 655 0.03% 0.03%<br />
Jiangsu Zongyi Co ltd oil & Gas 2 240 793 0.02% 0.02%<br />
Jiangxi Copper Co ltd basic m<strong>at</strong>erials 95 218 663 0.21% 0.21%<br />
Jiangxi Ganneng Co ltd utilities 613 536 0.02% 0.02%<br />
Jiangxi Ganyue expressway Co ltd industrials 1 454 720 0.02% 0.02%<br />
Jiangxi Hongdu avi<strong>at</strong>ion industry Corp ltd industrials 1 752 362 0.02% 0.02%<br />
Jiangxi lianchuang optoelectronic science<br />
& technology Co ltd industrials 521 453 0.02% 0.02%<br />
Jiangxi Wannianqing Cement Co ltd industrials 804 450 0.02% 0.02%<br />
Jiangzhong Pharmaceutical Co ltd Health Care 2 852 887 0.03% 0.03%<br />
Jiaozuo Wanfang aluminum<br />
manufacturing Co ltd basic m<strong>at</strong>erials 1 274 726 0.03% 0.03%<br />
Jihua Group Corp ltd Consumer Goods 1 746 914 0.01% 0.01%<br />
Jilin aodong medicine industry<br />
Groups Co ltd Health Care 3 367 917 0.03% 0.03%<br />
Jilin Power share Co ltd utilities 951 458 0.04% 0.04%<br />
Jilin sino-microelectronics Co ltd industrials 806 660 0.03% 0.03%<br />
Jilin Y<strong>at</strong>ai Group Co ltd industrials 2 715 427 0.03% 0.03%<br />
Jinan iron and steel Co ltd basic m<strong>at</strong>erials 1 665 670 0.02% 0.02%<br />
Jinan Qingqi motorcycle Co Consumer Goods 457 017 0.01% 0.01%<br />
Jinduicheng molybdenum Co ltd basic m<strong>at</strong>erials 2 167 084 0.01% 0.01%<br />
Jinkosolar <strong>Holding</strong> Co ltd oil & Gas 3 448 968 0.12% 0.48%<br />
Jinlin Ji en nickel industry Co ltd basic m<strong>at</strong>erials 1 450 477 0.02% 0.02%<br />
Jinling Pharmaceutical Co ltd Health Care 624 270 0.02% 0.02%<br />
Jinzhou Port Co ltd industrials 965 500 0.02% 0.02%<br />
JiuGuiJiu Co ltd Consumer Goods 3 158 791 0.04% 0.04%<br />
Jiuzhitang Co ltd Health Care 607 878 0.02% 0.02%<br />
Jizhong energy resources Co ltd basic m<strong>at</strong>erials 3 884 775 0.01% 0.01%<br />
Joincare Pharmaceutical Group<br />
industry Co ltd Health Care 1 414 858 0.02% 0.02%<br />
Jointo energy investment Co ltd Hebei utilities 1 290 007 0.03% 0.03%<br />
Jonjee High-tech industrial and<br />
Commercial <strong>Holding</strong> Co ltd industrials 947 730 0.03% 0.03%<br />
Joyoung Co ltd Consumer Goods 535 547 0.01% 0.01%<br />
Kaile technology Co ltd Hubei basic m<strong>at</strong>erials 593 397 0.02% 0.02%<br />
Kailuan energy Chemical Co ltd basic m<strong>at</strong>erials 1 752 957 0.01% 0.01%<br />
Kangmei Pharmaceutical Co ltd Health Care 7 975 852 0.03% 0.03%<br />
Keda industrial Co ltd industrials 1 497 203 0.03% 0.03%<br />
Kingfa sci & tech Co ltd basic m<strong>at</strong>erials 3 1<strong>31</strong> 251 0.02% 0.02%<br />
Kingway brewery <strong>Holding</strong>s ltd Consumer Goods 20 0<strong>31</strong> 679 0.70% 0.70%<br />
Konka Group Co ltd Consumer Goods 807 503 0.02% 0.02%<br />
Kunlun energy Co ltd oil & Gas 340 914 391 0.56% 0.56%<br />
voting<br />
ownership<br />
sector<br />
market value<br />
(noK)<br />
Kunming Pharmaceutical Corp Health Care 2 807 696 0.06% 0.06%<br />
Kunming Yunnei Power Co ltd industrials 506 804 0.02% 0.02%<br />
Kweichow moutai Co ltd Consumer Goods 116 580 245 0.06% 0.06%<br />
laiwu steel Corp basic m<strong>at</strong>erials 524 170 0.01% 0.01%<br />
lanzhou Gre<strong>at</strong> Wall electrical Co ltd industrials 427 442 0.02% 0.02%<br />
lao Feng Xiang Co ltd Consumer Goods 1 698 698 0.02% 0.02%<br />
leaguer stock Co ltd industrials 549 120 0.02% 0.02%<br />
leshan electric Power Co utilities 936 134 0.04% 0.04%<br />
lianhe Chemical technology Co ltd basic m<strong>at</strong>erials 2 038 137 0.03% 0.03%<br />
lianhua supermarket <strong>Holding</strong>s Co ltd Consumer services 11 179 964 0.13% 0.13%<br />
liaoning Cheng Da Co ltd Consumer services 6 260 872 0.04% 0.04%<br />
liaoning Huajin tongda Chemicals Co ltd basic m<strong>at</strong>erials 1 198 760 0.01% 0.01%<br />
liaoning sG automotive Group Co ltd Consumer Goods 2 333 171 0.06% 0.06%<br />
lingyuan iron & steel Co ltd basic m<strong>at</strong>erials 1 033 832 0.02% 0.02%<br />
lingyun industrial Corp ltd Consumer Goods 500 602 0.02% 0.02%<br />
liuzhou Chemical industry Co ltd basic m<strong>at</strong>erials 564 458 0.02% 0.02%<br />
liuzhou iron & steel Co ltd basic m<strong>at</strong>erials 463 266 0.01% 0.01%<br />
liuzhou liangmianzhen Co ltd Consumer Goods 416 546 0.02% 0.02%<br />
livzon Pharmaceutical inc Health Care 1 177 586 0.02% 0.02%<br />
long Yuan Construction Group Co ltd industrials 777 089 0.02% 0.02%<br />
lucky Film Co Consumer Goods 1 867 917 0.06% 0.06%<br />
luolai Home textile Co ltd Consumer Goods 2 758 541 0.03% 0.03%<br />
luthai textile Co ltd Consumer Goods 1 165 622 0.02% 0.02%<br />
luxi Chemical Group Co ltd basic m<strong>at</strong>erials 1 602 827 0.02% 0.02%<br />
luxin venture Capital Group Co ltd industrials 2 345 763 0.02% 0.02%<br />
luzhou laojiao Co ltd Consumer Goods 40 745 861 0.08% 0.08%<br />
maanshan Fangyuan slewing ring Co ltd industrials 399 437 0.02% 0.02%<br />
maanshan iron & steel basic m<strong>at</strong>erials 38 489 647 0.26% 0.26%<br />
maoming Petro-Chemical shihua Co ltd basic m<strong>at</strong>erials 603 647 0.03% 0.03%<br />
markor intern<strong>at</strong>ional Furniture Co ltd Consumer Goods 768 983 0.01% 0.01%<br />
mayinglong Pharmaceutical Group Co ltd Health Care 1 209 901 0.02% 0.02%<br />
meidu <strong>Holding</strong>s Co ltd industrials 1 066 749 0.03% 0.03%<br />
mesnac Co ltd industrials 76 647 342 0.72% 0.72%<br />
metallurgical Corp <strong>of</strong> China ltd industrials 3 177 862 0.01% 0.01%<br />
mie <strong>Holding</strong>s Corp oil & Gas 121 083 594 3.02% 3.02%<br />
minmetals Development Co ltd industrials 3 469 423 0.02% 0.02%<br />
minsheng investment management Co ltd Consumer services 921 050 0.04% 0.04%<br />
nafine Chemical industry Group Co ltd Consumer Goods 396 583 0.02% 0.02%<br />
nanhai Development Co ltd utilities 652 437 0.03% 0.03%<br />
nanjing Central emporium Consumer services 1 272 108 0.04% 0.04%<br />
nanjing Huadong electronics inform<strong>at</strong>ion<br />
& technology Co ltd industrials 825 413 0.04% 0.04%<br />
nanjing iron & steel Co ltd basic m<strong>at</strong>erials 447 063 0.00% 0.00%<br />
nanjing Pharmaceutical Co ltd Health Care 792 287 0.03% 0.03%<br />
nanjing redsun Co ltd basic m<strong>at</strong>erials 1 000 828 0.02% 0.02%<br />
nanjing sample technology Co ltd industrials 56 808 405 3.23% 3.23%<br />
nanjing Xinjiekou Department store Co ltd Consumer services 548 611 0.02% 0.02%<br />
nanjing Yunhai special metals Co ltd basic m<strong>at</strong>erials 710 805 0.03% 0.03%<br />
nanning sugar industry Co ltd Consumer Goods 597 765 0.02% 0.02%<br />
nantong Jiangshan agrochemical &<br />
Chemical llC basic m<strong>at</strong>erials 294 836 0.02% 0.02%<br />
nari technology Development Co ltd industrials 6 478 838 0.02% 0.02%<br />
n<strong>at</strong>ionz technologies inc technology 33 057 0.00% 0.00%<br />
netease.com technology 23 045 746 0.07% 0.07%<br />
neus<strong>of</strong>t Corp technology 843 844 0.01% 0.01%<br />
new China life insurance Co ltd Financials 26 712 913 0.04% 0.04%<br />
new Hope liuhe Co ltd Consumer Goods 14 413 421 0.05% 0.05%<br />
new oriental educ<strong>at</strong>ion & technology Group Consumer services 89 585 040 0.39% 0.39%<br />
ningbo bird Co ltd technology 393 713 0.02% 0.02%<br />
ningbo Fuda Co ltd industrials 570 458 0.01% 0.01%<br />
ningbo Huaxiang electronic Co ltd Consumer Goods 1 222 056 0.03% 0.03%<br />
ningbo lugong online monitoring<br />
technology Co ltd industrials 17 897 0.00% 0.00%<br />
ningbo marine Co ltd industrials 325 580 0.01% 0.01%<br />
ningbo shanshan Co ltd Consumer Goods 1 115 481 0.02% 0.02%<br />
ningbo Yunsheng Group Co ltd industrials 2 418 678 0.03% 0.03%<br />
ningxia Dayuan Chemical Co ltd basic m<strong>at</strong>erials 699 812 0.04% 0.04%<br />
ningxia orient tantalum industry Co ltd basic m<strong>at</strong>erials 2 266 605 0.04% 0.04%<br />
ningxia saima industry Co ltd industrials 976 817 0.03% 0.03%<br />
ningXia YinXing energy Co ltd oil & Gas 408 732 0.02% 0.02%<br />
north China Pharmaceutical Co ltd Health Care 1 892 449 0.03% 0.03%<br />
northeast Pharmaceutical Group Co ltd Health Care 458 719 0.02% 0.02%<br />
<strong>of</strong>fshore oil engineering Co ltd oil & Gas 6 630 492 0.03% 0.03%<br />
orient Group inc Consumer services 2 585 101 0.03% 0.03%<br />
origin agritech ltd Consumer Goods 4 225 309 1.16% 1.16%<br />
origo Partners PlC Financials 9 438 620 0.81% 0.81%<br />
Palm landscape architecture Co ltd industrials 1 776 873 0.02% 0.02%<br />
Pangang Group steel vanadium &<br />
titanium Co ltd basic m<strong>at</strong>erials 7 006 271 0.02% 0.02%<br />
PetroChina Co ltd oil & Gas 14 613 710 0.00% 0.00%<br />
Phoenix new media ltd Consumer services 15 865 273 4.36% 0.63%<br />
PiCC Property & Casualty Co ltd Financials 455 781 437 0.46% 0.46%<br />
Ping an insurance Group Co Financials 501 373 445 0.16% 0.16%<br />
Pingdingshan tianan Coal mining Co ltd basic m<strong>at</strong>erials 4 458 893 0.02% 0.02%<br />
PKu intern<strong>at</strong>ional Healthcare Group<br />
southwest Pharmaceutical Co ltd Health Care 1 434 542 0.04% 0.04%<br />
Poly Hong Kong investments ltd Financials 45 630 443 0.49% 0.49%<br />
Poly real est<strong>at</strong>e Group Co ltd Financials 11 482 122 0.02% 0.02%<br />
Qihoo 360 technology Co ltd technology 228 717 880 0.49% 1.26%<br />
Qinchuan machinery Development Co industrials 678 267 0.03% 0.03%<br />
Qingdao Doublestar Co ltd Consumer Goods 543 044 0.03% 0.03%<br />
Country associ<strong>at</strong>ion according to Ftse (the benchmark provider for <strong>equities</strong>). if a company is not in the benchmark, the country <strong>of</strong> incorpor<strong>at</strong>ion is listed. sector classific<strong>at</strong>ion according to iCb (the industry Classific<strong>at</strong>ion<br />
benchmark company).<br />
voting<br />
ownership<br />
HOLdiNgs<br />
8<br />
<strong>Government</strong> <strong>Pension</strong> FunD <strong>Global</strong> ANNUAL REPORT 2011
<strong>Government</strong> <strong>Pension</strong> <strong>Fund</strong> <strong>Global</strong> <strong>Holding</strong> <strong>of</strong> <strong>equities</strong> <strong>at</strong> <strong>31</strong> December 2011<br />
sector<br />
market value<br />
(noK)<br />
Qingdao easts<strong>of</strong>t Communic<strong>at</strong>ion<br />
technology Co ltd technology 22 578 870 0.35% 0.35%<br />
Qingdao Haier Co ltd Consumer Goods 7 593 561 0.03% 0.03%<br />
Qingdao soda ash industrial Co ltd basic m<strong>at</strong>erials 624 229 0.03% 0.03%<br />
Qinghai salt lake industry Co ltd basic m<strong>at</strong>erials 5 757 145 0.01% 0.01%<br />
rainbow Department store Co ltd Consumer services 16 736 0.00% 0.00%<br />
real Gold mining ltd basic m<strong>at</strong>erials 17 252 609 0.28% 0.28%<br />
renhe Pharmacy Co ltd Health Care 1 386 185 0.02% 0.02%<br />
renrenle Commercial Group Co ltd Consumer services 7 197 0.00% 0.00%<br />
rising nonferrous metals share Co ltd basic m<strong>at</strong>erials 1 409 167 0.02% 0.02%<br />
rizhao Port Co ltd industrials 882 477 0.01% 0.01%<br />
rongxin Power electronic Co ltd industrials 26 152 564 0.34% 0.34%<br />
saiC motor Corp ltd Consumer Goods 38 746 552 0.03% 0.03%<br />
sanan optoelectronics Co ltd industrials 1 979 069 0.01% 0.01%<br />
sanlian Commercial Co ltd Consumer services 575 517 0.04% 0.04%<br />
sansteel minguang Co ltd Fujian basic m<strong>at</strong>erials 545 402 0.02% 0.02%<br />
sany Heavy industry Co ltd industrials 19 993 221 0.02% 0.02%<br />
science City Development PCl Consumer services 709 640 0.02% 0.02%<br />
sDiC Huajing Power <strong>Holding</strong>s Co ltd utilities 8 563 580 0.06% 0.06%<br />
sDiC Xinji energy Co ltd basic m<strong>at</strong>erials 1 224 198 0.01% 0.01%<br />
sDiC Zhonglu Fruit Juice Co ltd Consumer Goods 566 326 0.03% 0.03%<br />
searainbow <strong>Holding</strong> Corp technology 1 510 771 0.03% 0.03%<br />
sGis songshan Co ltd basic m<strong>at</strong>erials 1 014 580 0.02% 0.02%<br />
shaan Xi Provincial n<strong>at</strong>ural Gas Co ltd oil & Gas 695 650 0.01% 0.01%<br />
shaanxi aerospace Power Hi-tech Co ltd industrials 1 025 018 0.04% 0.04%<br />
shaanxi broadcast & tv network<br />
media Co ltd Consumer services 1 075 771 0.02% 0.02%<br />
shaanxi Qinling Cement Co ltd industrials 435 023 0.02% 0.02%<br />
shaanxi Xinghua Chemistry Co ltd basic m<strong>at</strong>erials 980 526 0.04% 0.04%<br />
shandong bohui Paper industrial Co ltd basic m<strong>at</strong>erials 906 955 0.04% 0.04%<br />
shandong Chenming Paper <strong>Holding</strong>s ltd basic m<strong>at</strong>erials 14 722 915 0.23% 0.23%<br />
shandong Delisi Food Co ltd Consumer Goods 4 817 0.00% 0.00%<br />
shandong Denghai seeds Co ltd Consumer Goods 1 678 339 0.02% 0.02%<br />
shandong Dong-e e-Jiao-a Health Care 126 137 773 0.47% 0.47%<br />
shandong expressway Co ltd industrials 821 920 0.01% 0.01%<br />
shandong Gold mining Co ltd basic m<strong>at</strong>erials 7 485 343 0.02% 0.02%<br />
shandong Haihua Co ltd basic m<strong>at</strong>erials 1 479 665 0.03% 0.03%<br />
shandong Helon Co ltd basic m<strong>at</strong>erials 875 214 0.02% 0.02%<br />
shandong Homey aqu<strong>at</strong>ic<br />
Development Co ltd Consumer Goods 19 354 820 0.30% 0.30%<br />
shandong Hualu Hengsheng Chemical Co ltd basic m<strong>at</strong>erials 1 420 144 0.02% 0.02%<br />
shandong Hu<strong>at</strong>ai Paper Co ltd basic m<strong>at</strong>erials 794 938 0.02% 0.02%<br />
shandong Humon smelting Co ltd basic m<strong>at</strong>erials 484 280 0.01% 0.01%<br />
shandong Jinjing science & technology<br />
Co ltd industrials 1 344 095 0.02% 0.02%<br />
shandong Jinling mining Co ltd basic m<strong>at</strong>erials 1 457 219 0.02% 0.02%<br />
shandong lukang Pharma Health Care 6<strong>31</strong> 771 0.02% 0.02%<br />
shandong luyang share Co ltd industrials 21 118 0.00% 0.00%<br />
shandong nanshan aluminum Co ltd basic m<strong>at</strong>erials 2 <strong>31</strong>0 203 0.02% 0.02%<br />
shandong Pharmaceutical Glass Co ltd Health Care 897 012 0.03% 0.03%<br />
shandong shengli Co industrials 454 206 0.02% 0.02%<br />
shandong sun Paper industry Joint<br />
stock Co ltd basic m<strong>at</strong>erials 23 546 998 0.30% 0.30%<br />
shandong Weigao Group medical<br />
Polymer Co ltd Health Care 690 886 856 2.87% 2.87%<br />
shandong Xinneng taishan Power<br />
Gener<strong>at</strong>ion Co ltd utilities 740 200 0.04% 0.04%<br />
shangdong lubei Chemical Co ltd basic m<strong>at</strong>erials 612 159 0.04% 0.04%<br />
shanghai 3F new m<strong>at</strong>erials Co basic m<strong>at</strong>erials 1 711 161 0.03% 0.03%<br />
shanghai aCe Co ltd basic m<strong>at</strong>erials 569 633 0.03% 0.03%<br />
shanghai aerospace automobile<br />
electromechanical Co Consumer Goods 1 055 252 0.02% 0.02%<br />
shanghai belling Co ltd technology 1 039 182 0.04% 0.04%<br />
shanghai Chengtou <strong>Holding</strong> Co ltd Financials 2 121 152 0.02% 0.02%<br />
shanghai Chlor-alkali Chemical Co ltd basic m<strong>at</strong>erials 1 025 573 0.01% 0.01%<br />
shanghai Construction Co ltd industrials 937 948 0.01% 0.01%<br />
shanghai Dajiang Group Consumer Goods 510 693 0.02% 0.02%<br />
shanghai D<strong>at</strong>un energy resources Co ltd basic m<strong>at</strong>erials 1 737 594 0.01% 0.01%<br />
shanghai Dazhong Public utilities<br />
Group Co ltd utilities 1 810 133 0.03% 0.03%<br />
shanghai Dragon Corp Consumer Goods 706 217 0.04% 0.04%<br />
shanghai electric Group Co ltd industrials 74 969 093 0.21% 0.21%<br />
shanghai electric Power Co ltd utilities 1 421 287 0.01% 0.01%<br />
shanghai Feilo Co ltd industrials 907 755 0.03% 0.03%<br />
shanghai Fosun Pharmaceutical Group Co ltd Health Care 3 864 750 0.03% 0.03%<br />
shanghai Friendship Group inc ltd Consumer services 4 526 369 0.03% 0.03%<br />
shanghai Fudan Forward s & t Co ltd industrials 660 617 0.04% 0.04%<br />
shanghai Haibo Co ltd Consumer services 754 821 0.04% 0.04%<br />
shanghai Haixin Group Co Consumer Goods 2 100 717 0.03% 0.03%<br />
shanghai intern<strong>at</strong>ional airport Co ltd industrials 4 233 877 0.02% 0.02%<br />
shanghai intern<strong>at</strong>ional Port Group Co ltd industrials 6 574 992 0.01% 0.01%<br />
shanghai Jahwa united Co ltd Consumer Goods 4 076 803 0.03% 0.03%<br />
shanghai Jiao Yun Co ltd Consumer Goods 1 039 454 0.03% 0.03%<br />
shanghai Jiaoda onlly Co ltd Consumer Goods 610 394 0.03% 0.03%<br />
shanghai Jielong industry Corp ltd industrials 656 521 0.03% 0.03%<br />
shanghai Jin Jiang intern<strong>at</strong>ional Hotels<br />
Group Co ltd Consumer services 17 843 883 0.54% 0.54%<br />
shanghai Jinfeng investment Co ltd Financials 500 567 0.02% 0.02%<br />
shanghai Jinfeng Wine Co ltd Consumer services 1 078 946 0.03% 0.03%<br />
shanghai Jinjiang intern<strong>at</strong>ional Hotels<br />
Development Co ltd Consumer services 1 458 452 0.01% 0.01%<br />
voting<br />
ownership<br />
sector<br />
market value<br />
(noK)<br />
shanghai Jinjiang intern<strong>at</strong>ional industrial<br />
investment Co ltd industrials 4<strong>31</strong> 126 0.01% 0.01%<br />
shanghai Jinling Co ltd industrials 420 524 0.02% 0.02%<br />
shanghai Join buy Co ltd Consumer services 622 481 0.03% 0.03%<br />
shanghai Kehua bio-engineering Co ltd Health Care 1 002 361 0.02% 0.02%<br />
shanghai lansheng Corp industrials 628 299 0.02% 0.02%<br />
shanghai lengguang industrial industrials 348 964 0.02% 0.02%<br />
shanghai mechanical and electrical<br />
industry Co ltd industrials 845 910 0.01% 0.01%<br />
shanghai metersbonwe Fashion &<br />
accessories Co ltd Consumer Goods 874 225 0.00% 0.00%<br />
shanghai modern Pharmaceutical Co ltd Health Care 822 092 0.03% 0.03%<br />
shanghai new World Co ltd Consumer services 1 000 600 0.03% 0.03%<br />
shanghai nine Dragon Co ltd Consumer services 686 065 0.01% 0.01%<br />
shanghai oriental Pearl Group Co ltd Consumer services 5 086 622 0.03% 0.03%<br />
shanghai Pharmaceuticals <strong>Holding</strong> Co ltd Health Care 4 780 449 0.02% 0.02%<br />
shanghai Prime machinery Co ltd industrials 4 765 907 0.36% 0.36%<br />
shanghai Pudong road & bridge<br />
Construction Co ltd industrials 899 773 0.03% 0.03%<br />
shanghai Qiangsheng <strong>Holding</strong> Co ltd Consumer services 963 362 0.02% 0.02%<br />
shanghai shenda Co ltd Consumer Goods 560 387 0.02% 0.02%<br />
shanghai shenhua <strong>Holding</strong>s Co ltd Consumer services 1 592 966 0.04% 0.04%<br />
shanghai tunnel engineering Co ltd industrials 1 722 301 0.03% 0.03%<br />
shanghai Waigaoqiao Free trade Zone<br />
Development Co ltd industrials 432 558 0.00% 0.00%<br />
shanghai Xinhua media Co ltd Consumer services 1 198 145 0.02% 0.02%<br />
shanghai Xinpeng industrial Co ltd industrials 4 841 0.00% 0.00%<br />
shanghai Y<strong>at</strong>ong Co ltd Consumer services 388 067 0.02% 0.02%<br />
shanghai Yimin Commerce Group Co ltd Consumer services 1 106 212 0.03% 0.03%<br />
shanghai Yuyuan tourist mart Co ltd Consumer services 3 379 982 0.03% 0.03%<br />
shanghai Zhenhua Heavy industries Co ltd industrials 3 128 538 0.02% 0.02%<br />
shanghai Zhixin electric Co ltd industrials 2 173 094 0.03% 0.03%<br />
shanghai Zi Jiang enterprise Group Co ltd industrials 1 336 878 0.02% 0.02%<br />
shantui Construction machinery Co ltd industrials 2 038 445 0.03% 0.03%<br />
shanxi antai Group Co ltd basic m<strong>at</strong>erials 965 121 0.03% 0.03%<br />
shanxi Coal intern<strong>at</strong>ional energy<br />
Group Co ltd basic m<strong>at</strong>erials 2 982 292 0.01% 0.01%<br />
shanxi Coking Co ltd basic m<strong>at</strong>erials 1 716 995 0.04% 0.04%<br />
shanxi Guanlu Co basic m<strong>at</strong>erials 1 282 139 0.02% 0.02%<br />
shanxi lanhua sci-tech venture Co ltd basic m<strong>at</strong>erials 19 672 264 0.09% 0.09%<br />
shanxi lu’an environmental energy<br />
Development Co ltd basic m<strong>at</strong>erials 18 126 257 0.04% 0.04%<br />
shanxi meijin energy Co ltd basic m<strong>at</strong>erials 756 296 0.03% 0.03%<br />
shanxi sanwei Group Co basic m<strong>at</strong>erials 1 082 773 0.03% 0.03%<br />
shanxi taigang stainless steel Co ltd basic m<strong>at</strong>erials 2 569 608 0.01% 0.01%<br />
shanxi Xinghuacun Fen Wine Factory Co ltd Consumer Goods 4 512 577 0.02% 0.02%<br />
shanxi Xishan Coal & electricity<br />
Power Co ltd basic m<strong>at</strong>erials 8 292 359 0.02% 0.02%<br />
shanxi Zhangze electric Power Co ltd utilities 582 257 0.01% 0.01%<br />
shenergy Co ltd utilities 5 166 067 0.03% 0.03%<br />
shenma industry Co ltd basic m<strong>at</strong>erials 975 943 0.03% 0.03%<br />
shenyang Chemical industry basic m<strong>at</strong>erials 991 296 0.03% 0.03%<br />
shenyang Jinbei automotive Co ltd Consumer Goods 468 327 0.02% 0.02%<br />
shenyang Jinshan energy Co ltd utilities 476 046 0.02% 0.02%<br />
shenyang machine tool Co ltd industrials 1 782 500 0.05% 0.05%<br />
shenzhen agricultural Products Co ltd Consumer Goods 2 422 770 0.03% 0.03%<br />
shenzhen airport Co industrials 1 302 490 0.02% 0.02%<br />
shenzhen aisidi Co ltd Consumer services 11 843 0.00% 0.00%<br />
shenzhen Clou electronics Co ltd industrials 1 321 972 0.04% 0.04%<br />
shenzhen Coship electronics Co ltd Consumer Goods 460 685 0.02% 0.02%<br />
shenzhen energy Group Co ltd utilities 1 820 572 0.01% 0.01%<br />
shenzhen Fastprint Circuit tech Co ltd industrials 14 849 0.00% 0.00%<br />
shenzhen Fuanna bedding and<br />
Furnishing Co ltd Consumer Goods 29 091 0.00% 0.00%<br />
shenzhen H&t intelligent Control Co ltd industrials 11 293 0.00% 0.00%<br />
shenzhen Hepalink bio-tech Co ltd Health Care 1 021 132 0.01% 0.01%<br />
shenzhen invengo inform<strong>at</strong>ion<br />
technology JsC ltd industrials 1 028 3<strong>31</strong> 0.02% 0.02%<br />
shenzhen Jinjia Color Printing Group Co ltd industrials 523 154 0.01% 0.01%<br />
shenzhen Kaifa technology Co ltd technology 799 566 0.01% 0.01%<br />
shenzhen Keybridge Communic<strong>at</strong>ions Co ltd technology 7 723 0.00% 0.00%<br />
shenzhen laibao Hi-tech Co ltd industrials 1 4<strong>31</strong> 690 0.02% 0.02%<br />
shenzhen mtC Co ltd Consumer Goods 10 881 0.00% 0.00%<br />
shenzhen mYs environmental Protection<br />
& technology Co ltd industrials 8 552 991 0.25% 0.25%<br />
shenzhen neptunus bioengineering Co ltd Health Care 851 230 0.02% 0.02%<br />
shenzhen overseas Chinese town Co ltd Consumer services 7 638 941 0.02% 0.02%<br />
shenzhen salubris Pharmaceuticals Co ltd Health Care 1 280 662 0.02% 0.02%<br />
shenzhen seG Co ltd industrials 5 194 081 0.26% 0.26%<br />
shenzhen seG samsung Glass Co ltd industrials 1 221 706 0.02% 0.02%<br />
shenzhen tagen Group Co ltd industrials 805 723 0.03% 0.03%<br />
shenzhen topraysolar Co ltd industrials 455 176 0.01% 0.01%<br />
shenzhen Woer He<strong>at</strong>-shrinkable<br />
m<strong>at</strong>erial Co ltd industrials 1 496 912 0.04% 0.04%<br />
shenzhen Yantian Port <strong>Holding</strong> Co ltd industrials 555 853 0.01% 0.01%<br />
shenzhen Zhongjin lingnan<br />
nonfemet Co ltd basic m<strong>at</strong>erials 5 012 384 0.03% 0.03%<br />
shijiazhuang Changshan textile Co ltd Consumer Goods 550 471 0.02% 0.02%<br />
shuangliang eco-energy systems Co ltd industrials 1 001 146 0.02% 0.02%<br />
sichuan Changhong electric Co ltd Consumer Goods 1 803 020 0.02% 0.02%<br />
sichuan Chemical Co ltd basic m<strong>at</strong>erials 356 336 0.02% 0.02%<br />
Country associ<strong>at</strong>ion according to Ftse (the benchmark provider for <strong>equities</strong>). if a company is not in the benchmark, the country <strong>of</strong> incorpor<strong>at</strong>ion is listed. sector classific<strong>at</strong>ion according to iCb (the industry Classific<strong>at</strong>ion<br />
benchmark company).<br />
voting<br />
ownership<br />
HOLdiNgs<br />
9<br />
<strong>Government</strong> <strong>Pension</strong> FunD <strong>Global</strong> ANNUAL REPORT 2011
<strong>Government</strong> <strong>Pension</strong> <strong>Fund</strong> <strong>Global</strong> <strong>Holding</strong> <strong>of</strong> <strong>equities</strong> <strong>at</strong> <strong>31</strong> December 2011<br />
sector<br />
market value<br />
(noK)<br />
sichuan Chengfei integr<strong>at</strong>ion technology<br />
Corp Consumer Goods 1 162 720 0.02% 0.02%<br />
sichuan Chuantou energy Co ltd utilities 1 915 812 0.02% 0.02%<br />
sichuan expressway Co ltd industrials 1 196 118 0.01% 0.01%<br />
sichuan Golden summit Group industrials 613 774 0.03% 0.03%<br />
sichuan Haite High-tech Co ltd industrials 1 446 975 0.05% 0.05%<br />
sichuan Hongda Co ltd basic m<strong>at</strong>erials 2 000 255 0.02% 0.02%<br />
sichuan Jinlu Group Co ltd basic m<strong>at</strong>erials 1 882 260 0.06% 0.06%<br />
sichuan Kelun Pharmaceutical Co ltd Health Care 2 <strong>31</strong>2 728 0.01% 0.01%<br />
sichuan lutianhua Co ltd basic m<strong>at</strong>erials 753 456 0.02% 0.02%<br />
sichuan meifeng Chemical inD basic m<strong>at</strong>erials 1 063 905 0.04% 0.04%<br />
sichuan road & bridge Co ltd industrials 566 230 0.03% 0.03%<br />
sichuan shengda industrial Co ltd basic m<strong>at</strong>erials 456 817 0.03% 0.03%<br />
sichuan swellfun Co ltd Consumer Goods 2 903 496 0.03% 0.03%<br />
sichuan Western resources <strong>Holding</strong> Co ltd basic m<strong>at</strong>erials 1 413 102 0.03% 0.03%<br />
sichuan Xichang electric Power Co ltd utilities 2 276 677 0.07% 0.07%<br />
sichuan Youli investment <strong>Holding</strong> Co ltd basic m<strong>at</strong>erials 516 689 0.03% 0.03%<br />
sieyuan electric Co ltd industrials 1 375 750 0.03% 0.03%<br />
silver Grant intern<strong>at</strong>ional Financials 130 950 113 4.54% 4.54%<br />
silver Plaza Group Co ltd Consumer services 1 579 429 0.03% 0.03%<br />
sinochem intern<strong>at</strong>ional Corp basic m<strong>at</strong>erials 1 648 042 0.02% 0.02%<br />
sin<strong>of</strong>ert <strong>Holding</strong>s ltd basic m<strong>at</strong>erials 73 022 639 0.62% 0.62%<br />
sinoHYDro Group ltd industrials 558 450 0.00% 0.00%<br />
sinoma intern<strong>at</strong>ional engineering Co industrials 3 990 145 0.03% 0.03%<br />
sinoma science & technology Co ltd basic m<strong>at</strong>erials 1 150 489 0.03% 0.03%<br />
sinopec shandong taishan Petroleum Co ltd oil & Gas 658 541 0.02% 0.02%<br />
sinopec shanghai Petrochemical Co ltd basic m<strong>at</strong>erials 1 321 303 0.00% 0.00%<br />
sinopharm Group Co ltd Health Care 358 160 302 1.04% 1.04%<br />
sino-Pl<strong>at</strong>inum metals Co ltd basic m<strong>at</strong>erials 636 407 0.03% 0.03%<br />
sinotech energy ltd oil & Gas 987 495 1.80% 3.59%<br />
sinotex investment & Development Consumer Goods 843 410 0.04% 0.04%<br />
sinotrans air transport<strong>at</strong>ion<br />
Development Co ltd industrials 440 088 0.01% 0.01%<br />
sinotrans ltd industrials 52 400 101 1.16% 1.16%<br />
sinotrans shipping ltd industrials 84 626 190 1.46% 1.46%<br />
sinotruk Hong Kong ltd industrials 11 261 987 0.12% 0.12%<br />
sound environmental Co ltd industrials 2 842 114 0.03% 0.03%<br />
south Huiton Co ltd industrials 661 430 0.03% 0.03%<br />
spearhead integr<strong>at</strong>ed marketing<br />
Communic<strong>at</strong>ion Co ltd Consumer services 12 744 0.00% 0.00%<br />
springland intern<strong>at</strong>ional <strong>Holding</strong>s ltd Consumer services 32 779 918 0.34% 0.34%<br />
star lake bioscience Co inc Zhaoqing<br />
Guangdong Consumer Goods 992 051 0.03% 0.03%<br />
sufa technology industry Co ltd CnnC industrials 1 <strong>31</strong>7 091 0.03% 0.03%<br />
sun art retail Group ltd Consumer services 130 505 287 0.18% 0.18%<br />
sunac China <strong>Holding</strong>s ltd Financials 37 114 308 1.00% 1.00%<br />
sundiro <strong>Holding</strong> Co ltd basic m<strong>at</strong>erials 1 283 843 0.04% 0.04%<br />
suning appliance Co ltd Consumer services 82 973 072 0.15% 0.15%<br />
sunny loan top Co ltd Consumer services 551 407 0.02% 0.02%<br />
sunsea telecommunic<strong>at</strong>ions Co ltd technology 12 710 052 0.33% 0.33%<br />
suntech Power <strong>Holding</strong>s Co ltd oil & Gas 1 978 375 0.08% 0.08%<br />
sunvim Group Co ltd Consumer Goods 777 307 0.02% 0.02%<br />
sunward intelligent equipment Co ltd industrials 1 142 548 0.03% 0.03%<br />
suzhou Gold mantis Construction<br />
Decor<strong>at</strong>ion Co ltd industrials 3 111 953 0.02% 0.02%<br />
suzhou new sea union telecom<br />
technology Co ltd technology 8 295 639 0.27% 0.27%<br />
sva electron Co ltd industrials 1 396 825 0.03% 0.03%<br />
taiyuan Coal Gasific<strong>at</strong>ion Co ltd basic m<strong>at</strong>erials 1 287 675 0.02% 0.02%<br />
taiyuan Heavy industry Co industrials 1 971 820 0.02% 0.02%<br />
tangshan Jidong Cement Co ltd industrials 5 620 074 0.03% 0.03%<br />
tangshan sanyou Chemical industries Co ltd basic m<strong>at</strong>erials 1 536 543 0.02% 0.02%<br />
tbea Co ltd industrials 5 746 148 0.03% 0.03%<br />
tCl Corp Consumer Goods 3 940 539 0.03% 0.03%<br />
tDG <strong>Holding</strong>s Co ltd industrials 963 417 0.02% 0.02%<br />
tellhow sci-tech Co ltd industrials 657 043 0.02% 0.02%<br />
telling telecommunic<strong>at</strong>ion <strong>Holding</strong> Co ltd technology 1 519 402 0.03% 0.03%<br />
tian Di science & technology Co ltd industrials 2 389 119 0.01% 0.01%<br />
tiancheng Co ltd <strong>of</strong> taiyuan university<br />
<strong>of</strong> technology technology 994 542 0.07% 0.07%<br />
tianjin benefo tejing electric Co ltd industrials 1 689 867 0.03% 0.03%<br />
tianjin Capital environmental Protection<br />
Group Co ltd utilities 8 291 890 0.36% 0.36%<br />
tianjin Faw Xiali automobile Co ltd Consumer Goods 648 389 0.01% 0.01%<br />
tianjin Good Hand railway <strong>Holding</strong> Co ltd industrials 332 336 0.01% 0.01%<br />
tianjin lisheng Pharmaceutical Co ltd Health Care 14 735 0.00% 0.00%<br />
tianjin Port Co ltd industrials 1 713 519 0.02% 0.02%<br />
tianjin Port Development <strong>Holding</strong>s ltd industrials 50 382 973 1.04% 1.04%<br />
tianjin saixiang technology Co ltd industrials 7 282 0.00% 0.00%<br />
tianjin tasly Pharmaceutical Co ltd Health Care 3 726 203 0.02% 0.02%<br />
tianjin teda Co ltd industrials 1 618 162 0.03% 0.03%<br />
tianjin tianyao Pharmaceutical Co ltd Health Care 466 124 0.02% 0.02%<br />
tianjin Zhong Xin Pharmaceutical Group<br />
Corp ltd Health Care 1 0<strong>31</strong> 322 0.02% 0.02%<br />
tianjin Zhonghuan semiconductor Joint-<br />
stock Co ltd technology 2 137 425 0.03% 0.03%<br />
tianjing <strong>Global</strong> magnetic industrials 356 182 0.02% 0.02%<br />
tianma microelectronics Co ltd industrials 1 337 617 0.04% 0.04%<br />
tianshui Hu<strong>at</strong>ian technology Co ltd technology 1 670 448 0.06% 0.06%<br />
tibet mineral Development Co basic m<strong>at</strong>erials 1 343 198 0.02% 0.02%<br />
tibet tianlu Co ltd industrials 926 6<strong>31</strong> 0.02% 0.02%<br />
voting<br />
ownership<br />
sector<br />
market value<br />
(noK)<br />
time Publishing and media Co ltd Consumer services 603 276 0.01% 0.01%<br />
tonghua Dongbao Pharmaceutical Co ltd Health Care 2 079 227 0.03% 0.03%<br />
tonghua Golden-Horse Pharmaceutical<br />
industry Co ltd Health Care 634 306 0.03% 0.03%<br />
tongling nonferrous metals Group Co ltd basic m<strong>at</strong>erials 3 730 296 0.02% 0.02%<br />
tongwei Co ltd Consumer Goods 646 796 0.02% 0.02%<br />
tonteC technology investment<br />
Group Co ltd industrials 938 558 0.02% 0.02%<br />
toP energy Co ltd-a utilities 1 704 901 0.02% 0.02%<br />
trauson <strong>Holding</strong>s Co ltd Health Care 8 681 090 0.83% 0.83%<br />
travelsky technology ltd technology 97 671 719 1.08% 1.08%<br />
trina solar ltd oil & Gas 143 898 499 0.09% 4.54%<br />
tri-tech <strong>Holding</strong> inc industrials 5 940 500 2.65% 2.65%<br />
tsinghua tongfang Co ltd technology 4 240 487 0.03% 0.03%<br />
tsinghua unisplendour Co ltd technology 571 063 0.02% 0.02%<br />
tsingtao brewery Co ltd Consumer Goods 96 647 983 0.22% 0.22%<br />
tuopai Yeast liquor Co ltd/sichuan Consumer Goods 1 258 327 0.02% 0.02%<br />
uFiDa s<strong>of</strong>tware Co ltd technology 3 657 437 0.03% 0.03%<br />
v v Food & beverage Co ltd Consumer Goods 936 843 0.02% 0.02%<br />
vtron technologies ltd industrials 1 792 028 0.03% 0.03%<br />
Wanxiang Qianchao Co ltd Consumer Goods 1 704 982 0.02% 0.02%<br />
Weichai Power Co ltd industrials 209 687 132 0.43% 0.43%<br />
Weifu High-technology Group Co ltd Consumer Goods 125 173 714 0.65% 0.65%<br />
Weihai Huadong autom<strong>at</strong>ion Co ltd industrials 973 745 0.03% 0.03%<br />
Western mining Co ltd basic m<strong>at</strong>erials 6 364 041 0.03% 0.03%<br />
Wintime energy Co ltd oil & Gas 2 043 286 0.03% 0.03%<br />
Wolong electric Group Co ltd industrials 1 002 709 0.03% 0.03%<br />
Wuhan Department store Group Co ltd Consumer services 2 200 176 0.03% 0.03%<br />
Wuhan Fingu electronic technology Co ltd technology 542 299 0.01% 0.01%<br />
Wuhan Guide infrared Co ltd industrials 1 618 407 0.03% 0.03%<br />
Wuhan Humanwell Healthcare Group Co ltd Health Care 4 514 950 0.05% 0.05%<br />
Wuhan iron & steel Co ltd basic m<strong>at</strong>erials 5 395 187 0.02% 0.02%<br />
Wuhan Kaidi electric Power Co ltd utilities 2 188 791 0.02% 0.02%<br />
Wuhan sanzhen industry <strong>Holding</strong> Co ltd utilities 736 975 0.03% 0.03%<br />
Wuhan Zhongyuan Huadian science &<br />
technology Co ltd industrials 9 861 0.00% 0.00%<br />
Wuhu Conch Pr<strong>of</strong>iles and science Co ltd industrials 455 961 0.02% 0.02%<br />
Wuhu Port storage & transport<strong>at</strong>ion Co ltd industrials 1 717 407 0.02% 0.02%<br />
Wuliangye Yibin Co ltd Consumer Goods 106 437 004 0.09% 0.09%<br />
Wuxi Commercial mansion Grand<br />
orient Co ltd Consumer services 997 870 0.03% 0.03%<br />
Wuxi Double elephant micro Fibre<br />
m<strong>at</strong>erial Co ltd Consumer Goods 8 192 0.00% 0.00%<br />
Wuxi Huaguang boiler Co ltd industrials 624 476 0.02% 0.02%<br />
Wuxi little swan Co ltd Consumer Goods 6 426 097 0.15% 0.15%<br />
WuXi Pharm<strong>at</strong>ech Cayman inc Health Care 21 758 907 0.06% 0.46%<br />
Wuxi taiji industry Co ltd basic m<strong>at</strong>erials 744 921 0.03% 0.03%<br />
XCmG Construction machinery Co ltd industrials 5 389 567 0.02% 0.02%<br />
Xi’ an aero-engine PlC industrials 2 744 150 0.02% 0.02%<br />
Xiamen C & D inc industrials 3 746 718 0.03% 0.03%<br />
Xiamen Far<strong>at</strong>ronic Co ltd industrials 1 504 416 0.04% 0.04%<br />
Xiamen intern<strong>at</strong>ional trade Group Corp ltd industrials 1 073 696 0.02% 0.02%<br />
Xiamen King long motor Co ltd Consumer Goods 580 604 0.02% 0.02%<br />
Xiamen Port Development Co ltd industrials 362 401 0.01% 0.01%<br />
Xiamen tungsten Co ltd basic m<strong>at</strong>erials 2 897 699 0.02% 0.02%<br />
Xiamen XGma machinery Co ltd industrials 693 173 0.01% 0.01%<br />
Xi’an aircraft intern<strong>at</strong>ional Corp industrials 3 450 765 0.02% 0.02%<br />
Xian Kaiyuan investment Group Co ltd Consumer services 2 005 085 0.06% 0.06%<br />
Xi’an shaangu Power Co ltd industrials 16 300 0.00% 0.00%<br />
Xiandai investment Co ltd industrials 1 460 026 0.03% 0.03%<br />
Xiangtan electric manufacturing Co ltd industrials 1 3<strong>31</strong> 465 0.03% 0.03%<br />
Xining special steel Co basic m<strong>at</strong>erials 898 630 0.02% 0.02%<br />
Xinjiang ba Yi iron & steel Co ltd basic m<strong>at</strong>erials 1 206 049 0.02% 0.02%<br />
Xinjiang Chalkis Co ltd Consumer Goods 399 966 0.02% 0.02%<br />
Xinjiang Dushanzi tianli High & new<br />
tech Co ltd basic m<strong>at</strong>erials 1 249 367 0.04% 0.04%<br />
Xinjiang Goldwind science &<br />
technology Co ltd oil & Gas 44 869 841 0.50% 0.50%<br />
Xinjiang Guannong Fruit & antler<br />
Group Co ltd Consumer Goods 1 436 266 0.02% 0.02%<br />
Xinjiang Hops Co ltd Consumer Goods 697 457 0.03% 0.03%<br />
Xinjiang intern<strong>at</strong>ional industry Co ltd basic m<strong>at</strong>erials 672 924 0.02% 0.02%<br />
Xinjiang Joinworld Co ltd basic m<strong>at</strong>erials 870 638 0.02% 0.02%<br />
Xinjiang Qingsong building m<strong>at</strong>erials and<br />
Chemicals Group Co ltd industrials 1 446 090 0.03% 0.03%<br />
Xinjiang talimu agriculture<br />
Development Co ltd Consumer Goods 1 001 850 0.05% 0.05%<br />
Xinjiang tianfu thermoelectric Co ltd utilities 1 697 082 0.03% 0.03%<br />
Xinjiang tianshan Cement Co ltd industrials 2 962 398 0.03% 0.03%<br />
Xinjiang tianye Co basic m<strong>at</strong>erials 722 648 0.02% 0.02%<br />
Xinjiang urban Construction Co ltd industrials 1 123 255 0.03% 0.03%<br />
Xinjiang Yilite industry Co ltd Consumer Goods 1 375 826 0.04% 0.04%<br />
Xinjiang Zhongtai Chemical Group Co ltd basic m<strong>at</strong>erials 1 796 627 0.02% 0.02%<br />
Xinxiang Chemical Fiber Co ltd basic m<strong>at</strong>erials 687 854 0.03% 0.03%<br />
Xinxing Ductile iron Pipes basic m<strong>at</strong>erials 3 038 225 0.03% 0.03%<br />
Xinyu iron & steel Co ltd basic m<strong>at</strong>erials 923 445 0.01% 0.01%<br />
Xishui strong Year Co ltd inner mongolia industrials 516 062 0.02% 0.02%<br />
Xiwang sugar <strong>Holding</strong>s Co ltd Consumer Goods 35 664 432 3.97% 3.97%<br />
XJ electric Co ltd industrials 1 678 806 0.02% 0.02%<br />
Yabao Pharmaceutical Group Co ltd Health Care 1 537 011 0.04% 0.04%<br />
Yangquan Coal industry Group Co ltd basic m<strong>at</strong>erials 6 765 177 0.02% 0.02%<br />
Country associ<strong>at</strong>ion according to Ftse (the benchmark provider for <strong>equities</strong>). if a company is not in the benchmark, the country <strong>of</strong> incorpor<strong>at</strong>ion is listed. sector classific<strong>at</strong>ion according to iCb (the industry Classific<strong>at</strong>ion<br />
benchmark company).<br />
voting<br />
ownership<br />
HOLdiNgs<br />
10<br />
<strong>Government</strong> <strong>Pension</strong> FunD <strong>Global</strong> ANNUAL REPORT 2011
<strong>Government</strong> <strong>Pension</strong> <strong>Fund</strong> <strong>Global</strong> <strong>Holding</strong> <strong>of</strong> <strong>equities</strong> <strong>at</strong> <strong>31</strong> December 2011<br />
sector<br />
market value<br />
(noK)<br />
Yantai Changyu Pioneer Wine Co ltd Consumer Goods 290 017 457 0.82% 0.82%<br />
Yantai Jereh oilfield services Group Co ltd oil & Gas 3 0<strong>31</strong> 954 0.02% 0.02%<br />
Yantai north andre Juice Co Consumer Goods 21 619 430 2.89% 2.89%<br />
Yantai tayho advanced m<strong>at</strong>erials Co ltd basic m<strong>at</strong>erials 1 475 489 0.03% 0.03%<br />
Yantai Wanhua Polyurethanes Co ltd basic m<strong>at</strong>erials 6 218 016 0.02% 0.02%<br />
Yantai Xinchao industry Co industrials 527 387 0.02% 0.02%<br />
Yanzhou Coal mining Co ltd basic m<strong>at</strong>erials 199 057 766 0.32% 0.32%<br />
YGsoFt inc technology 2 0<strong>31</strong> 871 0.04% 0.04%<br />
Yibin tianyuan Group Co ltd basic m<strong>at</strong>erials 1 165 812 0.03% 0.03%<br />
Yinchuan Xinhua Department store Co ltd Consumer services 1 113 106 0.02% 0.02%<br />
Yingkou Port liability Co ltd industrials 548 772 0.01% 0.01%<br />
Yingli Green energy <strong>Holding</strong> Co ltd oil & Gas 64 658 230 1.81% 1.81%<br />
YlZ inform<strong>at</strong>ion technology Co ltd technology 11 126 248 0.52% 0.52%<br />
Youngor Group Co ltd Consumer Goods 6 530 944 0.03% 0.03%<br />
Yuan longping High-tech agriculture Co ltd Consumer Goods 1 927 980 0.03% 0.03%<br />
Yuanda China <strong>Holding</strong>s ltd industrials 59 359 841 1.21% 1.21%<br />
Yuexiu Property Co ltd Financials 11 188 081 0.14% 0.14%<br />
Yueyang Forest & Paper Co ltd basic m<strong>at</strong>erials 1 128 960 0.03% 0.03%<br />
Yueyang Xingchang Petrochemical basic m<strong>at</strong>erials 328 241 0.01% 0.01%<br />
Yunnan aluminium Co ltd basic m<strong>at</strong>erials 1 145 615 0.02% 0.02%<br />
Yunnan baiyao Group Co ltd Health Care 16 575 015 0.05% 0.05%<br />
Yunnan Chihong Zinc & Germanium Co ltd basic m<strong>at</strong>erials 5 394 073 0.03% 0.03%<br />
Yunnan Copper industry Co basic m<strong>at</strong>erials 4 482 195 0.02% 0.02%<br />
Yunnan Green-land biological<br />
technology Co ltd basic m<strong>at</strong>erials 754 701 0.05% 0.05%<br />
Yunnan salt & Chemical industry Co ltd basic m<strong>at</strong>erials 419 372 0.03% 0.03%<br />
Yunnan tin Co ltd basic m<strong>at</strong>erials 2 493 946 0.02% 0.02%<br />
Yunnan Wenshan electric Power Co ltd utilities 1 154 967 0.04% 0.04%<br />
Yunnan Yuntianhua Co ltd basic m<strong>at</strong>erials 1 233 141 0.01% 0.01%<br />
Yunnan Yunwei Co ltd basic m<strong>at</strong>erials 344 539 0.01% 0.01%<br />
Zhangzhou Pientzehuang<br />
Pharmaceutical Co ltd Health Care 2 080 859 0.02% 0.02%<br />
Zhaojin mining industry Co ltd basic m<strong>at</strong>erials 630 471 893 2.28% 2.28%<br />
Zhe Jiang Kangsheng Co ltd basic m<strong>at</strong>erials 4 665 0.00% 0.00%<br />
Zhejiang aishida electric Co ltd Consumer Goods 4 191 0.00% 0.00%<br />
Zhejiang baoxiniao Garment Co ltd Consumer Goods 2 222 450 0.03% 0.03%<br />
Zhejiang China Commodities City<br />
Group Co ltd Consumer services 3 550 413 0.02% 0.02%<br />
Zhejiang China light & textile industrial<br />
City Group Co ltd Consumer services 697 994 0.02% 0.02%<br />
Zhejiang Chint electrics Co ltd industrials 12 421 0.00% 0.00%<br />
Zhejiang Conba Pharmaceutical Co ltd Health Care 2 036 452 0.04% 0.04%<br />
Zhejiang Dahua technology Co ltd industrials 3 367 106 0.03% 0.03%<br />
Zhejiang Dun’an artificial environment Co ltd industrials 1 817 393 0.03% 0.03%<br />
Zhejiang enjoyor electronics Co ltd technology 22 682 473 0.85% 0.85%<br />
Zhejiang Fuchunjiang Hydropower<br />
equipment Co ltd oil & Gas 21 709 448 0.45% 0.45%<br />
Zhejiang Guyuelongshan shaoxing<br />
Wine Co ltd Consumer Goods 2 008 636 0.03% 0.03%<br />
Zhejiang Hailiang Co ltd basic m<strong>at</strong>erials 803 938 0.02% 0.02%<br />
Zhejiang Hailide new m<strong>at</strong>erial Co ltd basic m<strong>at</strong>erials 1 491 238 0.04% 0.04%<br />
Zhejiang Haiyue Co ltd oil & Gas 1 059 015 0.03% 0.03%<br />
Zhejiang Hangxiao steel structure Co ltd industrials 666 899 0.03% 0.03%<br />
Zhejiang Hangzhou Xinfu<br />
Pharmaceutical Co ltd basic m<strong>at</strong>erials 504 576 0.03% 0.03%<br />
Zhejiang Hisun Pharmaceutical Co ltd Health Care 3 151 113 0.02% 0.02%<br />
Zhejiang Huafeng spandex Co ltd basic m<strong>at</strong>erials 783 685 0.02% 0.02%<br />
Zhejiang Huahai Pharmaceutical Co ltd Health Care 21 347 322 0.38% 0.38%<br />
ZheJiang Jiaxin silk Corp ltd Consumer Goods 12 142 0.00% 0.00%<br />
Zhejiang JinliHua electric Co ltd industrials 8 228 0.00% 0.00%<br />
Zhejiang Juhua Co basic m<strong>at</strong>erials 2 087 902 0.01% 0.01%<br />
Zhejiang longsheng Group Co ltd basic m<strong>at</strong>erials 2 186 287 0.03% 0.03%<br />
Zhejiang m<strong>at</strong>erial industrial Zhongda<br />
Yuantong Group Co ltd Consumer Goods 1 268 960 0.03% 0.03%<br />
Zhejiang medicine Co ltd Health Care 2 185 8<strong>31</strong> 0.03% 0.03%<br />
Zhejiang narada Power source Co ltd industrials 7 720 0.00% 0.00%<br />
Zhejiang nHu Co ltd Consumer Goods 1 766 659 0.01% 0.01%<br />
Zhejiang orient <strong>Holding</strong>s Co Consumer Goods 745 023 0.02% 0.02%<br />
Zhejiang runtu Co ltd basic m<strong>at</strong>erials 1 698 085 0.03% 0.03%<br />
Zhejiang shenghua biok biology Co ltd basic m<strong>at</strong>erials 721 5<strong>31</strong> 0.02% 0.02%<br />
Zhejiang supor Cookware Co ltd Consumer Goods 13 058 301 0.14% 0.14%<br />
Zhejiang tianma bearing Co ltd industrials 1 643 604 0.02% 0.02%<br />
Zhejiang Wanliyang transmission Co ltd Consumer Goods 15 835 0.00% 0.00%<br />
Zhejiang Wanma Cable Co ltd industrials 1 250 112 0.04% 0.04%<br />
Zhejiang Weixing industrial<br />
Development Co ltd Consumer Goods 1 416 938 0.05% 0.05%<br />
Zhejiang Weixing new building<br />
m<strong>at</strong>erials Co ltd industrials 7 372 0.00% 0.00%<br />
Zhejiang Xinan Chemical industrial<br />
Group Co ltd basic m<strong>at</strong>erials 995 098 0.02% 0.02%<br />
Zhejiang Yankon Group Co ltd Consumer Goods 1 242 461 0.02% 0.02%<br />
Zhejiang Yasha Decor<strong>at</strong>ion Co ltd industrials 1 429 549 0.02% 0.02%<br />
Zhengzhou Coal industry & electric<br />
Power Co ltd basic m<strong>at</strong>erials 1 074 515 0.02% 0.02%<br />
Zhengzhou Coal mining machinery<br />
Group Co ltd industrials 1 825 220 0.01% 0.01%<br />
Zhengzhou Yutong bus Co ltd Consumer Goods 35 629 872 0.<strong>31</strong>% 0.<strong>31</strong>%<br />
Zhong an real est<strong>at</strong>e ltd Financials 75 342 814 3.90% 3.90%<br />
Zhongbai <strong>Holding</strong>s Group Co ltd Consumer services 1 616 017 0.03% 0.03%<br />
Zhongchu Development stock Co ltd industrials 1 333 350 0.02% 0.02%<br />
Zhongjin Gold Co ltd basic m<strong>at</strong>erials 6 001 642 0.02% 0.02%<br />
voting<br />
ownership<br />
sector<br />
market value<br />
(noK)<br />
Zhongshan broad ocean motor Co ltd industrials 1 396 518 0.02% 0.02%<br />
Zhongshan Public utilities Group Co ltd utilities 1 023 643 0.01% 0.01%<br />
Zhongyuan environment-Protection Co ltd utilities 783 941 0.03% 0.03%<br />
Zhuhai Port Co ltd industrials 726 453 0.03% 0.03%<br />
Zhuhai Zhongfu enterprise Co ltd industrials 1 4<strong>31</strong> 446 0.03% 0.03%<br />
Zhuzhou Csr times electric Co ltd industrials 24 273 464 0.17% 0.17%<br />
Zhuzhou Qianjin Pharmaceutical Co ltd Health Care 541 808 0.02% 0.02%<br />
Zhuzhou smelter Group Co ltd basic m<strong>at</strong>erials 710 447 0.02% 0.02%<br />
Zhuzhou times new m<strong>at</strong>erial<br />
technology Co ltd basic m<strong>at</strong>erials 1 583 879 0.03% 0.03%<br />
Zibo Qixiang tengda Chemical Co ltd basic m<strong>at</strong>erials 2 089 <strong>31</strong>4 0.03% 0.03%<br />
Zijin mining Group Co ltd basic m<strong>at</strong>erials 252 199 271 0.50% 0.50%<br />
Zoomlion Heavy industry science and<br />
technology Co ltd industrials 89 407 602 0.18% 0.18%<br />
Zte Corp technology 350 811 099 0.55% 0.55%<br />
COLOmBiA<br />
almacenes exito sa Consumer services 43 903 705 0.13% 0.13%<br />
banco Davivienda sa Financials 54 369 588 0.00% 0.21%<br />
banColombia sa Financials 106 475 255 0.06% 0.16%<br />
Cementos argos sa industrials 43 941 624 0.11% 0.11%<br />
Corp Financiera Colombiana sa Financials 9 070 842 0.05% 0.05%<br />
ecopetrol sa oil & Gas 89 641 676 0.02% 0.02%<br />
interconexion electrica sa esP utilities 5 889 149 0.02% 0.02%<br />
inversiones argos sa industrials 14 386 292 0.04% 0.04%<br />
CyPRUs<br />
<strong>Global</strong>trans investment PlC industrials 43 932 340 0.34% 0.34%<br />
mriya agro <strong>Holding</strong> PlC Consumer Goods 66 256 188 1.76% 1.76%<br />
ocean rig uDW inc oil & Gas 1 398 588 0.01% 0.01%<br />
CzECH REPUBLiC<br />
CeZ as utilities 498 214 060 0.39% 0.39%<br />
Komercni banka as Financials 308 471 589 0.80% 0.80%<br />
telefonica Czech republic as telecommunic<strong>at</strong>ions 51 427 079 0.14% 0.14%<br />
unipetrol as oil & Gas 44 822 483 0.48% 0.48%<br />
dENmARk<br />
alK-abello a/s Health Care 49 572 583 0.80% 1.46%<br />
alm brand a/s Financials 141 464 0.01% 0.01%<br />
aP moeller - maersk a/s industrials 1 946 442 533 1.12% 1.15%<br />
auriga industries basic m<strong>at</strong>erials 14 114 897 0.20% 0.71%<br />
bang & olufsen a/s Consumer Goods 32 583 009 1.23% 1.55%<br />
bavarian nordic a/s Health Care 13 217 356 1.28% 1.28%<br />
Carlsberg a/s Consumer Goods 1 394 619 995 0.72% 2.17%<br />
Chr Hansen <strong>Holding</strong> a/s Consumer Goods 21 481 743 0.12% 0.12%<br />
Coloplast a/s Health Care 579 121 556 0.87% 1.49%<br />
D/s norden industrials 27 811 448 0.46% 0.46%<br />
Danske bank a/s Financials 2 191 420 377 3.09% 3.09%<br />
Dsv a/s industrials 469 946 281 2.30% 2.30%<br />
east asi<strong>at</strong>ic Co ltd a/s Consumer Goods 34 144 840 2.24% 2.24%<br />
Flsmidth & Co a/s industrials 406 905 202 2.17% 2.17%<br />
Genmab a/s Health Care 22 390 814 1.27% 1.27%<br />
Gn store nord a/s Health Care 240 390 750 2.29% 2.29%<br />
Gronlandsbanken Financials 6 911 678 1.25% 1.25%<br />
H lundbeck a/s Health Care 149 377 015 0.68% 0.68%<br />
iC Companys a/s Consumer Goods 12 242 524 0.68% 0.68%<br />
Jyske bank a/s Financials 209 497 282 2.20% 2.20%<br />
nKt <strong>Holding</strong> a/s industrials 82 127 274 1.74% 1.74%<br />
novo nordisk a/s Health Care 7 848 213 275 0.74% 1.97%<br />
novozymes a/s Health Care 1 149 244 624 1.64% 2.20%<br />
Pandora a/s Consumer Goods 99 421 797 1.36% 1.36%<br />
rockwool intern<strong>at</strong>ional a/s industrials 90 145 561 0.15% 0.85%<br />
roskilde bank Financials 12 0.90% 0.90%<br />
schouw & Co industrials 14 397 745 0.59% 0.59%<br />
simCorp a/s technology 77 335 285 1.84% 1.84%<br />
solar a/s industrials 347 871 0.01% 0.02%<br />
spar nord bank a/s Financials 19 012 883 1.00% 1.00%<br />
sydbank a/s Financials 155 780 239 2.23% 2.23%<br />
topdanmark a/s Financials 45 912 912 0.33% 0.33%<br />
torm a/s industrials 3 806 576 1.34% 1.34%<br />
tryg a/s Financials 191 834 029 0.94% 0.94%<br />
vestas Wind systems a/s oil & Gas 451 687 754 3.43% 3.43%<br />
William Demant <strong>Holding</strong> a/s Health Care 248 848 467 0.86% 0.86%<br />
EgyPT<br />
alexandria mineral oils Co oil & Gas 6 163 130 0.11% 0.11%<br />
amer Group <strong>Holding</strong> Financials 7 268 354 0.43% 0.43%<br />
arab Cotton Ginning Consumer Goods 13 604 827 2.38% 2.38%<br />
asek Co for mining basic m<strong>at</strong>erials 1 326 646 0.50% 0.50%<br />
Canal shipping agencies Co industrials 6 570 683 0.59% 0.59%<br />
Commercial intern<strong>at</strong>ional bank egypt sae Financials 111 866 852 1.01% 1.01%<br />
Delta sugar Co Consumer Goods 5 923 235 0.25% 0.25%<br />
egyptian Co for mobile services telecommunic<strong>at</strong>ions 17 730 500 0.23% 0.23%<br />
egyptian Financial & industrial Co basic m<strong>at</strong>erials 9 013 426 1.49% 1.49%<br />
egyptian iron & steel Co basic m<strong>at</strong>erials 4 858 797 0.26% 0.26%<br />
egyptian Kuwaiti <strong>Holding</strong> Co sae Financials 37 979 2<strong>31</strong> 0.78% 0.78%<br />
egyptian media Production City Consumer services 1 254 440 0.27% 0.27%<br />
egyptian resorts Co Consumer services 5 803 656 0.66% 0.66%<br />
elswedy electric Co industrials 15 829 476 0.35% 0.35%<br />
Ghabbour auto Consumer Goods 7 130 142 0.28% 0.28%<br />
Heliopolis Housing Financials 3 868 621 0.32% 0.32%<br />
Housing & Development bank Financials 5 971 828 0.48% 0.48%<br />
maridive & oil services sae oil & Gas 4 304 105 0.16% 0.16%<br />
medinet nasr Housing Financials 3 744 555 0.33% 0.33%<br />
naeem <strong>Holding</strong> Financials 1 101 776 0.25% 0.25%<br />
Country associ<strong>at</strong>ion according to Ftse (the benchmark provider for <strong>equities</strong>). if a company is not in the benchmark, the country <strong>of</strong> incorpor<strong>at</strong>ion is listed. sector classific<strong>at</strong>ion according to iCb (the industry Classific<strong>at</strong>ion<br />
benchmark company).<br />
voting<br />
ownership<br />
HOLdiNgs<br />
11<br />
<strong>Government</strong> <strong>Pension</strong> FunD <strong>Global</strong> ANNUAL REPORT 2011
<strong>Government</strong> <strong>Pension</strong> <strong>Fund</strong> <strong>Global</strong> <strong>Holding</strong> <strong>of</strong> <strong>equities</strong> <strong>at</strong> <strong>31</strong> December 2011<br />
sector<br />
market value<br />
(noK)<br />
n<strong>at</strong>ional Development bank/egypt Financials 2 034 205 0.30% 0.30%<br />
n<strong>at</strong>ional societe Generale bank sae Financials 12 062 369 0.15% 0.15%<br />
nile Cotton Ginning Consumer Goods 2 158 338 0.63% 0.63%<br />
olympic Group Financial investments Consumer Goods 8 101 421 0.34% 0.34%<br />
orascom Construction industries industrials 203 569 013 0.48% 0.48%<br />
orascom telecom <strong>Holding</strong> sae telecommunic<strong>at</strong>ions 112 626 509 0.32% 0.67%<br />
oriental Weavers Consumer Goods 9 948 572 0.37% 0.37%<br />
sidi Kerir Petrochemcials Co basic m<strong>at</strong>erials 13 500 139 0.21% 0.21%<br />
south valley Cement industrials 10 084 262 0.68% 0.68%<br />
tala<strong>at</strong> moustafa Group Financials 60 476 390 1.00% 1.00%<br />
telecom egypt Co telecommunic<strong>at</strong>ions 44 295 875 0.20% 0.20%<br />
FAEROE isLANds<br />
banknordik P/F Financials 8 887 355 1.07% 1.07%<br />
FiNLANd<br />
ahlstrom oYJ basic m<strong>at</strong>erials 411 478 0.01% 0.01%<br />
amer sports oYJ Consumer Goods 192 165 352 2.27% 2.27%<br />
Cargotec oyj industrials 169 779 933 0.64% 1.48%<br />
Citycon oYJ Financials 96 784 744 1.95% 1.95%<br />
Cramo oYJ industrials 46 793 327 1.84% 1.84%<br />
elisa oYJ telecommunic<strong>at</strong>ions 202 788 348 0.98% 0.98%<br />
Finnair oYJ Consumer services 14 336 204 0.63% 0.63%<br />
Finnlines oYJ industrials 84 789 210 3.04% 3.04%<br />
Fortum oYJ utilities 651 425 619 0.57% 0.57%<br />
F-secure oYJ technology 22 768 534 0.92% 0.92%<br />
HKscan oYJ Consumer Goods 29 557 001 0.43% 1.23%<br />
Huhtamaki oYJ industrials 175 169 474 2.33% 2.33%<br />
Kemira oYJ basic m<strong>at</strong>erials 36 242 123 0.33% 0.33%<br />
Kesko oYJ Consumer services 291 327 402 0.38% 1.47%<br />
Kone oYJ industrials 1 119 004 582 0.60% 1.38%<br />
Konecranes oYJ industrials 165 391 200 2.32% 2.32%<br />
lassila & tikanoja oYJ industrials 981 228 0.03% 0.03%<br />
lemminkainen oYJ industrials 20 258 570 0.71% 0.71%<br />
metso oYJ industrials 720 659 224 2.16% 2.16%<br />
m-real oYJ basic m<strong>at</strong>erials 53 930 435 0.51% 1.59%<br />
neste oil oYJ oil & Gas 160 771 219 1.04% 1.04%<br />
nokia oYJ technology 2 214 602 079 2.02% 2.02%<br />
nokian renka<strong>at</strong> oYJ Consumer Goods 537 951 340 2.15% 2.15%<br />
oriola-KD oYJ Health Care 23 569 259 0.17% 1.17%<br />
orion oYJ Health Care 244 034 144 0.21% 1.48%<br />
outokumpu oYJ basic m<strong>at</strong>erials 125 495 566 1.74% 1.74%<br />
outotec oYJ industrials 289 122 614 2.24% 2.24%<br />
Pohjola bank PlC Financials 233 684 363 0.68% 1.26%<br />
Poyry oYJ industrials 35 091 113 1.40% 1.40%<br />
raisio PlC Consumer Goods 453 643 0.00% 0.01%<br />
ramirent oYJ industrials 83 029 651 1.79% 1.79%<br />
rautaruukki oYJ basic m<strong>at</strong>erials 136 170 244 1.76% 1.76%<br />
ruukki Group oYJ basic m<strong>at</strong>erials 22 <strong>31</strong>5 703 1.30% 1.30%<br />
sampo oYJ Financials 1 081 362 363 1.29% 1.30%<br />
sanoma oYJ Consumer services 1 666 858 0.01% 0.01%<br />
sponda oYJ Financials 176 427 236 2.58% 2.58%<br />
stockmann oYJ abp Consumer services 64 629 023 0.20% 0.97%<br />
stora enso oYJ basic m<strong>at</strong>erials 2 219 501 113 2.60% 7.84%<br />
tieto oYJ technology 138 035 053 2.25% 2.25%<br />
tikkurila oyj industrials 77 713 593 1.76% 1.76%<br />
uPm-Kymmene oYJ basic m<strong>at</strong>erials 2 633 081 922 7.61% 7.61%<br />
uponor oYJ industrials 81 624 161 2.10% 2.10%<br />
Wartsila oYJ abp industrials 736 575 455 2.16% 2.16%<br />
Yit oYJ industrials 276 950 <strong>31</strong>6 2.27% 2.27%<br />
FRANCE<br />
accor sa Consumer services 748 576 899 1.89% 2.17%<br />
aeroports de Paris industrials 263 507 195 0.65% 0.65%<br />
air France-Klm Consumer services 110 855 771 1.20% 1.20%<br />
air liquide sa basic m<strong>at</strong>erials 3 533 232 405 1.68% 1.68%<br />
alc<strong>at</strong>el-lucent/France technology 455 086 375 2.06% 2.09%<br />
alstom sa industrials 1 164 589 005 2.18% 2.18%<br />
alten ltd technology 83 168 835 1.83% 1.83%<br />
altran technologies sa technology 79 774 518 2.44% 2.54%<br />
april Financials 29 633 044 0.80% 0.80%<br />
arkema sa basic m<strong>at</strong>erials 891 701 812 3.08% 3.40%<br />
assystem industrials 22 876 813 1.24% 1.24%<br />
<strong>at</strong>os technology 354 280 683 1.61% 1.61%<br />
aXa sa Financials 3 463 174 548 1.52% 1.89%<br />
axway s<strong>of</strong>tware sa technology 11 087 623 0.43% 0.43%<br />
beneteau sa Consumer Goods 50 593 791 0.97% 0.97%<br />
biomerieux Health Care 185 082 233 0.66% 1.10%<br />
bnP Paribas sa Financials 6 052 600 493 2.13% 2.13%<br />
boiron sa Health Care 14 172 649 0.25% 0.43%<br />
bollore industrials 95 032 189 0.32% 0.32%<br />
bonduelle s.C.a. Consumer Goods 34 505 480 0.57% 0.89%<br />
bourbon sa oil & Gas 297 706 184 2.77% 2.66%<br />
boursorama Financials 7 517 011 0.20% 0.20%<br />
bouygues sa industrials 762 744 410 0.92% 1.28%<br />
bull technology 57 773 464 2.16% 2.16%<br />
bureau veritas sa industrials 558 588 890 0.75% 1.16%<br />
Cap Gemini sa technology 627 427 239 2.15% 2.15%<br />
Carrefour sa Consumer services 1 886 287 123 1.76% 2.03%<br />
Casino Guichard Perrachon sa Consumer services 488 012 <strong>31</strong>3 0.88% 0.88%<br />
Cegedim sa technology 13 170 400 0.53% 0.71%<br />
CFao sa industrials 238 801 337 1.91% 1.91%<br />
Christian Dior sa Consumer Goods 2 153 770 376 1.00% 1.67%<br />
Cie de st-Gobain industrials 2 656 934 155 1.69% 2.16%<br />
voting<br />
ownership<br />
sector<br />
market value<br />
(noK)<br />
Cie Generale de Geophysique - veritas oil & Gas 497 417 292 2.23% 2.33%<br />
Cie Generale des etablissements michelin Consumer Goods 1 064 249 580 1.<strong>31</strong>% 1.67%<br />
Cie Generale d’optique essilor<br />
intern<strong>at</strong>ional sa Health Care 1 960 657 185 2.02% 2.17%<br />
Ciments Francais sa industrials 109 899 373 0.36% 0.66%<br />
Club mediterranee Consumer services 68 550 565 2.16% 2.22%<br />
CnP assurances Financials 98 558 <strong>31</strong>4 0.22% 0.22%<br />
Credit agricole sa Financials 592 323 828 0.70% 0.70%<br />
Danone Consumer Goods 5 993 245 048 2.<strong>31</strong>% 2.48%<br />
Dassault systemes sa technology 634 370 576 0.80% 1.07%<br />
Derichebourg sa industrials 59 688 563 1.34% 1.96%<br />
edenred industrials 720 334 526 2.16% 2.16%<br />
eDF sa utilities 3 852 171 374 1.43% 1.43%<br />
eiffage sa industrials 167 722 903 1.33% 1.33%<br />
eramet basic m<strong>at</strong>erials 101 217 691 0.<strong>31</strong>% 0.52%<br />
esso sa Francaise oil & Gas 18 588 072 0.28% 0.28%<br />
etablissements maurel et Prom oil & Gas 199 999 403 1.66% 1.81%<br />
etam Developpement sa Consumer services 2 718 865 0.29% 0.42%<br />
euler Hermes sa Financials 91 276 475 0.57% 0.57%<br />
eurazeo Financials 177 237 367 1.05% 1.32%<br />
euro Disney sCa Consumer services 214 138 0.02% 0.02%<br />
eur<strong>of</strong>ins scientific Health Care 84 798 745 0.92% 1.35%<br />
eutels<strong>at</strong> Communic<strong>at</strong>ions sa Consumer services 818 178 614 1.59% 1.59%<br />
exel industries industrials 17 840 121 0.61% 1.07%<br />
Faiveley transport industrials 68 875 203 0.82% 1.28%<br />
Faurecia Consumer Goods 211 062 666 1.07% 1.68%<br />
FFP Financials 20 991 525 0.19% 0.35%<br />
Fonciere Des regions Financials 237 406 326 1.12% 1.12%<br />
France telecom sa telecommunic<strong>at</strong>ions 2 922 537 158 1.17% 1.17%<br />
Gamel<strong>of</strong>t sa Consumer Goods 55 830 341 1.72% 1.96%<br />
GDF suez utilities 6 774 772 633 1.84% 1.84%<br />
Gecina sa Financials 212 780 716 0.67% 0.67%<br />
Gemalto nv industrials 562 942 495 2.20% 2.20%<br />
GFi inform<strong>at</strong>ique technology 7 581 971 0.79% 0.79%<br />
Gl events industrials 8 529 380 0.27% 0.44%<br />
Groupe eurotunnel sa industrials 1 161 942 622 4.44% 5.09%<br />
Groupe steria sCa technology 106 721 999 2.85% 3.40%<br />
Guerbet Health Care 17 193 322 0.70% 1.15%<br />
Haulotte Group sa industrials 22 583 829 1.99% 1.99%<br />
Havas sa Consumer services 174 164 349 1.64% 1.64%<br />
Hermes intern<strong>at</strong>ional Consumer Goods 1 416 292 851 0.54% 0.75%<br />
HighCo Consumer services 6 566 607 1.43% 1.45%<br />
iCaDe Financials 229 068 800 0.94% 0.94%<br />
iliad sa technology 352 133 053 0.80% 0.87%<br />
imerys sa basic m<strong>at</strong>erials 198 050 824 0.73% 0.96%<br />
ingenico industrials 136 718 456 1.22% 1.22%<br />
ipsen sa Health Care 88 617 854 0.33% 0.56%<br />
iPsos Consumer services 129 377 256 1.37% 1.68%<br />
Jacquet metal service basic m<strong>at</strong>erials 15 497 118 0.88% 1.04%<br />
JCDecaux sa Consumer services 58 4<strong>31</strong> 484 0.19% 0.19%<br />
Klepierre Financials 359 105 949 0.98% 1.11%<br />
lafarge sa industrials 950 195 <strong>31</strong>2 1.13% 1.57%<br />
lagardere sCa Consumer services 268 197 606 1.03% 1.29%<br />
laurent-Perrier Consumer Goods 14 783 033 0.27% 0.44%<br />
lectra technology 15 181 598 1.45% 1.47%<br />
legrand sa industrials 1 099 868 263 1.88% 2.17%<br />
l’oreal sa Consumer Goods 3 717 689 432 0.99% 0.99%<br />
lvmH moet Hennessy louis vuitton sa Consumer Goods 5 752 878 689 0.93% 1.34%<br />
maisons France Confort Consumer Goods 4 088 079 0.40% 0.40%<br />
manitou bF sa industrials 32 456 116 0.90% 0.90%<br />
manutan intern<strong>at</strong>ional industrials 10 369 598 0.52% 0.52%<br />
maurel & Prom nigeria oil & Gas 40 496 183 2.32% 2.32%<br />
medica sa Health Care 25 415 789 0.53% 0.53%<br />
mercialys sa Financials 189 763 234 1.07% 1.07%<br />
mersen industrials 77 429 975 2.12% 2.11%<br />
metropole television sa Consumer services 152 124 406 1.35% 1.35%<br />
n<strong>at</strong>ixis Financials 190 487 187 0.41% 0.41%<br />
neopost sa technology 304 661 376 2.29% 2.29%<br />
nexans sa industrials 337 838 325 3.79% 3.79%<br />
nexity sa Financials 109 475 635 1.54% 1.54%<br />
nextradiotv Consumer services 14 477 601 0.72% 1.00%<br />
norbert Dentressangle sa industrials 33 468 <strong>31</strong>1 0.49% 0.81%<br />
nrJ Group Consumer services 13 900 259 0.18% 0.32%<br />
orpea Health Care 181 605 022 1.37% 1.76%<br />
PagesJaunes Groupe Consumer services 14 204 073 0.23% 0.23%<br />
Parrot sa technology 17 179 020 0.99% 0.99%<br />
Pernod-ricard sa Consumer Goods 3 946 821 338 2.45% 2.68%<br />
Peugeot sa Consumer Goods 360 912 601 1.25% 1.64%<br />
Pierre & vacances Consumer services 19 729 278 1.13% 1.13%<br />
Plastic omnium sa Consumer Goods 80 728 304 0.82% 1.29%<br />
PPr Consumer services 1 761 944 930 1.20% 1.62%<br />
Publicis Groupe sa Consumer services 562 554 805 0.84% 1.06%<br />
rallye sa Consumer services 118 988 642 1.00% 1.53%<br />
recylex sa basic m<strong>at</strong>erials 7 978 706 1.43% 1.43%<br />
remy Cointreau sa Consumer Goods 203 637 587 0.55% 0.85%<br />
renault sa Consumer Goods 2 <strong>31</strong>0 304 892 3.76% 3.76%<br />
rexel sa industrials 198 998 424 0.72% 0.72%<br />
rubis utilities 213 853 705 2.25% 2.25%<br />
sa des Ciments vic<strong>at</strong> industrials 104 183 566 0.41% 0.68%<br />
saft Groupe sa industrials 107 457 747 2.52% 2.52%<br />
san<strong>of</strong>i Health Care 12 840 373 309 1.97% 2.24%<br />
Country associ<strong>at</strong>ion according to Ftse (the benchmark provider for <strong>equities</strong>). if a company is not in the benchmark, the country <strong>of</strong> incorpor<strong>at</strong>ion is listed. sector classific<strong>at</strong>ion according to iCb (the industry Classific<strong>at</strong>ion<br />
benchmark company).<br />
voting<br />
ownership<br />
HOLdiNgs<br />
12<br />
<strong>Government</strong> <strong>Pension</strong> FunD <strong>Global</strong> ANNUAL REPORT 2011
<strong>Government</strong> <strong>Pension</strong> <strong>Fund</strong> <strong>Global</strong> <strong>Holding</strong> <strong>of</strong> <strong>equities</strong> <strong>at</strong> <strong>31</strong> December 2011<br />
sector<br />
market value<br />
(noK)<br />
schneider electric sa industrials 3 940 422 566 2.14% 2.28%<br />
sCor se Financials 491 253 385 1.83% 1.83%<br />
seb sa Consumer Goods 282 877 098 0.85% 1.26%<br />
seche environnement sa industrials 12 277 938 0.45% 0.64%<br />
sechilienne-sidec utilities 41 504 779 1.72% 1.72%<br />
sequana sa basic m<strong>at</strong>erials 12 740 448 0.77% 0.77%<br />
ses sa Consumer services 713 164 294 0.99% 0.99%<br />
societe biC sa Consumer Goods 336 409 482 0.91% 1.32%<br />
societe de la tour eiffel Financials 42 712 4<strong>31</strong> 2.56% 2.56%<br />
societe d’edition de Canal + Consumer services 54 255 056 1.29% 1.29%<br />
societe Generale sa Financials 2 523 161 466 2.16% 2.44%<br />
societe immobiliere de loc<strong>at</strong>ion pour<br />
l’industrie et le Commerce Financials 175 789 613 1.73% 1.73%<br />
societe television Francaise 1 Consumer services 83 595 993 0.68% 0.68%<br />
sodexo Consumer services 1 163 025 648 1.29% 1.72%<br />
soiteC technology 92 629 704 2.34% 2.57%<br />
somfy sa industrials 12 356 547 0.08% 0.13%<br />
sopra Group sa technology 19 057 635 0.58% 0.58%<br />
spir Communic<strong>at</strong>ion Consumer services 9 458 973 0.55% 0.92%<br />
stmicroelectronics nv technology 511 971 783 1.58% 1.58%<br />
suez environnement Co utilities 700 974 913 1.99% 1.99%<br />
technicolor sa Consumer services 44 984 643 0.22% 0.22%<br />
technip sa oil & Gas 1 507 655 222 2.30% 2.41%<br />
teleperformance sa Consumer services 178 654 842 2.28% 2.37%<br />
thales sa industrials 327 926 698 0.66% 0.86%<br />
theolia sa utilities 28 583 327 3.33% 3.36%<br />
total sa oil & Gas 14 369 558 915 1.98% 1.99%<br />
trigano sa Consumer Goods 20 148 182 0.66% 1.05%<br />
ubisoFt entertainment Consumer Goods 95 053 910 2.22% 2.50%<br />
unibail-rodamco se Financials 1 699 885 892 1.72% 1.72%<br />
union Financiere de France bQe sa Financials 5 855 232 0.23% 0.23%<br />
valeo sa Consumer Goods 406 062 049 2.10% 2.16%<br />
vallourec sa industrials 997 912 479 2.11% 2.11%<br />
veolia environnement sa utilities 233 549 724 0.68% 0.68%<br />
viel et Co Financials 9 694 033 0.66% 0.66%<br />
vilmorin & Cie Consumer Goods 89 588 057 0.59% 0.91%<br />
vinci sa industrials 3 701 1<strong>31</strong> 604 2.50% 2.50%<br />
virbac sa Health Care 141 100 928 1.18% 1.74%<br />
vivendi sa Consumer services 3 593 702 583 2.20% 2.20%<br />
Wendel sa Financials 225 290 044 0.74% 1.12%<br />
Zodiac aerospace industrials 632 759 537 1.81% 2.20%<br />
gEORgiA<br />
bank <strong>of</strong> Georgia JsC Financials 56 645 699 2.33% 2.33%<br />
gERmANy<br />
aareal bank aG Financials 162 625 587 2.51% 2.51%<br />
adidas aG Consumer Goods 1 784 589 034 2.19% 2.19%<br />
air berlin PlC Consumer services 20 038 802 1.22% 1.22%<br />
aixtron se na technology 173 721 647 2.24% 2.24%<br />
allianz se Financials 5 370 260 394 2.06% 2.06%<br />
alstria <strong>of</strong>fice reit-aG Financials 96 996 943 1.90% 1.90%<br />
asian bamboo aG basic m<strong>at</strong>erials 71 257 1<strong>31</strong> 4.01% 4.01%<br />
aurubis aG basic m<strong>at</strong>erials <strong>31</strong>9 105 536 2.22% 2.22%<br />
axel springer aG Consumer services 241 729 595 0.95% 0.95%<br />
basF se basic m<strong>at</strong>erials 8 410 712 649 2.19% 2.19%<br />
bauer aG industrials 56 078 320 2.00% 2.00%<br />
bayer aG basic m<strong>at</strong>erials 6 585 680 177 2.08% 2.08%<br />
bayerische motoren Werke aG Consumer Goods 2 702 532 664 0.68% 1.20%<br />
bayWa aG Consumer Goods 88 6<strong>31</strong> 292 1.22% 1.22%<br />
bechtle aG technology 117 188 366 2.75% 2.75%<br />
beiersdorf aG Consumer Goods 514 022 184 0.60% 0.60%<br />
bilfinger berger se industrials 383 361 367 1.63% 1.63%<br />
biotest aG Health Care 407 320 0.00% 0.01%<br />
brenntag aG basic m<strong>at</strong>erials 465 210 883 1.62% 1.62%<br />
Carl Zeiss meditec aG Health Care 60 034 140 0.58% 0.58%<br />
C<strong>at</strong> oil aG oil & Gas 14 180 579 0.84% 0.84%<br />
Celesio aG Consumer services 207 346 374 1.29% 1.29%<br />
Centrosolar Group aG oil & Gas 3 959 342 1.93% 1.93%<br />
Centrotherm Photovoltaics aG oil & Gas 18 990 699 1.17% 1.17%<br />
Comdirect bank aG Financials 21 592 729 0.26% 0.26%<br />
Commerzbank aG Financials 742 687 191 1.44% 1.44%<br />
Constantin medien aG Consumer services 6 837 988 0.81% 0.81%<br />
Continental aG Consumer Goods 769 697 676 1.03% 1.03%<br />
Cropenergies aG oil & Gas 13 723 226 0.43% 0.43%<br />
Cts eventim aG industrials 74 238 664 0.86% 0.86%<br />
Dab bank aG Financials 4 932 221 0.23% 0.23%<br />
Daimler aG Consumer Goods 6 063 046 451 2.16% 2.16%<br />
Delticom aG Consumer Goods 76 412 047 1.25% 1.25%<br />
Demag Cranes aG industrials 9 593 212 0.12% 0.12%<br />
Deutsche bank aG Financials 4 883 903 028 2.30% 2.30%<br />
Deutsche beteiligungs aG Financials 21 434 532 1.30% 1.30%<br />
Deutsche boerse aG Financials 1 359 634 883 2.22% 2.22%<br />
Deutsche euroshop aG Financials 246 582 017 2.49% 2.49%<br />
Deutsche lufthansa aG Consumer services 345 861 847 1.06% 1.06%<br />
Deutsche Post aG industrials 1 802 3<strong>31</strong> 043 1.62% 1.62%<br />
Deutsche Postbank aG Financials 46 551 151 0.11% 0.11%<br />
Deutsche telekom aG telecommunic<strong>at</strong>ions 5 639 795 609 1.90% 1.90%<br />
Deutsche Wohnen aG Financials 199 445 183 2.45% 2.45%<br />
Deutz aG industrials 85 591 157 2.22% 2.22%<br />
Dialog semiconductor PlC technology 183 237 427 2.89% 2.89%<br />
DiC asset aG Financials 30 146 805 1.59% 1.59%<br />
Douglas <strong>Holding</strong> aG Consumer services 183 275 970 2.16% 2.16%<br />
voting<br />
ownership<br />
sector<br />
market value<br />
(noK)<br />
Draegerwerk aG & Co KGaa Health Care 98 610 573 0.98% 1.35%<br />
Duerr aG industrials 49 244 917 1.08% 1.08%<br />
e.on aG utilities 4 739 694 963 1.83% 1.83%<br />
elmos semiconductor aG technology 9 940 956 0.83% 0.83%<br />
elringKlinger aG Consumer Goods 112 658 834 1.20% 1.20%<br />
elster Group se industrials 85 439 285 0.98% 0.98%<br />
Fielmann aG Consumer services 151 592 340 0.63% 0.63%<br />
Fraport aG Frankfurt airport services<br />
Worldwide industrials 230 275 121 0.85% 0.85%<br />
Freenet aG telecommunic<strong>at</strong>ions 297 489 748 3.00% 3.00%<br />
Fresenius medical Care aG & Co KGaa Health Care 1 985 651 961 1.63% 1.61%<br />
Fresenius se & Co KGaa Health Care 1 614 006 809 1.79% 1.79%<br />
Fuchs Petrolub aG basic m<strong>at</strong>erials 324 <strong>31</strong>3 109 2.13% 1.86%<br />
GaGFaH sa Financials 51 503 499 0.75% 0.75%<br />
Gea Group aG industrials 712 526 558 2.29% 2.29%<br />
Generali Deutschland <strong>Holding</strong> aG Financials 21 534 302 0.09% 0.09%<br />
Gerry Weber intern<strong>at</strong>ional aG Consumer Goods 151 125 218 1.80% 1.80%<br />
GFK se Consumer services 65 530 054 0.76% 0.76%<br />
Gildemeister aG industrials 110 521 277 2.43% 2.43%<br />
Grenkeleasing aG industrials 15 409 670 0.37% 0.37%<br />
H&r aG basic m<strong>at</strong>erials 44 589 507 1.16% 1.16%<br />
Hamburger Hafen und logistik aG industrials 112 721 200 0.88% 0.88%<br />
Hannover rueckversicherung aG Financials 149 461 694 0.42% 0.42%<br />
HeidelbergCement aG industrials 1 324 874 820 2.78% 2.78%<br />
Heidelberger Druckmaschinen aG industrials 45 048 171 2.00% 2.00%<br />
Henkel aG & Co KGaa Consumer Goods 1 817 092 914 1.60% 1.35%<br />
Hochtief aG industrials 570 940 263 2.14% 2.14%<br />
Hugo boss aG Consumer Goods 168 172 788 0.00% 0.54%<br />
indus <strong>Holding</strong> aG industrials 20 535 004 0.63% 0.63%<br />
infineon technologies aG technology 909 362 407 1.86% 1.86%<br />
ivG immobilien aG Financials 86 535 022 2.56% 2.56%<br />
Jenoptik aG industrials 26 633 861 1.32% 1.32%<br />
Jungheinrich aG industrials 66 091 964 0.00% 1.32%<br />
K+s aG basic m<strong>at</strong>erials 666 532 150 1.29% 1.29%<br />
Kabel Deutschland <strong>Holding</strong> aG Consumer services 1 675 782 737 6.13% 6.13%<br />
KHD Humboldt Wedag intern<strong>at</strong>ional aG industrials 1 184 910 0.06% 0.06%<br />
Kloeckner & Co se basic m<strong>at</strong>erials 623 995 778 8.14% 8.14%<br />
Kontron aG industrials 54 810 348 2.51% 2.51%<br />
Krones aG industrials 103 870 970 1.15% 1.15%<br />
Ksb aG industrials 501 734 0.00% 0.01%<br />
KuKa aG industrials 83 003 563 2.23% 2.23%<br />
KWs sa<strong>at</strong> aG Consumer Goods <strong>31</strong> 480 963 0.40% 0.40%<br />
lanxess aG basic m<strong>at</strong>erials 1 552 241 687 6.02% 6.02%<br />
leoni aG industrials 207 014 905 3.18% 3.18%<br />
linde aG basic m<strong>at</strong>erials 2 063 487 926 1.36% 1.36%<br />
man se industrials 841 860 134 1.09% 1.09%<br />
manz aG oil & Gas 223 781 0.03% 0.03%<br />
merck KGaa Health Care 840 793 210 0.65% 0.65%<br />
metro aG Consumer services 692 461 565 0.98% 0.97%<br />
morphosys aG Health Care 84 057 741 2.68% 2.68%<br />
mtu aero engines <strong>Holding</strong> aG industrials 325 368 142 1.63% 1.63%<br />
muenchener rueckversicherungs aG Financials 2 646 194 576 2.01% 2.01%<br />
nordex se oil & Gas 27 447 225 1.22% 1.22%<br />
P<strong>at</strong>rizia immobilien aG Financials 10 091 381 0.73% 0.73%<br />
Pfeiffer vacuum technology aG industrials 118 9<strong>31</strong> 002 2.30% 2.30%<br />
Porsche automobil <strong>Holding</strong> se Consumer Goods 1 063 503 509 0.00% 1.08%<br />
Praktiker aG Consumer services 20 762 882 3.38% 3.38%<br />
Prosiebens<strong>at</strong>.1 media aG Consumer services 653 058 218 0.00% 2.73%<br />
Puma se Consumer Goods 238 029 419 0.91% 0.91%<br />
Q-Cells se oil & Gas 12 626 062 1.88% 1.62%<br />
QiaGen nv Health Care 422 918 063 2.19% 2.19%<br />
QsC aG technology 51 919 832 2.34% 2.34%<br />
r<strong>at</strong>ional aG industrials 127 060 874 0.86% 0.86%<br />
rheinmetall aG Consumer Goods 105 886 957 1.01% 1.01%<br />
rhoen Klinikum aG Health Care 171 506 953 1.09% 1.09%<br />
roth & rau aG industrials 8 922 840 0.40% 0.40%<br />
rWe aG utilities 2 755 360 654 2.28% 2.13%<br />
salzgitter aG basic m<strong>at</strong>erials 290 171 548 1.61% 1.61%<br />
saP aG technology 6 327 346 568 1.63% 1.63%<br />
sartorius aG industrials 24 <strong>31</strong>7 509 0.00% 0.47%<br />
sGl Carbon se industrials 325 059 804 1.61% 1.61%<br />
siemens aG industrials 11 405 186 618 2.18% 2.18%<br />
singulus technologies aG industrials 16 505 479 2.14% 2.14%<br />
sixt aG Consumer services 101 213 302 1.22% 2.00%<br />
sky Deutschland aG Consumer services 130 439 5<strong>31</strong> 1.69% 1.69%<br />
sma solar technology aG oil & Gas 140 101 555 1.21% 1.21%<br />
s<strong>of</strong>tware aG technology 354 929 776 1.85% 1.85%<br />
solar millennium aG oil & Gas 11 170 0.04% 0.04%<br />
solarworld aG oil & Gas 827 146 0.03% 0.03%<br />
stada arzneimittel aG Health Care 220 697 895 2.51% 2.51%<br />
sto aG industrials 28 448 065 0.00% 0.52%<br />
stroer out-<strong>of</strong>-Home media aG Consumer services 123 712 174 2.99% 2.99%<br />
suedzucker aG Consumer Goods 263 268 722 0.73% 0.73%<br />
symrise aG basic m<strong>at</strong>erials 407 263 993 2.16% 2.16%<br />
takkt aG Consumer services 16 501 737 0.38% 0.38%<br />
teleg<strong>at</strong>e aG industrials 3 017 <strong>31</strong>2 0.38% 0.38%<br />
thyssenKrupp aG industrials 2 226 373 064 3.15% 3.15%<br />
tui aG Consumer services 211 357 277 2.26% 2.26%<br />
united internet aG technology 291 522 175 1.27% 1.27%<br />
volkswagen aG Consumer Goods 3 830 864 998 0.22% 0.93%<br />
vossloh aG industrials 136 597 945 1.79% 1.79%<br />
Country associ<strong>at</strong>ion according to Ftse (the benchmark provider for <strong>equities</strong>). if a company is not in the benchmark, the country <strong>of</strong> incorpor<strong>at</strong>ion is listed. sector classific<strong>at</strong>ion according to iCb (the industry Classific<strong>at</strong>ion<br />
benchmark company).<br />
voting<br />
ownership<br />
HOLdiNgs<br />
13<br />
<strong>Government</strong> <strong>Pension</strong> FunD <strong>Global</strong> ANNUAL REPORT 2011
<strong>Government</strong> <strong>Pension</strong> <strong>Fund</strong> <strong>Global</strong> <strong>Holding</strong> <strong>of</strong> <strong>equities</strong> <strong>at</strong> <strong>31</strong> December 2011<br />
sector<br />
market value<br />
(noK)<br />
Wacker Chemie aG basic m<strong>at</strong>erials 425 715 147 1.70% 1.70%<br />
Wincor nixdorf aG technology 197 387 666 2.23% 2.23%<br />
Wirecard aG industrials 166 992 712 1.70% 1.70%<br />
gREECE<br />
alpha bank ae Financials 56 919 864 2.56% 2.56%<br />
<strong>at</strong>hens W<strong>at</strong>er supply & sewage Co sa/the utilities 4 135 348 0.16% 0.16%<br />
bank <strong>of</strong> Cyprus Plc Financials 104 125 299 2.45% 2.45%<br />
Coca Cola Hellenic bottling Co sa Consumer Goods 244 278 077 0.65% 0.65%<br />
eFG eurobank ergasias sa Financials 33 149 470 2.04% 2.04%<br />
ellaktor sa industrials 20 304 958 1.22% 1.22%<br />
Folli Follie Group Consumer services 43 596 237 1.09% 1.09%<br />
Fourlis <strong>Holding</strong>s sa Consumer Goods 6 949 957 1.23% 1.23%<br />
Frigoglass sa industrials 18 444 244 1.<strong>31</strong>% 1.<strong>31</strong>%<br />
GeK terna <strong>Holding</strong> real est<strong>at</strong>e<br />
Construction sa industrials 4 773 481 1.18% 1.18%<br />
Hellenic exchanges sa <strong>Holding</strong> Clearing<br />
settlement and registry Financials 33 609 440 2.30% 2.30%<br />
Hellenic Petroleum sa oil & Gas 92 394 108 0.61% 0.61%<br />
Hellenic telecommunic<strong>at</strong>ions organiz<strong>at</strong>ion sa telecommunic<strong>at</strong>ions 270 074 435 2.47% 2.47%<br />
intralot sa-integr<strong>at</strong>ed lottery systems &<br />
services Consumer services 14 770 508 1.78% 1.78%<br />
Jumbo sa Consumer Goods 64 967 511 1.70% 1.70%<br />
Kleemann Hellas sa industrials 2 789 651 1.91% 1.91%<br />
marfin investment Group sa Financials 44 681 421 2.03% 2.03%<br />
marfin Popular bank PCl Financials 28 770 604 0.78% 0.78%<br />
metka sa industrials 16 784 388 0.70% 0.70%<br />
motor oil Hellas Corinth refineries sa oil & Gas 56 733 929 1.12% 1.12%<br />
mytilineos <strong>Holding</strong>s sa basic m<strong>at</strong>erials 54 870 247 1.94% 1.94%<br />
n<strong>at</strong>ional bank <strong>of</strong> Greece sa Financials 272 161 329 2.27% 2.27%<br />
oPaP sa Consumer services 272 614 936 1.62% 1.62%<br />
Piraeus bank sa Financials 53 691 <strong>31</strong>4 2.40% 2.40%<br />
Public Power Corp sa utilities 86 632 995 1.27% 1.27%<br />
sidenor steel Products manufacturing Co sa basic m<strong>at</strong>erials 5 882 665 0.77% 0.77%<br />
titan Cement Co sa industrials 116 866 941 1.54% 1.54%<br />
tt Hellenic Postbank sa Financials 7 561 700 0.86% 0.86%<br />
viohalco industrials 33 720 071 0.72% 0.72%<br />
gUERNsEy C. i.<br />
etalon Group ltd Financials 143 669 970 1.74% 1.74%<br />
Juridica investments ltd/Guernsey Financials 8 345 329 0.95% 0.95%<br />
raven russia ltd Financials 100 725 020 3.54% 3.54%<br />
rGi intern<strong>at</strong>ional ltd Financials 10 876 589 0.93% 0.93%<br />
sKil Ports & logistics ltd industrials 16 422 168 2.53% 2.53%<br />
HONg kONg<br />
361 Degrees intern<strong>at</strong>ional ltd Consumer Goods 21 060 871 0.43% 0.43%<br />
aaC technologies <strong>Holding</strong>s inc industrials 76 413 120 0.46% 0.46%<br />
agile Property <strong>Holding</strong>s ltd Financials 49 727 087 0.27% 0.27%<br />
aia Group ltd Financials 638 185 510 0.28% 0.28%<br />
ajisen China <strong>Holding</strong>s ltd Consumer services 15 886 076 0.23% 0.23%<br />
alibaba.com ltd Consumer services 153 848 416 0.50% 0.50%<br />
amviG <strong>Holding</strong>s ltd industrials 4 748 787 0.16% 0.16%<br />
anta sports Products ltd Consumer Goods 200 680 714 1.13% 1.13%<br />
anxin-China <strong>Holding</strong>s ltd Health Care 12 663 801 0.42% 0.42%<br />
apac resources ltd basic m<strong>at</strong>erials 3 839 141 0.22% 0.22%<br />
apollo solar energy technology <strong>Holding</strong>s ltd Consumer Goods 9 532 960 0.32% 0.32%<br />
artini China Co ltd Consumer services 4 007 269 2.83% 2.83%<br />
asia standard intern<strong>at</strong>ional Group Financials 1 779 123 0.16% 0.16%<br />
asian Citrus <strong>Holding</strong>s ltd Consumer Goods 6 285 612 0.16% 0.16%<br />
asm Pacific technology ltd technology 3 395 233 0.01% 0.01%<br />
aviC intern<strong>at</strong>ional <strong>Holding</strong> HK ltd industrials 38 266 926 4.27% 4.27%<br />
bank <strong>of</strong> east asia ltd Financials 304 750 508 0.65% 0.65%<br />
baWang intern<strong>at</strong>ional Group <strong>Holding</strong> ltd Consumer Goods 8 516 558 0.37% 0.37%<br />
belle intern<strong>at</strong>ional <strong>Holding</strong>s ltd Consumer Goods 508 224 554 0.58% 0.58%<br />
besunyen <strong>Holding</strong>s Co ltd Consumer Goods 71 024 0.00% 0.00%<br />
binhai investment Co ltd oil & Gas 29 968 075 1.67% 1.67%<br />
boC Hong Kong <strong>Holding</strong>s ltd Financials 400 487 264 0.27% 0.27%<br />
boshiwa intern<strong>at</strong>ional <strong>Holding</strong> ltd Consumer Goods 2 337 126 0.08% 0.08%<br />
bosideng intern<strong>at</strong>ional <strong>Holding</strong>s ltd Consumer Goods 25 546 939 0.19% 0.19%<br />
brightoil Petroleum <strong>Holding</strong>s ltd oil & Gas 13 222 806 0.17% 0.17%<br />
brilliant Circle <strong>Holding</strong>s intern<strong>at</strong>ional ltd industrials 115 261 826 3.41% 3.41%<br />
bYD electronic intern<strong>at</strong>ional Co ltd technology 6 158 489 0.16% 0.16%<br />
C C land <strong>Holding</strong>s ltd Financials 86 997 413 3.09% 3.09%<br />
Cafe de Coral <strong>Holding</strong>s ltd Consumer services 38 671 927 0.50% 0.50%<br />
C<strong>at</strong>hay Pacific airways ltd Consumer services 107 003 103 0.27% 0.27%<br />
Champion reit Financials 36 782 978 0.33% 0.33%<br />
Chaoda modern agriculture <strong>Holding</strong>s ltd Consumer Goods 8 143 877 0.59% 0.59%<br />
Chen Hsong <strong>Holding</strong>s industrials 629 637 0.05% 0.05%<br />
Cheung Kong <strong>Holding</strong>s ltd Financials 917 245 294 0.56% 0.56%<br />
Cheung Kong infrastructure <strong>Holding</strong>s ltd utilities 95 438 459 0.12% 0.12%<br />
Chigo <strong>Holding</strong> ltd Consumer Goods 3 038 603 0.25% 0.25%<br />
Chiho-tiande Group ltd industrials 9 <strong>31</strong>9 149 0.28% 0.28%<br />
China aerospace intern<strong>at</strong>ional <strong>Holding</strong>s ltd industrials 5 947 971 0.44% 0.44%<br />
China all access <strong>Holding</strong>s ltd technology 58 322 484 3.78% 3.78%<br />
China autom<strong>at</strong>ion Group ltd industrials 5 032 908 0.28% 0.28%<br />
China boon <strong>Holding</strong>s ltd Consumer Goods 4 5<strong>31</strong> 803 1.98% 1.98%<br />
China Daye non-Ferrous metals mining ltd Financials 4 547 033 0.23% 0.23%<br />
China Dongxiang Group Co Consumer services 17 298 956 0.30% 0.30%<br />
China Gas <strong>Holding</strong>s ltd oil & Gas 63 396 847 0.53% 0.53%<br />
China Gogreen assets investment ltd Health Care 16 351 811 4.44% 4.44%<br />
China Grand Forestry Green resources<br />
Group ltd basic m<strong>at</strong>erials 878 097 0.32% 0.32%<br />
China Green <strong>Holding</strong>s ltd/bermuda Consumer Goods 5 883 540 0.42% 0.42%<br />
voting<br />
ownership<br />
sector<br />
market value<br />
(noK)<br />
China Haidian <strong>Holding</strong>s ltd industrials 71 458 582 2.96% 2.96%<br />
China High Precision autom<strong>at</strong>ion Group ltd industrials 5 884 7<strong>31</strong> 0.27% 0.27%<br />
China High speed transmission<br />
equipment Group Co ltd oil & Gas 112 062 325 3.15% 3.15%<br />
China Huiyuan Juice Group ltd Consumer Goods 24 028 863 0.80% 0.80%<br />
China its <strong>Holding</strong>s Co ltd industrials 1 515 <strong>31</strong>6 0.11% 0.11%<br />
China liansu Group <strong>Holding</strong>s ltd industrials 138 408 806 1.78% 1.78%<br />
China lilang ltd Consumer Goods 8 081 936 0.13% 0.13%<br />
China lotsynergy <strong>Holding</strong>s ltd Consumer services 29 737 551 4.05% 4.05%<br />
China lumena new m<strong>at</strong>erials Corp basic m<strong>at</strong>erials 13 611 666 0.22% 0.22%<br />
China medical system <strong>Holding</strong>s ltd Health Care 6 344 718 0.10% 0.10%<br />
China mengniu Dairy Co ltd Consumer Goods 615 206 094 2.50% 2.50%<br />
China metal recycling <strong>Holding</strong>s ltd industrials 451 400 351 6.13% 6.13%<br />
China mining resources Group ltd basic m<strong>at</strong>erials 2 904 483 0.37% 0.37%<br />
China nickel resources <strong>Holding</strong> Co ltd basic m<strong>at</strong>erials 920 589 0.09% 0.09%<br />
China oil and Gas Group ltd oil & Gas 5 883 732 0.24% 0.24%<br />
China Precious metal resources<br />
<strong>Holding</strong>s Co ltd Consumer Goods 11 147 017 0.30% 0.30%<br />
China rare earth <strong>Holding</strong>s ltd basic m<strong>at</strong>erials 5 438 698 0.27% 0.27%<br />
China renewable energy investment ltd industrials 138 975 0.03% 0.03%<br />
China resources and transport<strong>at</strong>ion<br />
Group ltd basic m<strong>at</strong>erials 9 059 580 0.19% 0.19%<br />
China rongsheng Heavy industries<br />
Group <strong>Holding</strong>s ltd industrials 60 560 861 0.53% 0.53%<br />
China sCe Property <strong>Holding</strong>s ltd Financials 78 380 555 2.25% 2.25%<br />
China shanshui Cement Group ltd industrials 72 461 883 0.65% 0.65%<br />
China shineway Pharmaceutical Group ltd Health Care 29 747 740 0.42% 0.42%<br />
China singyes solar technologies<br />
<strong>Holding</strong>s ltd oil & Gas 3 087 910 0.26% 0.26%<br />
China south City <strong>Holding</strong>s ltd industrials 96 707 746 2.10% 2.10%<br />
China ting Group <strong>Holding</strong>s ltd Consumer Goods 14 292 466 1.91% 1.91%<br />
China tontine Wines Group ltd Consumer Goods 6 904 691 0.48% 0.48%<br />
China travel intern<strong>at</strong>ional inv HK Consumer services 82 450 028 1.44% 1.44%<br />
China vanadium titano - magnetite<br />
mining Co ltd basic m<strong>at</strong>erials 10 017 820 0.41% 0.41%<br />
China W<strong>at</strong>er affairs Group ltd utilities 211 <strong>31</strong>5 <strong>31</strong>5 8.53% 8.53%<br />
China WindPower Group ltd utilities 4 603 865 0.28% 0.28%<br />
China Wireless technologies ltd technology 10 275 822 0.44% 0.44%<br />
China Yurun Food Group ltd Consumer Goods 117 010 547 0.82% 0.82%<br />
China Zhongwang <strong>Holding</strong>s ltd basic m<strong>at</strong>erials 19 943 625 0.18% 0.18%<br />
Chinavision media Group ltd industrials 23 279 047 3.99% 3.99%<br />
Chinese est<strong>at</strong>es <strong>Holding</strong>s ltd Financials 15 962 754 0.09% 0.09%<br />
Chow sang sang <strong>Holding</strong>s intern<strong>at</strong>ional ltd Consumer services 99 415 246 1.09% 1.09%<br />
Chow tai Fook Jewellery Group ltd Consumer services 168 436 736 0.16% 0.16%<br />
Cinda intern<strong>at</strong>ional <strong>Holding</strong>s ltd Financials 18 418 840 3.98% 3.98%<br />
Citic 21Cn Co ltd technology 3 108 565 0.25% 0.25%<br />
Citic telecom intern<strong>at</strong>ional <strong>Holding</strong>s ltd telecommunic<strong>at</strong>ions 3 800 259 0.13% 0.13%<br />
ClP <strong>Holding</strong>s ltd utilities 598 820 492 0.49% 0.49%<br />
Coastal Greenland ltd Financials 67 298 0.01% 0.01%<br />
Comba telecom systems <strong>Holding</strong>s ltd technology 14 018 912 0.19% 0.19%<br />
Country Garden <strong>Holding</strong>s Co ltd Financials 49 397 2<strong>31</strong> 0.13% 0.13%<br />
CP Pokphand Co Consumer Goods 29 986 594 0.24% 0.24%<br />
Cst mining Group ltd Financials 5 425 789 0.41% 0.41%<br />
Dah sing banking Group ltd Financials 8 702 233 0.14% 0.14%<br />
Dah sing Financial <strong>Holding</strong>s ltd Financials 14 660 426 0.28% 0.28%<br />
Daphne intern<strong>at</strong>ional <strong>Holding</strong>s ltd Consumer Goods <strong>31</strong> 505 668 0.29% 0.29%<br />
Dejin resources Group Co ltd Consumer Goods 1 423 373 0.<strong>31</strong>% 0.<strong>31</strong>%<br />
Dickson Concepts intern<strong>at</strong>ional ltd Consumer services 5 514 940 0.48% 0.48%<br />
Digital China <strong>Holding</strong>s ltd technology 86 836 293 0.86% 0.86%<br />
Dongyue Group basic m<strong>at</strong>erials 27 976 596 0.34% 0.34%<br />
eganaGoldpfeil <strong>Holding</strong>s ltd Consumer services 1 0.00% 0.00%<br />
emperor W<strong>at</strong>ch & Jewellery ltd Consumer services 11 418 912 0.23% 0.23%<br />
enn energy <strong>Holding</strong>s ltd utilities 124 774 881 0.62% 0.62%<br />
esprit <strong>Holding</strong>s ltd Consumer services 62 861 916 0.63% 0.63%<br />
esun <strong>Holding</strong>s ltd Consumer services 27 339 721 2.60% 2.60%<br />
eva Precision industrial <strong>Holding</strong>s ltd industrials 7 627 567 0.30% 0.30%<br />
evergrande real est<strong>at</strong>e Group ltd Financials 118 684 134 0.32% 0.32%<br />
Fantasia <strong>Holding</strong>s Group Co ltd Financials 3 363 986 0.12% 0.12%<br />
Far east Consortium intern<strong>at</strong>ional ltd/HK Financials 1 707 211 0.10% 0.10%<br />
First Pacific Co ltd/Hong Kong Consumer Goods 112 602 980 0.47% 0.47%<br />
Fook Woo Group <strong>Holding</strong>s ltd Consumer Goods 11 026 238 0.43% 0.43%<br />
Fosun intern<strong>at</strong>ional ltd basic m<strong>at</strong>erials 40 132 508 0.20% 0.20%<br />
Foxconn intern<strong>at</strong>ional <strong>Holding</strong>s ltd technology 53 684 694 0.19% 0.19%<br />
Fu Ji Food and C<strong>at</strong>ering services<br />
<strong>Holding</strong>s ltd Consumer services 73 0.18% 0.18%<br />
Fufeng Group ltd basic m<strong>at</strong>erials 13 144 305 0.28% 0.28%<br />
Galaxy entertainment Group ltd Consumer services 86 651 198 0.19% 0.19%<br />
GCl-Poly energy <strong>Holding</strong>s ltd utilities 207 193 159 0.80% 0.80%<br />
Geely automobile <strong>Holding</strong>s ltd Consumer Goods 32 507 293 0.33% 0.33%<br />
Giordano intern<strong>at</strong>ional ltd Consumer services 42 698 396 0.65% 0.65%<br />
<strong>Global</strong> bio-Chem technology Group Co ltd Consumer Goods 16 676 757 0.42% 0.42%<br />
Glorious Property <strong>Holding</strong>s ltd Financials 91 575 859 1.12% 1.12%<br />
Golden eagle retail Group ltd Consumer services 146 651 202 0.60% 0.60%<br />
Golden meditech <strong>Holding</strong>s ltd Health Care 33 168 734 2.45% 2.45%<br />
Goldin Properties <strong>Holding</strong>s ltd Financials 85 793 219 4.45% 4.45%<br />
Gome electrical appliances <strong>Holding</strong> ltd Consumer services 113 143 414 0.48% 0.48%<br />
Goodtop tin intern<strong>at</strong>ional <strong>Holding</strong>s ltd industrials 10 880 409 0.54% 0.54%<br />
Gre<strong>at</strong> eagle <strong>Holding</strong>s ltd Consumer services 20 699 425 0.28% 0.28%<br />
Greentown China <strong>Holding</strong>s ltd Financials 11 309 855 0.27% 0.27%<br />
G-resources Group ltd industrials 2<strong>31</strong> 078 754 4.05% 4.05%<br />
Guoco Group ltd Financials 41 138 675 0.23% 0.23%<br />
Country associ<strong>at</strong>ion according to Ftse (the benchmark provider for <strong>equities</strong>). if a company is not in the benchmark, the country <strong>of</strong> incorpor<strong>at</strong>ion is listed. sector classific<strong>at</strong>ion according to iCb (the industry Classific<strong>at</strong>ion<br />
benchmark company).<br />
voting<br />
ownership<br />
HOLdiNgs<br />
14<br />
<strong>Government</strong> <strong>Pension</strong> FunD <strong>Global</strong> ANNUAL REPORT 2011
<strong>Government</strong> <strong>Pension</strong> <strong>Fund</strong> <strong>Global</strong> <strong>Holding</strong> <strong>of</strong> <strong>equities</strong> <strong>at</strong> <strong>31</strong> December 2011<br />
sector<br />
market value<br />
(noK)<br />
GZi real est<strong>at</strong>e investment trust Financials 7 261 226 0.26% 0.26%<br />
Haier electronics Group Co ltd Consumer Goods 85 308 582 0.68% 0.68%<br />
Haitian intern<strong>at</strong>ional <strong>Holding</strong>s ltd industrials 200 807 832 2.45% 2.45%<br />
Hang lung Group ltd Financials 27 875 184 0.06% 0.06%<br />
Hang lung Properties ltd Financials 600 206 522 0.79% 0.79%<br />
Hang seng bank ltd Financials 218 389 325 0.16% 0.16%<br />
Hao tian resources Group ltd industrials 38 036 403 2.98% 2.98%<br />
Henderson investment ltd industrials 1 144 550 0.09% 0.09%<br />
Henderson land Development Co ltd Financials 152 744 470 0.22% 0.22%<br />
Heng tai Consumables Group ltd Consumer Goods 2 8<strong>31</strong> 983 0.25% 0.25%<br />
Hengan intern<strong>at</strong>ional Group Co ltd Consumer Goods 327 246 997 0.48% 0.48%<br />
Hengdeli <strong>Holding</strong>s ltd Consumer services 67 702 891 0.79% 0.79%<br />
Hi sun technology China ltd technology 186 076 387 4.27% 4.27%<br />
Hidili industry intern<strong>at</strong>ional Development ltd basic m<strong>at</strong>erials 10 344 887 0.28% 0.28%<br />
HKC <strong>Holding</strong>s ltd industrials 2 585 080 0.11% 0.11%<br />
HKr intern<strong>at</strong>ional ltd Financials 4 500 799 0.18% 0.18%<br />
Hong Kong & China Gas Co ltd utilities 515 663 702 0.47% 0.47%<br />
Hong Kong aircraft engineering Co ltd industrials 21 484 804 0.17% 0.17%<br />
Hong Kong exchanges and Clearing ltd Financials 665 187 820 0.65% 0.65%<br />
Hongkong & shanghai Hotels/the Consumer services 21 166 866 0.21% 0.21%<br />
Hongkong Chinese ltd Financials 152 392 0.01% 0.01%<br />
Hongkong land <strong>Holding</strong>s ltd Financials 347 233 891 0.55% 0.55%<br />
Hopewell Highway infrastructure ltd industrials 9 093 795 0.10% 0.10%<br />
Hopewell <strong>Holding</strong>s ltd Financials 62 155 959 0.47% 0.47%<br />
Hopson Development <strong>Holding</strong>s ltd Financials 7 785 106 0.14% 0.14%<br />
Hua Han bio-Pharmaceutical <strong>Holding</strong>s ltd Health Care 94 898 904 3.94% 3.94%<br />
Huabao intern<strong>at</strong>ional <strong>Holding</strong>s ltd basic m<strong>at</strong>erials 86 694 897 0.90% 0.90%<br />
Hutchison Harbour ring ltd Financials 7 930 844 0.17% 0.17%<br />
Hutchison Port <strong>Holding</strong>s trust industrials 74 002 580 0.23% 0.23%<br />
Hutchison telecommunic<strong>at</strong>ions Hong Kong<br />
<strong>Holding</strong>s ltd telecommunic<strong>at</strong>ions 19 330 202 0.17% 0.17%<br />
Hutchison Whampoa ltd industrials 969 074 902 0.45% 0.45%<br />
Hysan Development Co ltd Financials 102 050 033 0.49% 0.49%<br />
inspur intern<strong>at</strong>ional ltd technology 1 245 2<strong>31</strong> 0.19% 0.19%<br />
interchina <strong>Holding</strong>s Co utilities 3 459 968 0.30% 0.30%<br />
intern<strong>at</strong>ional mining machinery <strong>Holding</strong>s ltd industrials 24 495 962 0.29% 0.29%<br />
intime Department store Group Co ltd Consumer services 32 196 835 0.26% 0.26%<br />
it ltd Consumer services 18 667 252 0.46% 0.46%<br />
Jardine m<strong>at</strong>heson <strong>Holding</strong>s ltd industrials 688 090 740 0.37% 0.37%<br />
Jardine str<strong>at</strong>egic <strong>Holding</strong>s ltd industrials 217 833 118 0.12% 0.12%<br />
Jinchuan Group intern<strong>at</strong>ional<br />
resources Co ltd Financials 5 224 258 0.12% 0.12%<br />
Johnson electric <strong>Holding</strong>s ltd industrials 40 442 640 0.34% 0.34%<br />
Ju teng intern<strong>at</strong>ional <strong>Holding</strong>s ltd technology 7 617 132 0.99% 0.99%<br />
K Wah intern<strong>at</strong>ional <strong>Holding</strong>s ltd Financials 6 573 332 0.17% 0.17%<br />
Kai Yuan <strong>Holding</strong>s ltd Financials 3 <strong>31</strong>0 012 0.22% 0.22%<br />
Kaisa Group <strong>Holding</strong>s ltd Financials 13 062 423 0.26% 0.26%<br />
Kerry Properties ltd Financials 112 852 747 0.40% 0.40%<br />
King stone energy Group ltd basic m<strong>at</strong>erials 1 673 025 0.20% 0.20%<br />
Kingboard Chemical <strong>Holding</strong>s ltd basic m<strong>at</strong>erials 228 968 771 1.52% 1.52%<br />
Kingboard lamin<strong>at</strong>es <strong>Holding</strong>s ltd basic m<strong>at</strong>erials 13 859 <strong>31</strong>3 0.17% 0.17%<br />
Kingdee intern<strong>at</strong>ional s<strong>of</strong>tware Group Co ltd technology 17 065 801 0.42% 0.42%<br />
Kings<strong>of</strong>t Corp ltd Consumer Goods 4 753 167 0.18% 0.18%<br />
Kingston Financial Group ltd Consumer services 112 618 488 1.52% 1.52%<br />
Kowloon Development Co ltd Financials 5 972 407 0.10% 0.10%<br />
KWG Property <strong>Holding</strong> ltd Financials 18 598 <strong>31</strong>0 0.32% 0.32%<br />
lai Fung <strong>Holding</strong>s ltd Financials 646 875 0.06% 0.06%<br />
lai sun Development Financials 3 577 975 0.22% 0.22%<br />
lee & man Paper manufacturing ltd basic m<strong>at</strong>erials 20 264 232 0.22% 0.22%<br />
li & Fung ltd Consumer Goods 470 570 707 0.53% 0.53%<br />
li ning Co ltd Consumer Goods 21 017 <strong>31</strong>0 0.42% 0.42%<br />
lifestyle intern<strong>at</strong>ional <strong>Holding</strong>s ltd Consumer services 54 686 235 0.25% 0.25%<br />
link reit/the Financials <strong>31</strong>9 630 158 0.65% 0.65%<br />
l’occitane intern<strong>at</strong>ional sa Consumer services 54 595 839 0.<strong>31</strong>% 0.<strong>31</strong>%<br />
longfor Properties Co ltd Financials 78 497 376 0.23% 0.23%<br />
lonking <strong>Holding</strong>s ltd industrials 14 974 478 0.17% 0.17%<br />
luk Fook <strong>Holding</strong>s intern<strong>at</strong>ional ltd Consumer services 53 475 955 0.47% 0.47%<br />
lung Kee bermuda <strong>Holding</strong>s basic m<strong>at</strong>erials 35 922 962 2.06% 2.06%<br />
magic <strong>Holding</strong>s intern<strong>at</strong>ional ltd Consumer Goods 90 275 625 3.99% 3.99%<br />
man Wah <strong>Holding</strong>s ltd Consumer Goods 5 904 024 0.17% 0.17%<br />
maoye intern<strong>at</strong>ional <strong>Holding</strong>s ltd Consumer services 7 215 344 0.11% 0.11%<br />
media asia Group <strong>Holding</strong>s ltd Consumer services 59 029 423 3.50% 3.50%<br />
media Chinese intern<strong>at</strong>ional ltd Consumer services 13 930 814 0.38% 0.38%<br />
melco intern<strong>at</strong>ional Development ltd Consumer services 22 651 969 0.41% 0.41%<br />
michael Kors <strong>Holding</strong>s ltd Consumer Goods 9 757 598 0.03% 0.03%<br />
microport scientific Corp Health Care 9 417 660 0.22% 0.22%<br />
midland <strong>Holding</strong>s ltd Financials 6 997 284 0.<strong>31</strong>% 0.<strong>31</strong>%<br />
ming Fung Jewellery Group ltd Consumer Goods 52 367 290 3.97% 3.97%<br />
mingyuan medicare Development Co ltd Health Care 79 177 0.01% 0.01%<br />
minth Group ltd Consumer Goods 189 808 842 3.15% 3.15%<br />
mongolia energy Corp ltd basic m<strong>at</strong>erials 14 959 218 0.42% 0.42%<br />
mtr Corp Consumer services 215 281 590 0.19% 0.19%<br />
nan Hai Corp ltd Financials 2 204 843 0.13% 0.13%<br />
n<strong>at</strong>ural beauty bio-technology ltd Consumer Goods 61 780 339 3.00% 3.00%<br />
neo-neon <strong>Holding</strong>s ltd Consumer Goods 2 654 076 0.28% 0.28%<br />
new times energy Corp ltd industrials 571 963 0.28% 0.28%<br />
new World China land ltd Financials 12 905 437 0.13% 0.13%<br />
new World Department store China ltd Consumer services 5 600 288 0.10% 0.10%<br />
new World Development Co ltd Financials 179 829 091 0.62% 0.62%<br />
nine Dragons Paper <strong>Holding</strong>s ltd basic m<strong>at</strong>erials 386 368 592 2.21% 2.21%<br />
north asia resources <strong>Holding</strong>s ltd technology 6 823 500 3.51% 3.51%<br />
voting<br />
ownership<br />
sector<br />
market value<br />
(noK)<br />
north mining shares Co ltd basic m<strong>at</strong>erials 4 371 773 0.22% 0.22%<br />
nvC lighting <strong>Holding</strong>s ltd Consumer Goods 15 111 010 0.22% 0.22%<br />
nWs <strong>Holding</strong>s ltd industrials 58 119 057 0.20% 0.20%<br />
o-net Communic<strong>at</strong>ions Group ltd technology 4 192 457 0.<strong>31</strong>% 0.<strong>31</strong>%<br />
orient overseas intern<strong>at</strong>ional ltd industrials 57 027 921 0.26% 0.26%<br />
oriental Ginza <strong>Holding</strong>s ltd Financials 12 060 229 0.98% 0.98%<br />
Pacific andes intern<strong>at</strong>ional <strong>Holding</strong>s ltd Consumer Goods 3 187 0.00% 0.00%<br />
Pacific basin shipping ltd industrials 26 471 392 0.57% 0.57%<br />
Pacific textile <strong>Holding</strong>s ltd Consumer Goods 5 486 302 0.11% 0.11%<br />
Parkson retail Group ltd Consumer services 63 888 032 0.<strong>31</strong>% 0.<strong>31</strong>%<br />
PaX <strong>Global</strong> technology ltd technology 25 819 508 1.93% 1.93%<br />
PCCW ltd telecommunic<strong>at</strong>ions 13 561 560 0.09% 0.09%<br />
PCD stores Group ltd Consumer services 51 537 205 1.48% 1.48%<br />
Peace mark <strong>Holding</strong>s ltd Consumer Goods <strong>31</strong>2 0.32% 0.32%<br />
Peak sport Products Co ltd Consumer services 11 391 465 0.35% 0.35%<br />
Petroasian energy <strong>Holding</strong>s ltd industrials 3 052 994 0.50% 0.50%<br />
Phoenix s<strong>at</strong>ellite television <strong>Holding</strong>s ltd Consumer services 12 648 126 0.17% 0.17%<br />
Polytec asset <strong>Holding</strong>s ltd Financials 3 429 500 0.12% 0.12%<br />
Ports Design ltd Consumer services 21 740 993 0.42% 0.42%<br />
Pou sheng intern<strong>at</strong>ional <strong>Holding</strong>s ltd Consumer services 15 799 615 0.49% 0.49%<br />
Power assets <strong>Holding</strong>s ltd utilities 459 6<strong>31</strong> 114 0.49% 0.49%<br />
Powerlong real est<strong>at</strong>e <strong>Holding</strong>s ltd Financials 1 961 910 0.06% 0.06%<br />
Prosperity reit Financials 5 373 506 0.34% 0.34%<br />
Public Financial <strong>Holding</strong>s ltd Financials 17 471 642 0.60% 0.60%<br />
real nutriceutical Group ltd Consumer Goods 2 943 265 0.13% 0.13%<br />
regal Hotels intern<strong>at</strong>ional <strong>Holding</strong>s ltd Consumer services 4 097 650 0.23% 0.23%<br />
regent Pacific Group ltd Financials 4 380 533 0.63% 0.63%<br />
renhe Commercial <strong>Holding</strong>s Co ltd Financials 750 748 783 5.19% 5.19%<br />
reXlot <strong>Holding</strong>s ltd Consumer services 10 169 551 0.33% 0.33%<br />
road King infrastructure ltd industrials 2 821 033 0.11% 0.11%<br />
sa sa intern<strong>at</strong>ional <strong>Holding</strong>s ltd Consumer services 18 146 515 0.20% 0.20%<br />
sands China ltd Consumer services 298 794 562 0.22% 0.22%<br />
sany Heavy equipment intern<strong>at</strong>ional<br />
<strong>Holding</strong>s Co ltd industrials 26 703 629 0.18% 0.18%<br />
semiconductor manufacturing<br />
intern<strong>at</strong>ional Corp technology 39 014 687 0.49% 0.49%<br />
shanghai industrial urban Development<br />
Group ltd Financials 3 448 941 0.07% 0.07%<br />
shangri-la asia ltd Consumer services 103 777 707 0.32% 0.32%<br />
shenguan <strong>Holding</strong>s Group ltd Consumer Goods 80 893 055 0.70% 0.70%<br />
shenzhou intern<strong>at</strong>ional Group <strong>Holding</strong>s ltd Consumer Goods 10 042 840 0.10% 0.10%<br />
shimao Property <strong>Holding</strong>s ltd Financials 105 834 654 0.60% 0.60%<br />
shougang Fushan resources Group ltd basic m<strong>at</strong>erials 135 143 2<strong>31</strong> 1.24% 1.24%<br />
shui on land ltd Financials 26 634 499 0.28% 0.28%<br />
shun tak <strong>Holding</strong>s ltd Consumer services 20 487 866 0.42% 0.42%<br />
silver base Group <strong>Holding</strong>s ltd Consumer Goods 14 765 040 0.26% 0.26%<br />
singamas Container <strong>Holding</strong>s ltd industrials 11 424 429 0.42% 0.42%<br />
sino biopharmaceutical Health Care 24 616 146 0.28% 0.28%<br />
sino land Co ltd Financials 157 024 834 0.<strong>31</strong>% 0.<strong>31</strong>%<br />
sino oil and Gas <strong>Holding</strong>s ltd oil & Gas 76 529 242 3.09% 3.09%<br />
sino Prosper st<strong>at</strong>e Gold resources<br />
<strong>Holding</strong>s ltd basic m<strong>at</strong>erials 8 723 476 1.72% 1.72%<br />
sino union energy investment Group ltd oil & Gas 2 777 503 0.10% 0.10%<br />
sino-Forest Corp basic m<strong>at</strong>erials 958 0.66% 0.66%<br />
sinolink Worldwide <strong>Holding</strong>s ltd Financials 4 605 647 0.29% 0.29%<br />
sJm <strong>Holding</strong>s ltd Consumer services 138 016 201 0.26% 0.26%<br />
skyworth Digital <strong>Holding</strong>s ltd Consumer Goods 23 676 832 0.43% 0.43%<br />
smartone telecommunic<strong>at</strong>ions <strong>Holding</strong> ltd telecommunic<strong>at</strong>ions 29 794 721 0.28% 0.28%<br />
soCam Development ltd industrials 2 927 624 0.11% 0.11%<br />
soho China ltd Financials 52 546 783 0.25% 0.25%<br />
sparkle roll Group ltd Consumer services 7 261 495 0.42% 0.42%<br />
sre Group ltd Financials 2 608 075 0.20% 0.20%<br />
stella intern<strong>at</strong>ional <strong>Holding</strong>s ltd Consumer Goods 13 126 447 0.13% 0.13%<br />
strong Petrochemical <strong>Holding</strong>s ltd oil & Gas 48 686 595 3.96% 3.96%<br />
sun Hung Kai Properties ltd Financials 829 604 125 0.43% 0.43%<br />
sunlight real est<strong>at</strong>e investment trust Financials 8 029 554 0.29% 0.29%<br />
superb summit intern<strong>at</strong>ional timber Co ltd Consumer Goods 14 599 8<strong>31</strong> 2.43% 2.43%<br />
swire Pacific ltd industrials 421 825 723 0.15% 0.15%<br />
tai Cheung <strong>Holding</strong>s Financials 4 668 296 0.21% 0.21%<br />
tCC intern<strong>at</strong>ional <strong>Holding</strong>s ltd industrials 23 091 554 0.34% 0.34%<br />
tCl Communic<strong>at</strong>ion technology <strong>Holding</strong>s ltd technology 5 666 556 0.19% 0.19%<br />
techtronic industries Co Consumer Goods 133 398 693 1.36% 1.36%<br />
television broadcasts ltd Consumer services 41 908 086 0.26% 0.26%<br />
tencent <strong>Holding</strong>s ltd technology 826 629 502 0.37% 0.37%<br />
texwinca <strong>Holding</strong>s ltd Consumer Goods 19 676 673 0.22% 0.22%<br />
tianneng Power intern<strong>at</strong>ional ltd Consumer Goods 78 719 985 2.69% 2.69%<br />
tibet 5100 W<strong>at</strong>er resources <strong>Holding</strong>s ltd Consumer Goods 15 427 058 0.37% 0.37%<br />
tingyi Cayman islands <strong>Holding</strong> Corp Consumer Goods 300 464 092 0.30% 0.30%<br />
titan Petrochemicals Group ltd oil & Gas 2 323 678 0.12% 0.12%<br />
tom Group ltd technology 1 146 409 0.06% 0.06%<br />
tomson Group ltd Financials 2 775 359 0.14% 0.14%<br />
tongda Group <strong>Holding</strong>s ltd industrials 24 781 293 3.21% 3.21%<br />
towngas China Co ltd utilities 6 980 717 0.09% 0.09%<br />
tPv technology ltd technology 10 553 557 0.41% 0.41%<br />
trinity ltd Consumer services 43 8<strong>31</strong> 460 0.60% 0.60%<br />
truly intern<strong>at</strong>ional <strong>Holding</strong>s industrials 3 423 276 0.12% 0.12%<br />
uni-President China <strong>Holding</strong>s ltd Consumer Goods 22 857 227 0.18% 0.18%<br />
united energy Group ltd oil & Gas 16 273 018 0.13% 0.13%<br />
united labor<strong>at</strong>ories intern<strong>at</strong>ional<br />
<strong>Holding</strong>s ltd/the Health Care 7 769 523 0.17% 0.17%<br />
value Partners Group ltd Financials 15 948 933 0.30% 0.30%<br />
Country associ<strong>at</strong>ion according to Ftse (the benchmark provider for <strong>equities</strong>). if a company is not in the benchmark, the country <strong>of</strong> incorpor<strong>at</strong>ion is listed. sector classific<strong>at</strong>ion according to iCb (the industry Classific<strong>at</strong>ion<br />
benchmark company).<br />
voting<br />
ownership<br />
HOLdiNgs<br />
15<br />
<strong>Government</strong> <strong>Pension</strong> FunD <strong>Global</strong> ANNUAL REPORT 2011
<strong>Government</strong> <strong>Pension</strong> <strong>Fund</strong> <strong>Global</strong> <strong>Holding</strong> <strong>of</strong> <strong>equities</strong> <strong>at</strong> <strong>31</strong> December 2011<br />
sector<br />
market value<br />
(noK)<br />
varitronix intern<strong>at</strong>ional ltd industrials 1 537 070 0.19% 0.19%<br />
vinda intern<strong>at</strong>ional <strong>Holding</strong>s ltd Consumer Goods 30 261 224 0.42% 0.42%<br />
vitasoy intern<strong>at</strong>ional <strong>Holding</strong>s ltd Consumer Goods 12 579 399 0.28% 0.28%<br />
voDone ltd technology 13 299 186 0.62% 0.62%<br />
vtech <strong>Holding</strong>s ltd technology 68 528 642 0.46% 0.46%<br />
Wah nam intern<strong>at</strong>ional <strong>Holding</strong>s ltd Consumer services 7 420 035 0.27% 0.27%<br />
Want Want China <strong>Holding</strong>s ltd Consumer Goods 251 934 497 0.32% 0.32%<br />
Wasion Group <strong>Holding</strong>s ltd industrials 22 915 434 1.40% 1.40%<br />
Welling <strong>Holding</strong> ltd industrials 309 455 0.01% 0.01%<br />
West China Cement ltd industrials 17 908 922 0.42% 0.42%<br />
Wharf <strong>Holding</strong>s ltd Financials 226 746 932 0.28% 0.28%<br />
Wheelock & Co ltd Financials 115 213 662 0.38% 0.38%<br />
Wing Hang bank ltd Financials 108 681 020 0.74% 0.74%<br />
Wynn macau ltd Consumer services 408 848 511 0.53% 0.53%<br />
Xingda intern<strong>at</strong>ional <strong>Holding</strong>s ltd Consumer Goods 9 214 030 0.22% 0.22%<br />
Xinyi Glass <strong>Holding</strong>s ltd Consumer Goods 62 277 594 0.49% 0.49%<br />
XteP intern<strong>at</strong>ional <strong>Holding</strong>s Consumer Goods 9 516 685 0.23% 0.23%<br />
Yingde Gases basic m<strong>at</strong>erials 63 774 660 0.58% 0.58%<br />
Yip’s Chemical <strong>Holding</strong>s ltd basic m<strong>at</strong>erials 143 847 0.01% 0.01%<br />
Yue Yuen industrial <strong>Holding</strong>s ltd Consumer Goods 103 596 279 0.33% 0.33%<br />
Zhongsheng Group <strong>Holding</strong>s ltd Consumer Goods 21 845 328 0.12% 0.12%<br />
HUNgARy<br />
egis Gyogyszergyar nyrt Health Care 78 992 116 2.33% 2.33%<br />
FHb mortgage bank PlC Financials 1 385 923 0.18% 0.11%<br />
magyar telekom telecommunic<strong>at</strong>ions PlC telecommunic<strong>at</strong>ions 7 364 479 0.02% 0.06%<br />
mol Hungarian oil and Gas PlC oil & Gas 705 181 710 1.58% 1.58%<br />
otP bank PlC Financials 373 936 514 1.69% 1.69%<br />
richter Gedeon nyrt Health Care 240 016 309 1.53% 1.53%<br />
iNdiA<br />
3i infotech ltd technology 2 151 341 0.86% 0.86%<br />
abb ltd/india industrials 3 809 255 0.03% 0.03%<br />
aCC ltd industrials 146 706 588 0.61% 0.61%<br />
adani Power ltd utilities 65 661 436 0.43% 0.43%<br />
alstom Projects india ltd industrials 43 545 387 1.95% 1.95%<br />
ambuja Cements ltd industrials 51 669 893 0.19% 0.19%<br />
areva t&D india ltd industrials 18 775 937 0.71% 0.70%<br />
arvind ltd Consumer Goods 103 455 641 5.42% 5.42%<br />
aventis Pharma ltd/india Health Care 52 472 558 0.87% 0.87%<br />
axis bank ltd Financials 70 716 653 0.19% 0.19%<br />
bajaj auto ltd Consumer Goods 417 910 088 0.81% 0.81%<br />
bajaj Finserv ltd Financials 83 212 228 1.19% 1.19%<br />
b<strong>at</strong>a india ltd Consumer Goods 21 408 065 0.56% 0.56%<br />
bayer Cropscience ltd/india basic m<strong>at</strong>erials 16 886 414 0.53% 0.53%<br />
beml ltd industrials 16 650 246 0.78% 0.78%<br />
bhar<strong>at</strong> electronics ltd industrials 14 975 605 0.12% 0.12%<br />
bhar<strong>at</strong> Forge ltd industrials 64 905 151 0.98% 0.98%<br />
bhar<strong>at</strong> Petroleum Corp ltd oil & Gas 122 572 682 0.63% 0.63%<br />
bharti airtel ltd telecommunic<strong>at</strong>ions 236 791 215 0.16% 0.16%<br />
bombay Dyeing & manufacturing Co ltd Consumer Goods 81 410 289 5.17% 5.17%<br />
Cadila Healthcare ltd Health Care 43 910 754 0.27% 0.27%<br />
Cairn india ltd oil & Gas 44 725 283 0.07% 0.07%<br />
Canara bank Financials 24 168 782 0.13% 0.13%<br />
Chambal Fertilizers & Chemicals ltd basic m<strong>at</strong>erials 63 950 703 1.81% 1.81%<br />
Cipla ltd/india Health Care 113 599 921 0.39% 0.39%<br />
CmC ltd technology 46 896 485 1.74% 1.74%<br />
Colg<strong>at</strong>e-Palmolive india ltd Consumer Goods 26 498 852 0.18% 0.18%<br />
Container Corp <strong>of</strong> india industrials 169 883 263 1.39% 1.39%<br />
Coromandel intern<strong>at</strong>ional ltd basic m<strong>at</strong>erials 15 463 838 0.18% 0.18%<br />
Crompton Greaves ltd industrials 125 814 134 1.38% 1.38%<br />
Cummins india ltd Consumer Goods 80 960 163 0.74% 0.74%<br />
Dr reddy’s labor<strong>at</strong>ories ltd Health Care 19 926 786 0.07% 0.07%<br />
eiD Parry india ltd Consumer Goods 45 401 208 1.23% 1.23%<br />
essar shipping ltd industrials 56 684 0.01% 0.01%<br />
Gail india ltd oil & Gas 218 788 791 0.40% 0.40%<br />
G<strong>at</strong>eway Distriparks ltd industrials 54 624 944 3.40% 3.40%<br />
Gay<strong>at</strong>ri Projects ltd industrials 946 573 0.74% 0.74%<br />
GlaxosmithKline Pharmaceuticals ltd Health Care 26 639 023 0.14% 0.14%<br />
Gmr infrastructure ltd utilities 45 554 483 0.50% 0.50%<br />
Godrej industries ltd Consumer Goods 107 424 970 1.76% 1.76%<br />
Godrej Properties ltd Financials 26 699 820 0.56% 0.56%<br />
Gujar<strong>at</strong> mineral Development Corp ltd basic m<strong>at</strong>erials 83 165 248 1.44% 1.44%<br />
Gujar<strong>at</strong> narmada valley Fertilizers Co ltd basic m<strong>at</strong>erials 3 826 840 0.29% 0.29%<br />
Gujar<strong>at</strong> Pipavav Port ltd industrials 36 911 945 1.45% 1.45%<br />
Gujar<strong>at</strong> st<strong>at</strong>e Fertilisers & Chemicals ltd basic m<strong>at</strong>erials 11 061 632 0.37% 0.37%<br />
Gujar<strong>at</strong> st<strong>at</strong>e Petronet ltd oil & Gas 32 214 <strong>31</strong>3 0.66% 0.66%<br />
GvK Power & infrastructure ltd utilities 12 034 895 0.59% 0.59%<br />
H<strong>at</strong>hway Cable and D<strong>at</strong>acom ltd Consumer services 27 307 262 1.54% 1.54%<br />
HDFC bank ltd Financials 157 261 718 0.14% 0.14%<br />
Hindalco industries ltd basic m<strong>at</strong>erials 41 741 600 0.17% 0.17%<br />
Hindustan unilever ltd Consumer Goods 572 976 876 0.58% 0.58%<br />
Housing Development Finance Corp Financials 162 795 499 0.15% 0.15%<br />
iCiCi bank ltd Financials 78 922 561 0.09% 0.09%<br />
idea Cellular ltd telecommunic<strong>at</strong>ions 29 656 879 0.10% 0.10%<br />
indiabulls Power ltd utilities 108 422 342 5.61% 5.61%<br />
indian Hotels Co ltd Consumer services 116 002 037 2.50% 2.50%<br />
info edge india ltd Consumer services 40 165 175 1.15% 1.15%<br />
infosys ltd technology 187 487 679 0.10% 0.10%<br />
infrastructure Development Finance Co ltd Financials 21 946 616 0.15% 0.15%<br />
inG vysya bank ltd Financials 73 008 682 1.49% 1.49%<br />
irb infrastructure Developers ltd industrials 43 524 286 0.89% 0.89%<br />
ivrCl ltd industrials 80 244 538 9.47% 9.47%<br />
voting<br />
ownership<br />
sector<br />
market value<br />
(noK)<br />
Jain irrig<strong>at</strong>ion systems ltd industrials 42 381 716 1.16% 1.46%<br />
Jaiprakash associ<strong>at</strong>es ltd industrials 279 120 227 2.23% 2.23%<br />
Jaiprakash Power ventures ltd utilities 62 651 921 0.61% 0.61%<br />
Jb Chemicals & Pharmaceuticals ltd Health Care 7 090 003 1.17% 1.17%<br />
Jindal saw ltd basic m<strong>at</strong>erials 15 583 085 0.38% 0.38%<br />
Jindal stainless ltd basic m<strong>at</strong>erials 1 139 293 0.07% 0.07%<br />
Kotak mahindra bank ltd Financials 261 107 932 0.73% 0.73%<br />
KPit Cummins infosystems ltd technology 24 340 166 1.67% 1.67%<br />
l&t Finance <strong>Holding</strong>s ltd Financials 18 993 843 0.23% 0.23%<br />
lanco infr<strong>at</strong>ech ltd utilities 222 266 819 8.65% 8.65%<br />
larsen & toubro ltd industrials 113 029 092 0.17% 0.17%<br />
lupin ltd Health Care 382 692 945 1.70% 1.70%<br />
maharashtra seamless ltd basic m<strong>at</strong>erials 1 724 869 0.07% 0.07%<br />
mahindra & mahindra Financial services ltd Financials 22 606 578 0.32% 0.32%<br />
mahindra & mahindra ltd industrials 76 107 224 0.16% 0.16%<br />
maruti suzuki india ltd Consumer Goods 200 194 801 0.67% 0.67%<br />
monnet isp<strong>at</strong> & energy ltd basic m<strong>at</strong>erials 37 058 106 1.41% 1.41%<br />
mundra Port and special economic Zone ltd industrials 13 763 738 0.05% 0.05%<br />
nava bhar<strong>at</strong> ventures ltd basic m<strong>at</strong>erials <strong>31</strong> 689 707 1.71% 1.71%<br />
nCC ltd/india industrials 79 989 059 8.29% 8.29%<br />
nestle india ltd Consumer Goods 43 274 409 0.10% 0.10%<br />
nHPC ltd utilities 15 019 537 0.06% 0.06%<br />
niit ltd industrials 20 154 988 2.96% 2.96%<br />
nmDC ltd basic m<strong>at</strong>erials 49 <strong>31</strong>1 564 0.07% 0.07%<br />
ntPC ltd utilities 73 330 561 0.05% 0.05%<br />
oil & n<strong>at</strong>ural Gas Corp ltd oil & Gas 210 961 667 0.09% 0.09%<br />
Power Finance Corp ltd Financials 100 <strong>31</strong>6 504 0.49% 0.49%<br />
Praj industries ltd industrials 76 209 800 4.89% 4.89%<br />
PtC india ltd utilities 37 325 890 2.90% 2.90%<br />
ranbaxy labor<strong>at</strong>ories ltd Health Care 24 079 367 0.13% 0.13%<br />
raymond ltd Consumer Goods 32 827 364 1.54% 1.54%<br />
redington india ltd technology 18 902 236 0.52% 0.52%<br />
reliance industries ltd oil & Gas 644 551 367 0.25% 0.25%<br />
reliance infrastructure ltd utilities 28 535 677 0.28% 0.28%<br />
s Kumars n<strong>at</strong>ionwide ltd Consumer Goods 11 498 143 1.52% 1.52%<br />
shiv-vani oil & Gas explor<strong>at</strong>ion services ltd oil & Gas 1 902 282 0.20% 0.20%<br />
siemens ltd/india industrials 45 883 439 0.19% 0.19%<br />
sintex industries ltd industrials 10 286 880 0.53% 0.53%<br />
sKs micr<strong>of</strong>inance ltd Financials 7 839 671 1.03% 1.03%<br />
st<strong>at</strong>e bank <strong>of</strong> india Financials 128 057 993 0.11% 0.11%<br />
suzlon energy ltd oil & Gas 5 133 068 0.14% 0.14%<br />
t<strong>at</strong>a Chemicals ltd basic m<strong>at</strong>erials 159 797 885 1.79% 1.79%<br />
t<strong>at</strong>a Consultancy services ltd technology 346 816 491 0.14% 0.14%<br />
t<strong>at</strong>a <strong>Global</strong> beverages ltd Consumer Goods 190 674 106 3.05% 3.05%<br />
t<strong>at</strong>a motors ltd industrials 190 457 288 0.32% 0.33%<br />
t<strong>at</strong>a Power Co ltd utilities 125 908 630 0.54% 0.54%<br />
t<strong>at</strong>a steel ltd basic m<strong>at</strong>erials 154 538 596 0.43% 0.43%<br />
thermax ltd industrials 21 520 546 0.41% 0.41%<br />
titan industries ltd Consumer Goods 28 681 603 0.17% 0.17%<br />
trent ltd Consumer services 33 677 138 1.44% 1.44%<br />
ultr<strong>at</strong>ech Cement ltd industrials 145 816 606 0.41% 0.41%<br />
unitech ltd Financials 66 658 726 1.17% 1.17%<br />
united spirits ltd Consumer Goods 110 375 162 1.53% 1.53%<br />
usha martin ltd basic m<strong>at</strong>erials 555 019 0.07% 0.07%<br />
voltas ltd industrials 101 868 746 3.73% 3.73%<br />
Wipro ltd technology 106 615 386 0.10% 0.10%<br />
Zee entertainment enterprises ltd Consumer services 222 753 271 1.72% 1.72%<br />
Zuari industries ltd basic m<strong>at</strong>erials 21 332 114 1.42% 1.42%<br />
iNdONEsiA<br />
alam sutera realty tbk Pt Financials 32 255 521 0.60% 0.60%<br />
astra intern<strong>at</strong>ional tbk Pt Consumer Goods 1 385 424 627 0.70% 0.70%<br />
bank mandiri tbk Pt Financials 664 519 919 0.64% 0.64%<br />
bank negara indonesia Persero tbk Pt Financials 371 694 139 0.80% 0.80%<br />
bumi resources minerals tbk Pt basic m<strong>at</strong>erials 1 847 053 0.02% 0.02%<br />
bumi resources tbk Pt basic m<strong>at</strong>erials 689 728 372 2.32% 2.32%<br />
Ciputra Development tbk Pt Financials 105 029 582 1.95% 1.95%<br />
Delta Dunia makmur tbk Pt basic m<strong>at</strong>erials 29 507 296 0.82% 0.82%<br />
Harum energy tbk Pt basic m<strong>at</strong>erials 42 873 197 0.35% 0.35%<br />
ind<strong>of</strong>ood CbP sukses makmur tbK Pt Consumer Goods 66 288 309 0.33% 0.33%<br />
ind<strong>of</strong>ood sukses makmur tbk Pt Consumer Goods 158 646 638 0.60% 0.60%<br />
sarana menara nusantara Pt telecommunic<strong>at</strong>ions 59 950 008 0.94% 0.94%<br />
telekomunikasi indonesia tbk Pt telecommunic<strong>at</strong>ions 101 253 800 0.11% 0.11%<br />
united tractors tbk Pt industrials 633 702 377 0.98% 0.98%<br />
Xl axi<strong>at</strong>a tbk Pt telecommunic<strong>at</strong>ions 84 210 547 0.33% 0.33%<br />
iRELANd<br />
aer lingus Consumer services 21 341 141 0.82% 0.82%<br />
allied irish banks PlC Financials 7 419 653 0.05% 0.05%<br />
amarin Corp PlC Health Care 82 9<strong>31</strong> 809 1.37% 1.37%<br />
C&C Group PlC Consumer Goods 175 248 3<strong>31</strong> 2.33% 2.33%<br />
DCC PlC industrials 275 533 806 2.33% 2.33%<br />
elan Corp PlC Health Care 1 033 048 577 2.13% 2.13%<br />
FbD <strong>Holding</strong>s PlC Financials 25 950 232 1.55% 1.55%<br />
Fyffes PlC Consumer Goods 412 327 0.05% 0.05%<br />
Glanbia PlC Consumer Goods 113 412 563 1.07% 1.07%<br />
Governor & Co <strong>of</strong> the bank <strong>of</strong> ireland/the Financials 365 060 103 1.90% 1.90%<br />
Grafton Group PlC industrials 94 932 708 2.21% 2.21%<br />
Greencore Group PlC Consumer Goods 35 221 909 1.88% 1.88%<br />
independent news & media PlC Consumer services 5 227 354 0.60% 0.60%<br />
irish bank resolution Corp ltd Financials 6 792 1.14% 1.14%<br />
irish life & Permanent Group <strong>Holding</strong>s PlC Financials 130 246 0.26% 0.26%<br />
Kerry Group PlC Consumer Goods 495 806 587 1.29% 1.29%<br />
Country associ<strong>at</strong>ion according to Ftse (the benchmark provider for <strong>equities</strong>). if a company is not in the benchmark, the country <strong>of</strong> incorpor<strong>at</strong>ion is listed. sector classific<strong>at</strong>ion according to iCb (the industry Classific<strong>at</strong>ion<br />
benchmark company).<br />
voting<br />
ownership<br />
HOLdiNgs<br />
16<br />
<strong>Government</strong> <strong>Pension</strong> FunD <strong>Global</strong> ANNUAL REPORT 2011
<strong>Government</strong> <strong>Pension</strong> <strong>Fund</strong> <strong>Global</strong> <strong>Holding</strong> <strong>of</strong> <strong>equities</strong> <strong>at</strong> <strong>31</strong> December 2011<br />
sector<br />
market value<br />
(noK)<br />
Kingspan Group PlC industrials 186 546 592 2.27% 2.27%<br />
Paddy Power PlC Consumer services 272 708 659 1.61% 1.61%<br />
Providence resources PlC oil & Gas 12 328 516 1.30% 1.30%<br />
ryanair <strong>Holding</strong>s PlC Consumer services 450 381 862 1.09% 1.09%<br />
san leon energy PlC oil & Gas 942 893 0.11% 0.11%<br />
smurfit Kappa Group PlC industrials 772 807 191 9.62% 9.62%<br />
total Produce PlC Consumer services 394 740 0.04% 0.04%<br />
united Drug PlC Consumer services 81 216 466 2.14% 2.14%<br />
W<strong>at</strong>erford Wedgwood PlC Consumer Goods 10 567 0.02% 0.02%<br />
isRAEL<br />
africa israel Properties ltd Financials 1 444 064 0.13% 0.13%<br />
allot Communic<strong>at</strong>ions ltd technology 6 503 774 0.23% 0.23%<br />
alon <strong>Holding</strong>s blue square israel ltd Consumer services 1 532 419 0.10% 0.10%<br />
alony Hetz Properties & investments ltd Financials 10 885 976 0.34% 0.34%<br />
alvarion ltd technology 1 263 552 0.41% 0.41%<br />
amot investments ltd Financials 4 915 604 0.15% 0.15%<br />
audioCodes ltd technology 7 536 136 0.81% 0.81%<br />
azrieli Group Financials <strong>31</strong> 518 830 0.19% 0.19%<br />
b Communic<strong>at</strong>ions ltd technology 13 721 979 0.53% 0.53%<br />
bank Hapoalim bm Financials 126 764 595 0.49% 0.49%<br />
bank leumi le-israel bm Financials 166 655 007 0.66% 0.66%<br />
bezeq the israeli telecommunic<strong>at</strong>ion<br />
Corp ltd telecommunic<strong>at</strong>ions 203 888 500 0.69% 0.69%<br />
Cellcom israel ltd telecommunic<strong>at</strong>ions 33 567 074 0.34% 0.34%<br />
Ceragon networks ltd technology 10 860 019 0.70% 0.70%<br />
Clal industries and investments ltd industrials 9 249 534 0.21% 0.21%<br />
Clal insurance enterprises <strong>Holding</strong>s ltd Financials 14 234 425 0.29% 0.29%<br />
Delek automotive systems ltd Consumer services 6 214 756 0.19% 0.19%<br />
Delek Group ltd Financials 35 047 661 0.28% 0.28%<br />
Delek real est<strong>at</strong>e ltd Financials 969 037 0.80% 0.80%<br />
Discount investment Corp Financials 6 189 938 0.20% 0.20%<br />
elbit imaging ltd Financials 1 125 147 0.33% 0.33%<br />
elco <strong>Holding</strong>s ltd Consumer Goods 1 419 200 0.19% 0.19%<br />
electra ltd/israel industrials 3 572 773 0.22% 0.22%<br />
emblaze ltd technology 19 519 134 3.53% 3.53%<br />
evogene ltd basic m<strong>at</strong>erials 4 679 154 0.55% 0.55%<br />
eZchip semiconductor ltd technology 29 752 217 0.65% 0.65%<br />
First intern<strong>at</strong>ional bank <strong>of</strong> israel ltd Financials 3 360 728 0.06% 0.06%<br />
Fms enterprises migun ltd industrials 6 791 149 0.84% 0.84%<br />
Frutarom industries ltd basic m<strong>at</strong>erials 10 148 664 0.33% 0.33%<br />
Gazit-Globe ltd Financials 30 340 151 0.33% 0.33%<br />
Gil<strong>at</strong> s<strong>at</strong>ellite networks ltd technology 4 768 570 0.50% 0.50%<br />
Given imaging ltd Health Care 76 389 487 2.43% 2.43%<br />
Granite Hacarmel investments ltd Financials 4 059 279 0.38% 0.38%<br />
Hadera Paper ltd basic m<strong>at</strong>erials 5 046 335 0.43% 0.43%<br />
Harel insurance investments & Financial<br />
services ltd Financials 9 290 586 0.20% 0.20%<br />
Hot telecommunic<strong>at</strong>ion system ltd Consumer services 10 557 900 0.18% 0.18%<br />
iDb <strong>Holding</strong> Corp ltd industrials 6 <strong>31</strong>1 027 0.27% 0.27%<br />
internet Gold-Golden lines ltd telecommunic<strong>at</strong>ions 9 1<strong>31</strong> 134 0.71% 0.71%<br />
israel Chemicals ltd basic m<strong>at</strong>erials 281 343 958 0.36% 0.36%<br />
israel Corp ltd/the basic m<strong>at</strong>erials 57 349 787 0.20% 0.20%<br />
israel Discount bank ltd Financials 41 985 008 0.50% 0.50%<br />
ituran loc<strong>at</strong>ion and Control ltd technology 12 856 619 0.75% 0.75%<br />
Jerusalem economy ltd Financials 8 727 784 0.29% 0.29%<br />
Koor industries ltd basic m<strong>at</strong>erials 7 694 146 0.24% 0.24%<br />
mellanox technologies ltd technology 45 504 683 0.60% 0.60%<br />
menorah mivtachim <strong>Holding</strong>s ltd Financials 8 602 785 0.30% 0.30%<br />
migdal insurance & Financial <strong>Holding</strong> ltd Financials 11 827 091 0.14% 0.14%<br />
mizrahi tefahot bank ltd Financials 36 233 358 0.34% 0.34%<br />
niCe systems ltd technology 82 644 218 0.64% 0.64%<br />
nitsba <strong>Holding</strong>s 1995 ltd Financials 11 058 506 0.40% 0.40%<br />
nova measuring instruments ltd technology 4 493 468 0.38% 0.38%<br />
oil refineries ltd oil & Gas 19 240 184 0.26% 0.26%<br />
orm<strong>at</strong> industries utilities 8 786 032 0.26% 0.26%<br />
osem investments ltd Consumer Goods 25 628 395 0.27% 0.27%<br />
Partner Communic<strong>at</strong>ions Co ltd telecommunic<strong>at</strong>ions 26 498 036 0.32% 0.32%<br />
Paz oil Co ltd oil & Gas 15 719 022 0.21% 0.21%<br />
Phoenix <strong>Holding</strong>s ltd/the Financials 4 979 252 0.14% 0.14%<br />
Property & building Corp Financials 2 054 191 0.14% 0.14%<br />
Queenco leisure intern<strong>at</strong>ional ltd Consumer services 387 0.00% 0.00%<br />
retalix ltd technology 11 898 769 0.51% 0.51%<br />
shikun & binui ltd industrials 8 550 <strong>31</strong>6 0.22% 0.22%<br />
shufersal ltd Consumer services 9 212 291 0.20% 0.20%<br />
strauss Group ltd Consumer Goods 15 453 518 0.20% 0.20%<br />
teva Pharmaceutical industries ltd Health Care 1 647 346 899 0.73% 0.73%<br />
tower semiconductor ltd technology 7 137 492 0.63% 0.63%<br />
iTALy<br />
a2a spa utilities 189 666 441 1.08% 1.08%<br />
aCea spa utilities 77 712 216 0.96% 0.96%<br />
aeroporto di venezia marco Polo spa - save industrials 10 237 874 0.38% 0.38%<br />
alitalia spa Consumer services 196 0.02% 0.02%<br />
amplifon spa Health Care 54 340 510 0.97% 0.97%<br />
ansaldo sts spa industrials 138 840 129 1.74% 1.74%<br />
arnoldo mondadori editore spa Consumer services 39 678 250 1.54% 1.54%<br />
ascopiave spa utilities 10 744 713 0.44% 0.44%<br />
assicurazioni Generali spa Financials 2 046 359 876 1.46% 1.46%<br />
astaldi spa industrials 60 894 892 1.61% 1.61%<br />
<strong>at</strong>lantia spa industrials 1 641 858 892 2.72% 2.72%<br />
autogrill spa Consumer services 181 747 445 1.22% 1.22%<br />
autostrada torino-milano spa industrials 67 663 009 1.33% 1.33%<br />
voting<br />
ownership<br />
sector<br />
market value<br />
(noK)<br />
azimut <strong>Holding</strong> spa Financials 112 485 834 1.64% 1.64%<br />
banca Carige spa Financials 177 988 174 0.96% 0.87%<br />
banca Generali spa Financials 70 354 630 1.13% 1.13%<br />
banca iFis spa Financials 20 825 750 1.25% 1.25%<br />
banca monte dei Paschi di siena spa Financials 198 874 252 0.88% 0.88%<br />
banca Piccolo Credito valtellinese scarl Financials 69 683 645 1.90% 1.90%<br />
banca Popolare dell’emilia romagna scrl Financials 270 411 985 2.17% 2.17%<br />
banca Popolare dell’etruria e del lazio Financials 10 646 866 1.63% 1.63%<br />
banca Popolare di milano scarl Financials 192 064 826 2.50% 2.50%<br />
banca Popolare di sondrio sCarl Financials 228 207 609 1.54% 1.54%<br />
banco di Desio e della brianza spa Financials 13 406 418 0.50% 0.45%<br />
banco Popolare sC Financials 305 499 939 2.24% 2.24%<br />
basicnet spa Consumer Goods 52 017 392 5.18% 5.18%<br />
benetton Group spa Consumer Goods 50 659 634 1.21% 1.21%<br />
biesse spa industrials 5 565 886 0.92% 0.92%<br />
brembo spa Consumer Goods 43 164 752 1.26% 1.26%<br />
buzzi unicem spa industrials 126 260 661 1.23% 1.35%<br />
Cam Finanziaria spa Financials 9 781 194 0.83% 0.83%<br />
Cementir <strong>Holding</strong> spa industrials 17 851 114 0.91% 0.91%<br />
Cir-Compagnie industriali riunite spa industrials 138 091 795 1.82% 1.82%<br />
C<strong>of</strong>ide spa industrials <strong>31</strong> 661 015 1.02% 1.02%<br />
Conafi Prestito sPa Financials 1 169 308 0.54% 0.54%<br />
Credito emiliano spa Financials 75 756 892 1.07% 1.07%<br />
Danieli & C <strong>of</strong>ficine meccaniche spa industrials 120 054 889 0.57% 2.03%<br />
D<strong>at</strong>alogic spa industrials 9 385 551 0.36% 0.36%<br />
Davide Campari-milano spa Consumer Goods 183 015 090 0.79% 0.79%<br />
Dea Capital spa Financials 9 066 753 0.29% 0.29%<br />
De’longhi spa Consumer Goods 67 696 028 0.86% 0.86%<br />
Diasorin spa Health Care 160 712 487 1.91% 1.91%<br />
edison spa utilities 74 232 809 0.23% 0.22%<br />
ei towers technology 26 759 824 1.63% 1.63%<br />
enel Green Power spa utilities 379 524 244 0.61% 0.61%<br />
enel spa utilities 2 956 549 482 1.29% 1.29%<br />
eni spa oil & Gas 7 525 979 991 1.51% 1.51%<br />
erG spa oil & Gas 120 098 444 1.17% 1.17%<br />
esprinet spa technology 11 149 447 1.05% 1.05%<br />
exor spa Financials 460 836 005 1.66% 1.60%<br />
Falck renewables spa utilities 24 915 395 1.30% 1.30%<br />
Fi<strong>at</strong> industrial spa industrials 880 685 289 1.39% 1.36%<br />
Fi<strong>at</strong> spa Consumer Goods 503 954 637 1.50% 1.44%<br />
Fiera milano spa industrials 3 428 922 0.29% 0.29%<br />
Fondiaria-sai spa Financials 40 973 171 0.72% 2.69%<br />
Gemina spa industrials 172 701 257 2.54% 2.54%<br />
Geox spa Consumer Goods 40 444 268 0.93% 0.93%<br />
Gruppo editoriale l’espresso spa Consumer services 33 377 648 0.97% 0.97%<br />
Hera spa utilities 94 464 809 0.99% 0.99%<br />
immsi spa Consumer Goods 14 743 195 0.99% 0.99%<br />
impregilo spa industrials 130 417 570 1.75% 1.74%<br />
indesit Co spa Consumer Goods <strong>31</strong> 163 172 0.95% 0.95%<br />
industria macchine autom<strong>at</strong>iche spa industrials 24 285 955 0.64% 0.64%<br />
interpump Group spa industrials 65 914 077 1.68% 1.68%<br />
intesa sanpaolo spa Financials 2 <strong>31</strong>4 077 855 1.43% 1.42%<br />
iren spa utilities 86 985 302 1.<strong>31</strong>% 1.21%<br />
italcementi spa industrials 101 482 477 1.21% 1.36%<br />
italmobiliare spa industrials 28 424 845 0.45% 0.84%<br />
Juventus Football Club spa Consumer services 39 719 0.00% 0.00%<br />
Kme Group spa basic m<strong>at</strong>erials 2 615 013 0.25% 0.23%<br />
landi renzo spa Consumer Goods 9 366 555 0.88% 0.88%<br />
lottom<strong>at</strong>ica spa Consumer services 106 510 108 0.69% 0.69%<br />
luxottica Group spa Consumer Goods 503 615 0<strong>31</strong> 0.64% 0.64%<br />
maire tecnimont spa oil & Gas 29 908 110 1.21% 1.21%<br />
mariella burani spa Consumer Goods 197 0.85% 0.85%<br />
marr spa Consumer services 40 007 874 1.20% 1.20%<br />
mediaset spa Consumer services 175 428 113 0.90% 0.90%<br />
mediobanca spa Financials <strong>31</strong>9 140 005 1.08% 1.08%<br />
mediolanum spa Financials 122 024 634 0.71% 0.71%<br />
milano assicurazioni sPa Financials 64 189 468 1.98% 1.90%<br />
mittel spa Financials 1 301 545 0.14% 0.14%<br />
Parmal<strong>at</strong> Finanziaria spa Consumer Goods 116 0.02% 0.02%<br />
Parmal<strong>at</strong> spa Consumer Goods 51 414 067 0.28% 0.28%<br />
Piaggio & C spa Consumer Goods 89 474 033 1.71% 1.71%<br />
Pirelli & C spa Consumer Goods 205 952 583 0.86% 0.84%<br />
Poltrona Frau spa Consumer Goods 3 553 953 0.37% 0.37%<br />
Prada spa Consumer Goods 291 780 257 0.42% 0.42%<br />
Prelios spa Financials 22 285 606 4.15% 4.15%<br />
Premafin Finanziaria spa Financials 2 027 443 0.46% 0.46%<br />
Prysmian spa industrials 529 086 026 3.32% 3.32%<br />
rCs mediaGroup spa Consumer services 18 756 996 0.48% 0.46%<br />
record<strong>at</strong>i spa Health Care 104 792 965 1.16% 1.16%<br />
sabaf spa industrials 3 814 805 0.38% 0.38%<br />
saes Getters spa industrials 11 376 235 1.11% 1.17%<br />
safilo Group spa Consumer Goods 48 993 462 2.28% 2.28%<br />
saipem spa oil & Gas 1 963 904 752 1.75% 1.75%<br />
saras spa oil & Gas 68 045 947 0.96% 0.96%<br />
screen service broadcasting<br />
technologies spa technology 8 620 551 1.64% 1.64%<br />
snai spa Consumer services 10 987 357 0.61% 0.61%<br />
snam rete Gas spa utilities 557 750 774 0.59% 0.59%<br />
societa C<strong>at</strong>tolica di assicurazioni sCrl Financials 108 726 014 1.80% 1.80%<br />
societa inizi<strong>at</strong>ive autostradali e servizi spa industrials 70 542 497 0.69% 0.69%<br />
sogefi spa Consumer Goods 174 566 0.01% 0.01%<br />
Country associ<strong>at</strong>ion according to Ftse (the benchmark provider for <strong>equities</strong>). if a company is not in the benchmark, the country <strong>of</strong> incorpor<strong>at</strong>ion is listed. sector classific<strong>at</strong>ion according to iCb (the industry Classific<strong>at</strong>ion<br />
benchmark company).<br />
voting<br />
ownership<br />
HOLdiNgs<br />
17<br />
<strong>Government</strong> <strong>Pension</strong> FunD <strong>Global</strong> ANNUAL REPORT 2011
<strong>Government</strong> <strong>Pension</strong> <strong>Fund</strong> <strong>Global</strong> <strong>Holding</strong> <strong>of</strong> <strong>equities</strong> <strong>at</strong> <strong>31</strong> December 2011<br />
sector<br />
market value<br />
(noK)<br />
sol spa basic m<strong>at</strong>erials 449 872 0.02% 0.02%<br />
sorin spa Health Care 87 158 063 1.98% 1.98%<br />
tamburi investment Partners spa Financials 1 604 745 0.10% 0.10%<br />
telecom italia media spa Consumer services 10 662 508 0.59% 0.59%<br />
telecom italia spa telecommunic<strong>at</strong>ions 2 303 238 722 1.55% 1.99%<br />
tenaris sa basic m<strong>at</strong>erials 579 133 180 0.39% 0.44%<br />
terna rete elettrica nazionale spa utilities 550 149 484 1.36% 1.36%<br />
tod’s spa Consumer Goods 136 877 708 0.92% 0.92%<br />
trevi Finanziaria industriale spa industrials 28 820 286 1.08% 1.08%<br />
uniCredit spa Financials 1 520 908 714 1.59% 1.58%<br />
unione di banche italiane sCPa Financials 529 872 218 2.40% 2.40%<br />
unipol Gruppo Finanziario spa Financials 124 958 153 2.48% 2.48%<br />
vittoria assicurazioni spa Financials 7 578 179 0.48% 0.48%<br />
Yoox spa Consumer services 66 998 378 1.95% 1.95%<br />
Zignago vetro spa industrials 7 090 678 0.25% 0.25%<br />
JAPAN<br />
3-D m<strong>at</strong>rix ltd Health Care 20 784 662 2.55% 2.55%<br />
77 bank ltd/the Financials 59 976 424 0.61% 0.61%<br />
abC-mart inc Consumer Goods 77 464 860 0.45% 0.45%<br />
accordia Golf Co ltd Consumer services 105 340 880 2.33% 2.33%<br />
achilles Corp/Japan basic m<strong>at</strong>erials 2 842 417 0.18% 0.18%<br />
acom Co ltd Financials 32 733 942 0.19% 0.19%<br />
aDeKa Corp basic m<strong>at</strong>erials 78 812 <strong>31</strong>0 1.30% 1.30%<br />
aderans Co ltd Consumer Goods 8 224 276 0.27% 0.27%<br />
advan Co ltd industrials 1 580 770 0.11% 0.11%<br />
advantest Corp technology 52 762 335 0.47% 0.47%<br />
aeon Co ltd Consumer services <strong>31</strong>4 805 189 0.48% 0.48%<br />
aeon Credit service Co ltd Financials 100 932 477 0.68% 0.68%<br />
aeon Delight Co ltd industrials 15 060 107 0.23% 0.23%<br />
aeon Fantasy Co ltd Consumer services 4 081 802 0.23% 0.23%<br />
aeon mall Co ltd Financials 73 876 141 0.32% 0.32%<br />
ai <strong>Holding</strong>s Corp technology 274 717 0.02% 0.02%<br />
aica Kogyo Co ltd industrials 24 385 444 0.45% 0.45%<br />
aichi bank ltd/the Financials 10 862 693 0.29% 0.29%<br />
aichi Corp industrials 1 703 937 0.09% 0.09%<br />
aichi machine industry Co ltd Consumer Goods 211 756 0.01% 0.01%<br />
aichi steel Corp basic m<strong>at</strong>erials 13 966 430 0.23% 0.23%<br />
aida engineering ltd industrials 3 706 893 0.17% 0.17%<br />
aiful Corp Financials 9 063 818 0.45% 0.45%<br />
ain Pharmaciez inc Consumer services 19 716 574 0.43% 0.43%<br />
aiphone Co ltd industrials 10 393 293 0.44% 0.44%<br />
air W<strong>at</strong>er inc basic m<strong>at</strong>erials 89 697 652 0.60% 0.60%<br />
airport Facilities Co ltd Financials 14 926 732 1.14% 1.14%<br />
aisan industry Co ltd Consumer Goods 1 757 474 0.07% 0.07%<br />
aisin seiki Co ltd Consumer Goods 160 922 615 0.32% 0.32%<br />
ajinomoto Co inc Consumer Goods 171 724 <strong>31</strong>0 0.35% 0.35%<br />
akebono brake industry Co ltd Consumer Goods 16 749 105 0.48% 0.48%<br />
akita bank ltd/the Financials 11 <strong>31</strong>3 353 0.34% 0.34%<br />
alfresa <strong>Holding</strong>s Corp Health Care 60 811 347 0.46% 0.46%<br />
all nippon airways Co ltd Consumer services 90 873 419 0.22% 0.22%<br />
alpen Co ltd Consumer services 3 794 194 0.09% 0.09%<br />
alpha systems inc technology 146 445 0.01% 0.01%<br />
alpine electronics inc Consumer Goods 17 007 998 0.38% 0.38%<br />
alps electric Co ltd industrials 36 740 559 0.49% 0.49%<br />
alps logistics Co ltd industrials 9 395 232 0.94% 0.94%<br />
amada Co ltd industrials 69 321 048 0.46% 0.46%<br />
amano Corp industrials 19 634 664 0.45% 0.45%<br />
anritsu Corp technology 41 373 236 0.49% 0.49%<br />
aoC <strong>Holding</strong>s inc oil & Gas 404 834 0.01% 0.01%<br />
aoKi <strong>Holding</strong>s inc Consumer services 10 424 288 0.23% 0.23%<br />
aomori bank ltd/the Financials 11 811 794 0.<strong>31</strong>% 0.<strong>31</strong>%<br />
aoyama trading Co ltd Consumer services 25 101 598 0.33% 0.33%<br />
aozora bank ltd Financials 216 124 182 0.80% 0.80%<br />
arakawa Chemical industries ltd basic m<strong>at</strong>erials 1 761 685 0.17% 0.17%<br />
arc land sakamoto Co ltd Consumer services 25 018 493 1.08% 1.08%<br />
arcs Co ltd Consumer services 22 397 048 0.39% 0.39%<br />
ariake Japan Co ltd Consumer Goods 11 810 119 0.<strong>31</strong>% 0.<strong>31</strong>%<br />
arisawa manufacturing Co ltd basic m<strong>at</strong>erials 1 459 704 0.19% 0.19%<br />
arnest one Corp Financials 4 510 014 0.11% 0.11%<br />
as one Corp Health Care 2 238 237 0.09% 0.09%<br />
asahi Co ltd Consumer services 29 886 476 0.89% 0.89%<br />
asahi Diamond industrial Co ltd industrials 54 268 398 1.27% 1.27%<br />
asahi Glass Co ltd industrials 380 386 203 0.64% 0.64%<br />
asahi Group <strong>Holding</strong>s ltd Consumer Goods 36 729 273 0.06% 0.06%<br />
asahi <strong>Holding</strong>s inc basic m<strong>at</strong>erials 12 294 458 0.29% 0.29%<br />
asahi intecc Co ltd Health Care 6 147 493 0.26% 0.26%<br />
asahi Kasei Corp basic m<strong>at</strong>erials 329 198 775 0.65% 0.65%<br />
asahi organic Chemicals industry Co ltd basic m<strong>at</strong>erials 2 687 284 0.17% 0.17%<br />
as<strong>at</strong>su-DK inc Consumer services 22 093 857 0.<strong>31</strong>% 0.<strong>31</strong>%<br />
asics Corp Consumer Goods 98 466 521 0.73% 0.73%<br />
asKa Pharmaceutical Co ltd Health Care 248 678 0.02% 0.02%<br />
asKul Corp industrials 82 237 544 3.11% 3.11%<br />
astellas Pharma inc Health Care 548 190 443 0.48% 0.48%<br />
asunaro aoki Construction Co ltd industrials 879 524 0.06% 0.05%<br />
<strong>at</strong>sugi Co ltd Consumer Goods 2 968 617 0.22% 0.22%<br />
autobacs seven Co ltd Consumer services 43 357 692 0.46% 0.46%<br />
avex Group <strong>Holding</strong>s inc Consumer services 2 715 053 0.08% 0.08%<br />
awa bank ltd/the Financials 47 532 154 0.51% 0.51%<br />
axell Corp technology 132 506 0.01% 0.01%<br />
bando Chemical industries ltd basic m<strong>at</strong>erials 3 913 995 0.17% 0.17%<br />
bank <strong>of</strong> iw<strong>at</strong>e ltd/the Financials 17 512 451 0.36% 0.36%<br />
voting<br />
ownership<br />
sector<br />
market value<br />
(noK)<br />
bank <strong>of</strong> Kyoto ltd/the Financials 99 407 322 0.51% 0.51%<br />
bank <strong>of</strong> nagoya ltd/the Financials 10 742 775 0.27% 0.27%<br />
bank <strong>of</strong> okinawa ltd/the Financials 29 529 407 0.54% 0.54%<br />
bank <strong>of</strong> saga ltd/the Financials 4 640 791 0.18% 0.18%<br />
bank <strong>of</strong> the ryukyus ltd Financials 12 886 839 0.44% 0.44%<br />
bank <strong>of</strong> Yokohama ltd/the Financials 186 617 280 0.49% 0.49%<br />
bell-Park Co ltd Consumer services 11 008 308 2.09% 2.09%<br />
belluna Co ltd Consumer services 4 402 461 0.18% 0.18%<br />
benefit one inc industrials 18 382 372 1.97% 1.97%<br />
benesse <strong>Holding</strong>s inc Consumer services 145 370 704 0.48% 0.48%<br />
best Denki Co ltd Consumer services 2 030 685 0.16% 0.16%<br />
bic Camera inc Consumer services 4 510 813 0.08% 0.08%<br />
bml inc Health Care 5 929 167 0.19% 0.19%<br />
bridgestone Corp Consumer Goods 530 792 863 0.48% 0.48%<br />
brother industries ltd technology 130 833 419 0.64% 0.64%<br />
bunka shutter Co ltd industrials 2 499 651 0.17% 0.17%<br />
CaC Corp technology 13 839 066 1.<strong>31</strong>% 1.<strong>31</strong>%<br />
Calbee inc Consumer Goods 27 393 077 0.29% 0.29%<br />
Calsonic Kansei Corp Consumer Goods 16 004 252 0.17% 0.17%<br />
Canon electronics inc technology 17 506 168 0.28% 0.28%<br />
Canon inc technology 2 447 811 587 0.69% 0.69%<br />
Canon marketing Japan inc technology 35 302 743 0.33% 0.33%<br />
Capcom Co ltd technology 45 703 126 0.48% 0.48%<br />
Casio Computer Co ltd Consumer Goods 48 763 834 0.48% 0.48%<br />
Cawachi ltd Consumer services 48 120 355 1.62% 1.62%<br />
Central Glass Co ltd industrials 107 036 614 1.73% 1.73%<br />
Central Japan railway Co Consumer services 522 885 965 0.48% 0.48%<br />
Century tokyo leasing Corp industrials 27 274 057 0.23% 0.23%<br />
Chiba bank ltd/the Financials 167 866 514 0.49% 0.49%<br />
Chiba Kogyo bank ltd/the Financials 1 849 971 0.12% 0.12%<br />
Chiyoda Co ltd Consumer services 4 817 425 0.11% 0.11%<br />
Chiyoda Corp industrials 73 124 219 0.46% 0.46%<br />
Chiyoda integre Co ltd industrials 981 896 0.10% 0.10%<br />
Ch<strong>of</strong>u seisakusho Co ltd Consumer Goods 13 137 254 0.24% 0.24%<br />
Chori Co ltd Consumer Goods 1 033 959 0.06% 0.06%<br />
Chubu electric Power Co inc utilities 154 998 320 0.18% 0.18%<br />
Chudenko Corp industrials 9 295 249 0.23% 0.23%<br />
Chuetsu Pulp & Paper Co ltd basic m<strong>at</strong>erials 816 773 0.07% 0.07%<br />
Chugai Pharmaceutical Co ltd Health Care 141 251 141 0.26% 0.26%<br />
Chugai ro Co ltd industrials 4 809 110 0.28% 0.28%<br />
Chugoku bank ltd/the Financials 100 789 864 0.52% 0.52%<br />
Chugoku electric Power Co inc/the utilities 47 215 003 0.12% 0.12%<br />
Chugoku marine Paints ltd basic m<strong>at</strong>erials 8 509 797 0.33% 0.33%<br />
Chukyo bank ltd/the Financials 1 935 124 0.06% 0.06%<br />
Chuo Denki Kogyo Co ltd basic m<strong>at</strong>erials 17 545 812 1.79% 1.79%<br />
Chuo spring Co ltd Consumer Goods 126 588 0.01% 0.01%<br />
Circle K sunkus Co ltd Consumer services 26 860 429 0.32% 0.32%<br />
Citizen <strong>Holding</strong>s Co ltd Consumer Goods 59 171 456 0.49% 0.49%<br />
CKD Corp industrials 13 778 735 0.48% 0.48%<br />
Clarion Co ltd Consumer Goods 6 684 120 0.22% 0.22%<br />
Cleanup Corp Consumer Goods 1 252 463 0.07% 0.07%<br />
CmiC <strong>Holding</strong>s Co ltd Health Care 115 977 0.01% 0.01%<br />
CmK Corp/Japan industrials 6 309 242 0.53% 0.53%<br />
Coca-Cola Central Japan Co ltd Consumer Goods 2 406 975 0.07% 0.07%<br />
Coca-Cola West Co ltd Consumer Goods 38 075 699 0.33% 0.33%<br />
Cocokara fine inc Consumer services 24 500 974 0.62% 0.62%<br />
Colowide Co ltd Consumer services 3 245 676 0.10% 0.10%<br />
ComsYs <strong>Holding</strong>s Corp industrials 44 886 803 0.49% 0.49%<br />
Corona Corp Consumer Goods 6 881 557 0.25% 0.25%<br />
Cosel Co ltd industrials 10 209 197 0.<strong>31</strong>% 0.<strong>31</strong>%<br />
Cosmo oil Co ltd oil & Gas 66 206 703 0.47% 0.47%<br />
Cosmos Pharmaceutical Corp Consumer services 16 618 771 0.27% 0.27%<br />
Credit saison Co ltd Financials 212 134 926 0.96% 0.96%<br />
Cyberagent inc technology 7 080 755 0.06% 0.06%<br />
Cybozu inc technology 114 <strong>31</strong>9 0.01% 0.01%<br />
Dai nippon Printing Co ltd Consumer services 193 859 211 0.48% 0.48%<br />
Dai nippon toryo Co ltd basic m<strong>at</strong>erials 1 061 805 0.11% 0.11%<br />
Daibiru Corp Financials 11 855 790 0.27% 0.27%<br />
Daicel Corp basic m<strong>at</strong>erials 62 940 996 0.47% 0.47%<br />
Dai-Dan Co ltd industrials 2 365 384 0.12% 0.12%<br />
Daido metal Co ltd industrials 13 911 513 0.47% 0.47%<br />
Daido steel Co ltd basic m<strong>at</strong>erials 80 841 195 0.50% 0.50%<br />
Daidoh ltd Consumer Goods 2 <strong>31</strong>4 733 0.11% 0.11%<br />
Daiei inc/the Consumer services 4 421 581 0.17% 0.10%<br />
Daifuku Co ltd industrials 12 854 750 0.37% 0.37%<br />
Daih<strong>at</strong>su motor Co ltd Consumer Goods 132 367 487 0.29% 0.29%<br />
Daihen Corp industrials 71 985 391 2.55% 2.55%<br />
Daiichi Chuo KK industrials 1 900 374 0.09% 0.09%<br />
Daiichi Jitsugyo Co ltd industrials 6 933 961 0.51% 0.51%<br />
Daiichi Kigenso Kagaku-Kogyo Co ltd basic m<strong>at</strong>erials 10 579 460 0.91% 0.91%<br />
Dai-ichi life insurance Co ltd/the Financials 787 051 757 1.34% 1.34%<br />
Daiichi sankyo Co ltd Health Care 404 832 124 0.48% 0.48%<br />
Dai-ichi seiko Co ltd technology 4 601 <strong>31</strong>0 0.16% 0.16%<br />
Daiken Corp industrials 2 122 989 0.09% 0.09%<br />
Daikin industries ltd industrials 2<strong>31</strong> 323 264 0.48% 0.48%<br />
Daikoku Denki Co ltd Consumer services 73 510 0.01% 0.01%<br />
Daikokutenbussan Co ltd Consumer services 792 107 0.03% 0.03%<br />
Daikyo inc Financials 15 032 346 0.29% 0.29%<br />
Dainichiseika Color & Chemicals<br />
manufacturing Co ltd basic m<strong>at</strong>erials 2 202 107 0.09% 0.09%<br />
Dainippon screen manufacturing Co ltd technology 61 113 390 0.48% 0.48%<br />
Country associ<strong>at</strong>ion according to Ftse (the benchmark provider for <strong>equities</strong>). if a company is not in the benchmark, the country <strong>of</strong> incorpor<strong>at</strong>ion is listed. sector classific<strong>at</strong>ion according to iCb (the industry Classific<strong>at</strong>ion<br />
benchmark company).<br />
voting<br />
ownership<br />
HOLdiNgs<br />
18<br />
<strong>Government</strong> <strong>Pension</strong> FunD <strong>Global</strong> ANNUAL REPORT 2011
<strong>Government</strong> <strong>Pension</strong> <strong>Fund</strong> <strong>Global</strong> <strong>Holding</strong> <strong>of</strong> <strong>equities</strong> <strong>at</strong> <strong>31</strong> December 2011<br />
sector<br />
market value<br />
(noK)<br />
Dainippon sumitomo Pharma Co ltd Health Care 67 127 694 0.25% 0.25%<br />
Daio Paper Corp basic m<strong>at</strong>erials 22 992 509 0.43% 0.43%<br />
Daisan bank ltd/the Financials 2 500 117 0.11% 0.11%<br />
Daiseki Co ltd industrials 43 882 508 1.00% 1.00%<br />
Daishi bank ltd/the Financials <strong>31</strong> 929 386 0.45% 0.45%<br />
Daiso Co ltd basic m<strong>at</strong>erials 2 206 063 0.11% 0.11%<br />
Daisyo Corp Consumer services 1 250 423 0.08% 0.08%<br />
Daito trust Construction Co ltd industrials 265 661 254 0.64% 0.64%<br />
Daiwa House industry Co ltd Consumer Goods 207 971 638 0.49% 0.49%<br />
Daiwa industries ltd industrials 2 648 423 0.17% 0.17%<br />
Daiwa securities Group inc Financials 209 798 292 0.64% 0.64%<br />
Daiwabo <strong>Holding</strong>s Co ltd industrials 16 302 494 0.62% 0.62%<br />
DCm <strong>Holding</strong>s Co ltd Consumer services 13 300 873 0.19% 0.19%<br />
Dena Co ltd Consumer services 130 170 282 0.48% 0.48%<br />
Denki Kagaku Kogyo KK basic m<strong>at</strong>erials 74 542 752 0.67% 0.67%<br />
Denki Kogyo Co ltd technology 363 786 0.02% 0.02%<br />
Denso Corp Consumer Goods 985 837 949 0.68% 0.68%<br />
Dentsu inc Consumer services 57 885 958 0.11% 0.11%<br />
Denyo Co ltd industrials 3 649 300 0.18% 0.18%<br />
Descente ltd Consumer Goods 4 125 440 0.17% 0.17%<br />
DiC Corp basic m<strong>at</strong>erials 112 612 883 1.13% 1.13%<br />
Digital Garage inc technology 10 027 925 0.26% 0.26%<br />
Disco Corp industrials 32 700 007 0.<strong>31</strong>% 0.<strong>31</strong>%<br />
Don Quijote Co ltd Consumer services 78 745 324 0.50% 0.50%<br />
Doshisha Co ltd industrials 9 845 745 0.<strong>31</strong>% 0.<strong>31</strong>%<br />
Doutor nichires <strong>Holding</strong>s Co ltd Consumer services 74 125 032 1.86% 1.86%<br />
Dowa <strong>Holding</strong>s Co ltd basic m<strong>at</strong>erials 168 635 877 1.44% 1.44%<br />
Dr Ci:labo Co ltd Consumer Goods 30 556 385 0.38% 0.38%<br />
Dts Corp technology 30 635 852 1.75% 1.75%<br />
Duskin Co ltd Consumer services 50 460 049 0.64% 0.64%<br />
Dwango Co ltd technology 5 565 451 0.28% 0.28%<br />
Dydo Drinco inc Consumer Goods 5 441 275 0.14% 0.14%<br />
eaccess ltd technology 26 3<strong>31</strong> 805 0.54% 0.54%<br />
eagle industry Co ltd industrials 2 358 015 0.10% 0.10%<br />
earth Chemical Co ltd basic m<strong>at</strong>erials 8 1<strong>31</strong> 499 0.18% 0.18%<br />
east Japan railway Co Consumer services 733 012 256 0.48% 0.48%<br />
ebara Corp industrials 32 885 700 0.38% 0.38%<br />
eDion Corp Consumer services 22 290 441 0.43% 0.43%<br />
ehime bank ltd/the Financials 5 606 181 0.18% 0.18%<br />
eighteenth bank ltd/the Financials 4 673 757 0.17% 0.17%<br />
eiken Chemical Co ltd Health Care 47 855 916 2.71% 2.71%<br />
eisai Co ltd Health Care 362 075 691 0.49% 0.49%<br />
eizo nanao Corp technology 550 449 0.02% 0.02%<br />
electric Power Development Co ltd utilities 455 060 663 1.72% 1.72%<br />
elem<strong>at</strong>ec Corp industrials 6 264 874 0.30% 0.30%<br />
elpida memory inc technology 38 159 789 0.51% 0.51%<br />
enplas Corp industrials 11 057 850 0.44% 0.44%<br />
ePs Corp/Japan Health Care 2 138 130 0.10% 0.10%<br />
esPeC Corp industrials 1 461 225 0.17% 0.17%<br />
exedy Corp Consumer Goods 151 532 844 1.81% 1.81%<br />
ezaki Glico Co ltd Consumer Goods 38 332 483 0.39% 0.39%<br />
Familymart Co ltd Consumer services 114 681 288 0.49% 0.49%<br />
Fancl Corp Consumer Goods 130 802 <strong>31</strong>5 2.46% 2.46%<br />
FanuC Corp industrials 1 252 268 119 0.57% 0.57%<br />
Fast retailing Co ltd Consumer services 398 605 074 0.35% 0.35%<br />
FCC Co ltd Consumer Goods 9 935 590 0.16% 0.16%<br />
FDK Corp industrials 532 415 0.04% 0.04%<br />
Ferrotec Corp technology 58 207 044 3.39% 3.39%<br />
FiDea <strong>Holding</strong>s Co ltd Financials 3 519 338 0.16% 0.16%<br />
Foster electric Co ltd industrials 12 252 991 0.61% 0.61%<br />
FP Corp industrials 64 817 801 0.76% 0.76%<br />
France bed <strong>Holding</strong>s Co ltd Consumer Goods 2 549 449 0.10% 0.10%<br />
Fudo tetra Corp industrials 6 395 045 0.<strong>31</strong>% 0.<strong>31</strong>%<br />
Fuji Co ltd/ehime Consumer services 10 886 521 0.22% 0.22%<br />
Fuji electric Co ltd industrials 57 773 696 0.47% 0.47%<br />
Fuji electronics Co ltd technology 15 325 267 1.11% 1.11%<br />
Fuji Heavy industries ltd Consumer Goods 136 174 438 0.48% 0.48%<br />
Fuji Kyuko Co ltd Consumer services 2 405 175 0.06% 0.06%<br />
Fuji machine manufacturing Co ltd industrials 144 847 545 2.78% 2.78%<br />
Fuji media <strong>Holding</strong>s inc Consumer services 24 386 049 0.11% 0.11%<br />
Fuji oil Co ltd Consumer Goods 37 149 209 0.50% 0.50%<br />
Fuji seal intern<strong>at</strong>ional inc industrials 23 293 892 0.72% 0.72%<br />
Fuji s<strong>of</strong>t inc technology 80 367 863 2.15% 2.15%<br />
Fujibo <strong>Holding</strong>s inc Consumer Goods 10 448 644 0.79% 0.79%<br />
Fujicco Co ltd Consumer Goods 2 589 938 0.10% 0.10%<br />
FuJiFilm <strong>Holding</strong>s Corp technology 351 053 867 0.48% 0.48%<br />
Fujikura Kasei Co ltd basic m<strong>at</strong>erials 1 376 716 0.15% 0.15%<br />
Fujikura ltd industrials 40 995 721 0.65% 0.65%<br />
Fujimi inc basic m<strong>at</strong>erials 3 230 023 0.16% 0.16%<br />
Fujimori Kogyo Co ltd basic m<strong>at</strong>erials 2 449 792 0.17% 0.17%<br />
Fujita Kanko inc Consumer services 1 635 252 0.07% 0.07%<br />
Fujitec Co ltd industrials 5 981 912 0.17% 0.17%<br />
Fujitsu Frontech ltd technology 90 093 0.01% 0.01%<br />
Fujitsu General ltd Consumer Goods 119 110 788 3.19% 3.19%<br />
Fujitsu ltd technology 102 195 722 0.16% 0.16%<br />
Fujiya Co ltd Consumer Goods 4 374 583 0.13% 0.13%<br />
Fukui bank ltd/the Financials 14 157 398 0.32% 0.32%<br />
Fukuoka Financial Group inc Financials 141 597 335 0.66% 0.66%<br />
Fukuyama transporting Co ltd industrials 26 012 005 0.26% 0.26%<br />
Funai electric Co ltd Consumer Goods 11 497 932 0.22% 0.22%<br />
Furukawa Co ltd industrials 2 726 765 0.14% 0.14%<br />
voting<br />
ownership<br />
sector<br />
market value<br />
(noK)<br />
Furukawa electric Co ltd industrials 84 613 260 0.87% 0.87%<br />
Furukawa-sky aluminum Corp basic m<strong>at</strong>erials 5 540 870 0.16% 0.16%<br />
Furuno electric Co ltd industrials 1 038 977 0.11% 0.11%<br />
Furuya metal Co ltd technology 46 029 137 2.74% 2.74%<br />
Fuso Pharmaceutical industries ltd Health Care 1 079 412 0.08% 0.08%<br />
Futaba Corp/Chiba industrials 18 907 403 0.43% 0.43%<br />
Futaba industrial Co ltd Consumer Goods 47 506 309 2.01% 2.01%<br />
Future architect inc technology 1 261 228 0.11% 0.11%<br />
Fuyo General lease Co ltd Financials 32 551 126 0.52% 0.52%<br />
Gakken <strong>Holding</strong>s Co ltd Consumer services 1 411 706 0.12% 0.12%<br />
Gecoss Corp industrials 66 459 0.01% 0.01%<br />
Geo <strong>Holding</strong>s Corp Consumer services 6 687 152 0.18% 0.18%<br />
Glory ltd industrials 45 138 800 0.51% 0.51%<br />
Gmo internet inc technology 11 541 351 0.43% 0.43%<br />
Gmo Payment G<strong>at</strong>eway inc industrials 7 440 352 0.36% 0.35%<br />
Godo steel ltd basic m<strong>at</strong>erials 12 118 801 0.48% 0.48%<br />
Goldcrest Co ltd Financials 54 418 159 1.60% 1.60%<br />
Gourmet Kineya Co ltd Consumer services 97 501 0.01% 0.01%<br />
Gree inc Consumer services 121 767 542 0.26% 0.26%<br />
GroWell HolDinGs Co ltd Consumer services 33 238 258 1.25% 1.25%<br />
Gs Yuasa Corp Consumer Goods 74 005 596 0.56% 0.56%<br />
Gulliver intern<strong>at</strong>ional Co ltd Consumer services <strong>31</strong> 084 797 1.18% 1.18%<br />
Gun-ei Chemical industry Co ltd basic m<strong>at</strong>erials 1 327 469 0.10% 0.10%<br />
Gunma bank ltd/the Financials 85 012 106 0.54% 0.54%<br />
Gunze ltd Consumer Goods 11 413 879 0.<strong>31</strong>% 0.<strong>31</strong>%<br />
Gurunavi inc Consumer services 2 521 804 0.15% 0.15%<br />
H2o retailing Corp Consumer services 30 232 856 0.32% 0.32%<br />
Hachijuni bank ltd/the Financials 88 636 <strong>31</strong>3 0.50% 0.50%<br />
Hakuhodo DY <strong>Holding</strong>s inc Consumer services 41 627 995 0.<strong>31</strong>% 0.<strong>31</strong>%<br />
Hakuto Co ltd industrials 1 597 672 0.11% 0.11%<br />
Hamakyorex Co ltd industrials 7 057 198 0.48% 0.48%<br />
Hamam<strong>at</strong>su Photonics KK industrials 139 306 078 0.80% 0.80%<br />
Hankyu Hanshin <strong>Holding</strong>s inc Consumer services 204 635 485 0.64% 0.64%<br />
Hanwa Co ltd industrials 83 242 896 1.51% 1.51%<br />
Haseko Corp industrials 138 287 695 2.32% 2.32%<br />
Heiwa Corp Consumer services 32 348 259 0.<strong>31</strong>% 0.<strong>31</strong>%<br />
Heiwa real est<strong>at</strong>e Co ltd Financials 12 633 105 0.53% 0.53%<br />
Heiwado Co ltd Consumer services 10 039 249 0.22% 0.22%<br />
Hibiya engineering ltd industrials 4 169 576 0.19% 0.19%<br />
Higashi-nippon bank ltd/the Financials 1 885 714 0.08% 0.08%<br />
Higo bank ltd/the Financials 36 778 054 0.46% 0.46%<br />
Hikari tsushin inc telecommunic<strong>at</strong>ions 14 750 501 0.17% 0.17%<br />
Hi-leX CorP industrials 33 137 038 0.93% 0.93%<br />
Hino motors ltd industrials 53 013 353 0.25% 0.25%<br />
Hioki ee Corp industrials 9<strong>31</strong> 959 0.06% 0.06%<br />
Hirano tecseed Co ltd/Kinzoku industrials 19 845 722 2.99% 2.99%<br />
Hirose electric Co ltd industrials 101 577 239 0.48% 0.48%<br />
Hiroshima bank ltd/the Financials 91 386 891 0.53% 0.53%<br />
His Co ltd Consumer services 64 257 943 1.10% 1.10%<br />
Hisaka Works ltd industrials 16 602 133 0.77% 0.77%<br />
Hisamitsu Pharmaceutical Co inc Health Care 80 386 130 0.33% 0.33%<br />
Hitachi Cable ltd industrials 9 836 491 0.21% 0.21%<br />
Hitachi Capital Corp Financials 105 506 561 1.02% 1.02%<br />
Hitachi Chemical Co ltd basic m<strong>at</strong>erials 101 634 795 0.46% 0.46%<br />
Hitachi Construction machinery Co ltd industrials 54 233 726 0.25% 0.25%<br />
Hitachi High-technologies Corp technology 36 321 809 0.20% 0.20%<br />
Hitachi Koki Co ltd industrials 52 890 092 0.95% 0.95%<br />
Hitachi Kokusai electric inc technology 21 524 644 0.42% 0.42%<br />
Hitachi ltd industrials 755 441 411 0.53% 0.53%<br />
Hitachi medical Corp Health Care 184 297 0.01% 0.01%<br />
Hitachi metals ltd basic m<strong>at</strong>erials 168 898 823 0.71% 0.71%<br />
Hitachi tool engineering ltd industrials 1 636 625 0.09% 0.09%<br />
Hitachi transport system ltd industrials 19 821 490 0.17% 0.17%<br />
Hitachi Zosen Corp industrials 38 872 383 0.65% 0.65%<br />
Hodogaya Chemical Co ltd basic m<strong>at</strong>erials 1 802 020 0.11% 0.11%<br />
Hogy medical Co ltd Health Care 18 153 187 0.44% 0.44%<br />
Hokkaido electric Power Co inc utilities 91 618 132 0.50% 0.50%<br />
Hokkaido Gas Co ltd utilities 1 176 060 0.08% 0.08%<br />
Hokkan <strong>Holding</strong>s ltd industrials 1 143 327 0.10% 0.10%<br />
Hokkoku bank ltd/the Financials 28 020 200 0.38% 0.38%<br />
Hokuetsu bank ltd/the Financials 9 704 473 0.32% 0.32%<br />
Hokuetsu Kishu Paper Co ltd basic m<strong>at</strong>erials 24 241 520 0.29% 0.29%<br />
Hokuhoku Financial Group inc Financials 86 658 299 0.54% 0.54%<br />
Hokuriku electric industry Co ltd industrials 2 167 202 0.27% 0.27%<br />
Hokuriku electric Power Co utilities 306 826 081 1.<strong>31</strong>% 1.<strong>31</strong>%<br />
Hokuto Corp Consumer Goods 19 543 881 0.45% 0.45%<br />
Honda motor Co ltd Consumer Goods 1 591 470 103 0.48% 0.48%<br />
Honeys Co ltd Consumer Goods 254 205 0.01% 0.01%<br />
Horiba ltd industrials 44 448 584 0.58% 0.58%<br />
Hoshizaki electric Co ltd industrials 67 104 765 0.66% 0.66%<br />
Hosiden Corp industrials 17 566 <strong>31</strong>3 0.61% 0.61%<br />
Hosokawa micron Corp industrials 2 083 586 0.17% 0.17%<br />
House Foods Corp Consumer Goods 39 995 721 0.33% 0.33%<br />
Hoya Corp industrials 360 170 886 0.64% 0.64%<br />
Hulic Co ltd Financials 27 966 292 0.23% 0.23%<br />
Hyakugo bank ltd/the Financials 20 960 737 0.35% 0.35%<br />
Hyakujushi bank ltd/the Financials 45 360 764 0.55% 0.55%<br />
ibiden Co ltd industrials 144 122 626 0.81% 0.81%<br />
ibJ leasing Co ltd Financials 20 665 055 0.42% 0.42%<br />
ichibanya Co ltd Consumer services 1 519 710 0.05% 0.05%<br />
ichigo real est<strong>at</strong>e investment Corp Financials 10 756 063 0.54% 0.54%<br />
Country associ<strong>at</strong>ion according to Ftse (the benchmark provider for <strong>equities</strong>). if a company is not in the benchmark, the country <strong>of</strong> incorpor<strong>at</strong>ion is listed. sector classific<strong>at</strong>ion according to iCb (the industry Classific<strong>at</strong>ion<br />
benchmark company).<br />
voting<br />
ownership<br />
HOLdiNgs<br />
19<br />
<strong>Government</strong> <strong>Pension</strong> FunD <strong>Global</strong> ANNUAL REPORT 2011
<strong>Government</strong> <strong>Pension</strong> <strong>Fund</strong> <strong>Global</strong> <strong>Holding</strong> <strong>of</strong> <strong>equities</strong> <strong>at</strong> <strong>31</strong> December 2011<br />
sector<br />
market value<br />
(noK)<br />
ichikoh industries ltd Consumer Goods 117 280 0.01% 0.01%<br />
ichiyoshi securities Co ltd Financials 1 954 779 0.17% 0.17%<br />
icom inc technology 229 674 0.01% 0.01%<br />
idec Corp/Japan industrials 10 719 847 0.45% 0.45%<br />
idemitsu Kosan Co ltd oil & Gas 81 788 373 0.33% 0.33%<br />
iHi Corp industrials 104 687 864 0.49% 0.49%<br />
iida Home max Financials 134 035 0.01% 0.01%<br />
iino Kaiun Kaisha ltd industrials 7 861 917 0.28% 0.28%<br />
inaba Denki sangyo Co ltd industrials 16 286 857 0.42% 0.42%<br />
inaba seisakusho Co ltd Consumer Goods 892 369 0.07% 0.07%<br />
inab<strong>at</strong>a & Co ltd basic m<strong>at</strong>erials 3 961 993 0.17% 0.17%<br />
ines Corp technology 386 777 0.02% 0.02%<br />
inform<strong>at</strong>ion services intern<strong>at</strong>ional-Dentsu ltd technology 189 386 0.01% 0.01%<br />
inpex Corp oil & Gas 2 887 119 919 2.10% 2.10%<br />
internet initi<strong>at</strong>ive Japan inc technology 20 402 105 0.46% 0.46%<br />
inui steamship Co ltd industrials 918 571 0.15% 0.15%<br />
iseki & Co ltd industrials 12 414 484 0.42% 0.42%<br />
isetan mitsukoshi <strong>Holding</strong>s ltd Consumer services 120 286 963 0.49% 0.49%<br />
ishihara sangyo Kaisha ltd basic m<strong>at</strong>erials 14 697 337 0.53% 0.53%<br />
isuzu motors ltd industrials 225 934 456 0.48% 0.48%<br />
it <strong>Holding</strong>s Corp technology 33 517 602 0.53% 0.53%<br />
ito en ltd Consumer Goods 45 <strong>31</strong>0 811 0.46% 0.53%<br />
itoCHu Corp industrials 524 378 219 0.55% 0.55%<br />
itochu enex Co ltd Consumer services 3 327 407 0.08% 0.08%<br />
itochu techno-solutions Corp technology 45 049 374 0.27% 0.27%<br />
itochu-shokuhin Co ltd Consumer services 1 441 523 0.05% 0.05%<br />
itoham Foods inc Consumer Goods 46 260 067 0.79% 0.79%<br />
iwasaki electric Co ltd Consumer Goods 8 <strong>31</strong>5 106 0.86% 0.86%<br />
iw<strong>at</strong>ani Corp utilities 19 856 969 0.40% 0.40%<br />
iyo bank ltd/the Financials 100 274 591 0.53% 0.53%<br />
izumi Co ltd Consumer services 19 304 038 0.21% 0.21%<br />
izumiya Co ltd Consumer services 3 997 301 0.15% 0.15%<br />
J Front retailing Co ltd Consumer services 72 211 668 0.47% 0.47%<br />
Jaccs Co ltd Financials 13 522 906 0.43% 0.43%<br />
Jafco Co ltd Financials 70 648 909 1.33% 1.33%<br />
Janome sewing machine Co ltd Consumer Goods 156 218 0.02% 0.02%<br />
Japan airport terminal Co ltd industrials 26 453 260 0.40% 0.40%<br />
Japan avi<strong>at</strong>ion electronics industry ltd industrials 13 246 150 0.35% 0.35%<br />
Japan Carlit Co ltd basic m<strong>at</strong>erials 6 158 763 0.97% 0.97%<br />
Japan Cash machine Co ltd industrials 1 384 667 0.10% 0.10%<br />
Japan Digital labor<strong>at</strong>ory Co ltd technology 253 487 0.01% 0.01%<br />
Japan Drilling Co ltd oil & Gas 5 545 989 0.18% 0.18%<br />
Japan Petroleum explor<strong>at</strong>ion Co oil & Gas 81 109 048 0.61% 0.61%<br />
Japan Pulp & Paper Co ltd basic m<strong>at</strong>erials 7 874 529 0.25% 0.25%<br />
Japan Pure Chemical Co ltd basic m<strong>at</strong>erials 1 706 396 0.17% 0.17%<br />
Japan radio Co ltd technology 1 099 244 0.06% 0.06%<br />
Japan securities Finance Co ltd Financials 10 988 878 0.43% 0.43%<br />
Japan steel Works ltd/the industrials 71 666 982 0.46% 0.46%<br />
Japan transcity Corp industrials 5 854 703 0.44% 0.44%<br />
Japan vilene Co ltd Consumer Goods 15 573 604 1.02% 1.02%<br />
Japan Wool textile Co ltd/the Consumer Goods 6 877 027 0.18% 0.18%<br />
JbCC <strong>Holding</strong>s inc technology 157 304 0.02% 0.02%<br />
Jeol ltd industrials 2 035 960 0.17% 0.17%<br />
JFe <strong>Holding</strong>s inc basic m<strong>at</strong>erials 478 143 696 0.72% 0.72%<br />
JFe shoji <strong>Holding</strong>s inc basic m<strong>at</strong>erials 14 366 595 0.24% 0.24%<br />
JGC Corp industrials 247 866 123 0.67% 0.67%<br />
Jin Co ltd Health Care 28 581 625 2.39% 2.39%<br />
J-oil mills inc Consumer Goods 3 668 885 0.13% 0.13%<br />
Joshin Denki Co ltd Consumer services 7 397 652 0.20% 0.20%<br />
Joyo bank ltd/the Financials 112 0<strong>31</strong> 619 0.52% 0.52%<br />
Js Group Corp industrials 292 102 465 0.82% 0.82%<br />
JsP Corp basic m<strong>at</strong>erials 40 704 491 1.37% 1.37%<br />
Jsr Corp basic m<strong>at</strong>erials 19 944 017 0.07% 0.07%<br />
JteKt Corp Consumer Goods 129 4<strong>31</strong> 378 0.64% 0.64%<br />
Juki Corp industrials 45 919 706 2.65% 2.65%<br />
Jupiter telecommunic<strong>at</strong>ions Co ltd Consumer services 693 494 716 1.65% 1.65%<br />
Juroku bank ltd/the Financials 41 157 757 0.56% 0.56%<br />
JvC Kenwood Corp Consumer Goods 15 196 119 0.53% 0.53%<br />
JX <strong>Holding</strong>s inc oil & Gas 701 004 480 0.78% 0.78%<br />
kabu.com securities Co ltd Financials 6 550 007 0.20% 0.20%<br />
Kadokawa Group <strong>Holding</strong>s inc Consumer services 105 734 823 1.87% 1.87%<br />
Kaga electronics Co ltd technology 3 062 038 0.17% 0.17%<br />
Kagome Co ltd Consumer Goods 79 018 900 0.67% 0.67%<br />
Kagoshima bank ltd/the Financials 53 362 502 0.61% 0.61%<br />
Kajima Corp industrials 95 061 133 0.49% 0.49%<br />
Kakaku.com inc Consumer services 145 738 332 1.15% 1.15%<br />
Kaken Pharmaceutical Co ltd Health Care 40 151 257 0.50% 0.50%<br />
Kamei Corp Consumer services 283 117 0.01% 0.01%<br />
Kamigumi Co ltd industrials 65 564 609 0.46% 0.46%<br />
Kanaden Corp industrials 152 961 0.01% 0.01%<br />
Kanamoto Co ltd industrials 2 610 571 0.17% 0.17%<br />
Kandenko Co ltd industrials 17 445 553 0.29% 0.29%<br />
Kaneka Corp basic m<strong>at</strong>erials 37 407 502 0.34% 0.34%<br />
Kanem<strong>at</strong>su Corp industrials 11 817 379 0.50% 0.50%<br />
Kanem<strong>at</strong>su electronics ltd technology 1 611 486 0.09% 0.09%<br />
Kansai electric Power Co inc/the utilities 1<strong>31</strong> 453 199 0.15% 0.15%<br />
Kansai Paint Co ltd basic m<strong>at</strong>erials 72 738 172 0.50% 0.50%<br />
Kanto auto Works ltd Consumer Goods 2 904 260 0.09% 0.09%<br />
Kanto Denka Kogyo Co ltd basic m<strong>at</strong>erials 69 322 075 5.49% 5.49%<br />
Kanto n<strong>at</strong>ural Gas Development ltd oil & Gas 1 936 054 0.11% 0.11%<br />
Kao Corp Consumer Goods 947 324 388 1.10% 1.10%<br />
voting<br />
ownership<br />
sector<br />
market value<br />
(noK)<br />
Kappa Cre<strong>at</strong>e Co ltd Consumer services 10 793 620 0.33% 0.33%<br />
Kasumi Co ltd Consumer services 2 665 953 0.11% 0.11%<br />
K<strong>at</strong>akura industries Co ltd industrials 1 982 656 0.10% 0.10%<br />
K<strong>at</strong>o sangyo Co ltd Consumer Goods 10 304 557 0.23% 0.23%<br />
K<strong>at</strong>o Works Co ltd industrials 210 360 0.02% 0.02%<br />
Kawasaki Heavy industries ltd industrials 119 278 976 0.48% 0.48%<br />
Kawasaki Kisen Kaisha ltd industrials 88 466 203 1.07% 1.07%<br />
KDDi Corp telecommunic<strong>at</strong>ions 516 916 076 0.30% 0.30%<br />
Keihan electric railway Co ltd Consumer services 105 871 154 0.66% 0.66%<br />
Keihanshin building Co ltd Financials 1 209 569 0.10% 0.10%<br />
Keihin Corp Consumer Goods 21 081 586 0.29% 0.29%<br />
Keikyu Corp Consumer services 145 477 211 0.49% 0.49%<br />
Keio Corp Consumer services 128 273 892 0.47% 0.47%<br />
Keisei electric railway Co ltd Consumer services 197 078 401 1.30% 1.30%<br />
Keiyo bank ltd/the Financials 32 567 136 0.38% 0.38%<br />
Keiyo Co ltd Consumer services 2 013 264 0.09% 0.09%<br />
Kenedix inc Financials 52 332 732 2.94% 2.94%<br />
Kenedix realty investment Corp Financials 40 222 773 0.81% 0.81%<br />
Kentucky Fried Chicken Japan ltd Consumer services <strong>31</strong>3 368 0.01% 0.01%<br />
Kewpie Corp Consumer Goods 62 665 104 0.48% 0.48%<br />
KeY C<strong>of</strong>fee inc Consumer Goods 2 103 947 0.09% 0.09%<br />
Keyence Corp industrials 775 746 204 0.97% 0.97%<br />
Kikkoman Corp Consumer Goods 66 890 448 0.46% 0.46%<br />
Kinden Corp industrials 64 546 443 0.48% 0.48%<br />
Kinki sharyo Co ltd industrials 1 216 239 0.09% 0.09%<br />
Kintetsu Corp Consumer services 256 030 446 0.64% 0.64%<br />
Kintetsu World express inc industrials 166 485 793 2.66% 2.66%<br />
Kinugawa rubber industrial Co ltd Consumer Goods 18 328 293 0.52% 0.52%<br />
Kirin <strong>Holding</strong>s Co ltd Consumer Goods 614 245 157 0.88% 0.88%<br />
Kisoji Co ltd Consumer services 3 374 971 0.12% 0.12%<br />
Kissei Pharmaceutical Co ltd Health Care 36 526 235 0.52% 0.52%<br />
Kitagawa iron Works Co ltd industrials 6 173 966 0.62% 0.62%<br />
Kita-nippon bank ltd/the Financials 2 188 533 0.17% 0.17%<br />
Kitano Construction Corp industrials 1 139 759 0.10% 0.10%<br />
Kitz Corp industrials 12 359 412 0.43% 0.43%<br />
Kiyo <strong>Holding</strong>s inc Financials 43 635 690 0.63% 0.63%<br />
Koa Corp industrials 35 571 635 1.67% 1.67%<br />
Ko<strong>at</strong>su Gas Kogyo Co ltd basic m<strong>at</strong>erials 3 463 335 0.17% 0.17%<br />
Kobayashi Pharmaceutical Co ltd Health Care 43 226 140 0.32% 0.32%<br />
Kobe steel ltd basic m<strong>at</strong>erials 9 461 563 0.03% 0.03%<br />
Kohnan shoji Co ltd Consumer services 7 <strong>31</strong>0 041 0.21% 0.21%<br />
Koito manufacturing Co ltd Consumer Goods 44 <strong>31</strong>5 170 0.33% 0.33%<br />
Kojima Co ltd Consumer services 1 735 747 0.11% 0.11%<br />
Kokuyo Co ltd Consumer Goods 24 220 538 0.45% 0.45%<br />
Kom<strong>at</strong>su ltd industrials 911 021 741 0.65% 0.65%<br />
Kom<strong>at</strong>su seiren Co ltd Consumer Goods 228 355 0.02% 0.02%<br />
Komeri Co ltd Consumer services 41 153 630 0.41% 0.41%<br />
Komori Corp industrials 42 013 406 1.54% 1.54%<br />
Konami Corp Consumer Goods 128 335 669 0.50% 0.50%<br />
Konica minolta <strong>Holding</strong>s inc technology 115 093 503 0.49% 0.49%<br />
Konishi Co ltd basic m<strong>at</strong>erials 1 845 907 0.11% 0.11%<br />
Kose Corp Consumer Goods 60 807 748 0.67% 0.67%<br />
Koshidaka <strong>Holding</strong>s Co ltd Consumer services 23 290 084 1.58% 1.58%<br />
Kourakuen Corp Consumer services 956 734 0.06% 0.06%<br />
Krosaki Harima Corp industrials 8 058 827 0.49% 0.49%<br />
K’s <strong>Holding</strong>s Corp Consumer services 66 568 084 0.46% 0.46%<br />
Kubota Corp industrials 206 354 986 0.32% 0.32%<br />
Kumagai Gumi Co ltd industrials 990 134 0.10% 0.10%<br />
Kumiai Chemical industry Co ltd basic m<strong>at</strong>erials 607 344 0.03% 0.03%<br />
Kurabo industries ltd Consumer Goods 4 088 209 0.15% 0.15%<br />
Kuraray Co ltd basic m<strong>at</strong>erials 302 868 397 0.93% 0.93%<br />
Kureha Corp basic m<strong>at</strong>erials 96 461 510 1.79% 1.79%<br />
Kurimoto ltd basic m<strong>at</strong>erials 260 623 0.02% 0.02%<br />
Kurita W<strong>at</strong>er industries ltd industrials 76 591 122 0.37% 0.37%<br />
Kuroda electric Co ltd industrials 8 050 744 0.38% 0.38%<br />
KYb Co ltd Consumer Goods 14 794 683 0.23% 0.23%<br />
Kyocera Corp industrials 588 538 816 0.64% 0.64%<br />
Kyodo Printing Co ltd industrials 1 7<strong>31</strong> 279 0.14% 0.14%<br />
Kyoei steel ltd basic m<strong>at</strong>erials 40 634 759 0.82% 0.82%<br />
Kyokuto Kaih<strong>at</strong>su Kogyo Co ltd industrials 2 870 806 0.17% 0.17%<br />
Kyokuto securities Co ltd Financials 28 700 612 2.72% 2.72%<br />
Kyokuyo Co ltd Consumer Goods 2 264 <strong>31</strong>5 0.15% 0.15%<br />
KYorin <strong>Holding</strong>s inc Health Care 38 362 346 0.49% 0.49%<br />
Kyoritsu maintenance Co ltd Financials 176 851 0.01% 0.01%<br />
Kyosan electric manufacturing Co ltd industrials 43 132 672 2.72% 2.72%<br />
Kyoto Kimono Yuzen Co ltd Consumer services 145 460 0.01% 0.01%<br />
Kyowa exeo Corp industrials 34 089 995 0.51% 0.51%<br />
Kyowa Hakko Kirin Co ltd Health Care 109 820 364 0.26% 0.26%<br />
Kyudenko Corp industrials 5 078 187 0.17% 0.17%<br />
Kyushu electric Power Co inc utilities 83 179 029 0.21% 0.21%<br />
lawson inc Consumer services 180 403 122 0.48% 0.48%<br />
leC inC Consumer Goods 17 700 626 2.34% 2.34%<br />
leopalace21 Corp Consumer Goods 12 205 606 0.59% 0.59%<br />
lintec Corp industrials 130 073 913 1.57% 1.57%<br />
lion Corp Consumer Goods 41 821 802 0.40% 0.40%<br />
m3 inc Consumer services 12 704 116 0.09% 0.09%<br />
mabuchi motor Co ltd industrials 49 719 989 0.50% 0.50%<br />
mac House Co ltd Consumer services 1 003 397 0.20% 0.20%<br />
macnica inc industrials 52 465 797 2.11% 2.11%<br />
macromill inc Consumer services 4 834 226 0.26% 0.26%<br />
maeda Corp industrials 24 192 304 0.60% 0.60%<br />
Country associ<strong>at</strong>ion according to Ftse (the benchmark provider for <strong>equities</strong>). if a company is not in the benchmark, the country <strong>of</strong> incorpor<strong>at</strong>ion is listed. sector classific<strong>at</strong>ion according to iCb (the industry Classific<strong>at</strong>ion<br />
benchmark company).<br />
voting<br />
ownership<br />
HOLdiNgs<br />
20<br />
<strong>Government</strong> <strong>Pension</strong> FunD <strong>Global</strong> ANNUAL REPORT 2011
<strong>Government</strong> <strong>Pension</strong> <strong>Fund</strong> <strong>Global</strong> <strong>Holding</strong> <strong>of</strong> <strong>equities</strong> <strong>at</strong> <strong>31</strong> December 2011<br />
sector<br />
market value<br />
(noK)<br />
maeda road Construction Co ltd industrials 25 476 569 0.43% 0.43%<br />
maezawa Kasei industries Co ltd industrials 1 585 145 0.17% 0.17%<br />
maezawa Kyuso industries Co ltd industrials 1 195 886 0.12% 0.12%<br />
makino milling machine Co ltd industrials 18 640 575 0.42% 0.42%<br />
makita Corp Consumer Goods 154 013 762 0.57% 0.57%<br />
mandom Corp Consumer Goods 18 414 050 0.48% 0.48%<br />
mani inc Health Care 10 400 863 0.43% 0.43%<br />
mars engineering Corp Consumer services 2 507 284 0.11% 0.11%<br />
marubeni Corp industrials 304 476 303 0.48% 0.48%<br />
marudai Food Co ltd Consumer Goods 4 396 612 0.15% 0.15%<br />
maruetsu inc/the Consumer services 2 888 568 0.10% 0.10%<br />
maruha nichiro <strong>Holding</strong>s inc Consumer Goods 23 926 994 0.43% 0.43%<br />
marui Group Co ltd Consumer services 69 710 713 0.47% 0.47%<br />
maruichi steel tube ltd basic m<strong>at</strong>erials 58 390 549 0.47% 0.47%<br />
marusan securities Co ltd Financials 2 280 883 0.17% 0.17%<br />
maruwa Co ltd/aichi industrials 89 338 559 2.63% 2.63%<br />
maruzen showa unyu Co ltd industrials 1 077 241 0.06% 0.06%<br />
m<strong>at</strong>suda sangyo Co ltd basic m<strong>at</strong>erials 45 807 158 1.74% 1.74%<br />
m<strong>at</strong>sui securities Co ltd Financials 24 358 544 0.<strong>31</strong>% 0.<strong>31</strong>%<br />
m<strong>at</strong>sumotokiyoshi <strong>Holding</strong>s Co ltd Consumer services 34 417 588 0.53% 0.53%<br />
m<strong>at</strong>suya Co ltd Consumer services 1 355 859 0.08% 0.08%<br />
m<strong>at</strong>suya Foods Co ltd Consumer services 1 900 483 0.08% 0.08%<br />
max Co ltd industrials 7 544 330 0.20% 0.20%<br />
mazda motor Corp Consumer Goods 135 512 644 0.72% 0.72%<br />
mcDonald’s <strong>Holding</strong>s Co Japan ltd Consumer services 14 741 123 0.07% 0.07%<br />
medipal <strong>Holding</strong>s Corp Health Care 70 065 160 0.46% 0.46%<br />
megachips Corp technology 34 940 610 1.46% 1.46%<br />
megane toP Co ltd Consumer services 44 068 679 1.41% 1.41%<br />
megmilk snow brand Co ltd Consumer Goods 39 948 956 0.49% 0.49%<br />
meidensha Corp industrials 19 366 440 0.42% 0.42%<br />
meiJi <strong>Holding</strong>s Co ltd Consumer Goods 60 621 537 0.32% 0.32%<br />
meiko electronics Co ltd industrials 30 428 540 2.98% 2.98%<br />
meisei industrial Co ltd industrials 930 795 0.09% 0.09%<br />
meitec Corp industrials 18 694 677 0.46% 0.46%<br />
meiwa est<strong>at</strong>e Co ltd Financials 71 997 0.01% 0.01%<br />
melco <strong>Holding</strong>s inc technology 46 536 071 1.30% 1.30%<br />
message Co ltd Health Care 68 773 294 1.83% 1.83%<br />
michinoku bank ltd/the Financials 2 811 778 0.17% 0.17%<br />
mie bank ltd/the Financials 2 064 970 0.11% 0.11%<br />
mikuni Coca-Cola bottling Co ltd Consumer Goods 4 402 453 0.16% 0.16%<br />
milbon Co ltd Consumer Goods 504 045 0.02% 0.02%<br />
mimasu semiconductor industry Co ltd technology 129 474 0.01% 0.01%<br />
min<strong>at</strong>o bank ltd/the Financials 10 457 487 0.23% 0.23%<br />
minebea Co ltd industrials 63 614 748 0.64% 0.64%<br />
ministop Co ltd Consumer services 9 197 <strong>31</strong>4 0.28% 0.28%<br />
miraca <strong>Holding</strong>s inc Health Care 64 356 398 0.46% 0.46%<br />
mirait <strong>Holding</strong>s Corp industrials 88 072 440 2.29% 2.29%<br />
misawa Homes Co ltd Consumer Goods 10 342 115 0.56% 0.56%<br />
misumi Group inc industrials 385 396 652 3.11% 3.11%<br />
mitsuba Corp Consumer Goods 3 642 202 0.17% 0.17%<br />
mitsubishi Chemical <strong>Holding</strong>s Corp basic m<strong>at</strong>erials 303 085 364 0.61% 0.61%<br />
mitsubishi Corp industrials 1 068 135 337 0.54% 0.54%<br />
mitsubishi electric Corp industrials 727 453 <strong>31</strong>4 0.59% 0.59%<br />
mitsubishi est<strong>at</strong>e Co ltd Financials 598 222 239 0.48% 0.48%<br />
mitsubishi Gas Chemical Co inc basic m<strong>at</strong>erials 79 857 206 0.50% 0.50%<br />
mitsubishi Heavy industries ltd industrials 552 440 7<strong>31</strong> 0.64% 0.64%<br />
mitsubishi Kakoki Kaisha ltd industrials 1 280 309 0.16% 0.16%<br />
mitsubishi logistics Corp industrials 55 213 233 0.47% 0.47%<br />
mitsubishi m<strong>at</strong>erials Corp industrials 104 351 057 0.49% 0.49%<br />
mitsubishi motors Corp Consumer Goods 186 940 307 0.48% 0.48%<br />
mitsubishi Paper mills ltd basic m<strong>at</strong>erials 6 238 656 0.34% 0.34%<br />
mitsubishi Pencil Co ltd Consumer Goods 4 188 052 0.12% 0.12%<br />
mitsubishi shokuhin Co ltd Consumer Goods 11 244 335 0.12% 0.12%<br />
mitsubishi steel manufacturing Co ltd basic m<strong>at</strong>erials 11 767 426 0.50% 0.50%<br />
mitsubishi tanabe Pharma Corp Health Care 112 955 190 0.21% 0.21%<br />
mitsubishi uFJ Financial Group inc Financials 2 811 365 828 0.78% 0.78%<br />
mitsubishi uFJ lease & Finance Co ltd Financials 65 221 960 0.<strong>31</strong>% 0.<strong>31</strong>%<br />
mitsuboshi belting Co ltd industrials 4 023 829 0.18% 0.18%<br />
mitsui & Co ltd industrials 860 744 556 0.51% 0.51%<br />
mitsui Chemicals inc basic m<strong>at</strong>erials 91 916 136 0.49% 0.49%<br />
mitsui engineering & shipbuilding Co ltd industrials 38 568 746 0.50% 0.50%<br />
mitsui Fudosan Co ltd Financials 665 379 758 0.87% 0.87%<br />
mitsui High-tec inc technology 27 340 045 2.54% 2.54%<br />
mitsui Home Co ltd Consumer Goods 1 798 529 0.09% 0.09%<br />
mitsui Knowledge industry Co ltd technology 1 507 184 0.12% 0.12%<br />
mitsui m<strong>at</strong>sushima Co ltd Consumer services 7 273 003 0.48% 0.48%<br />
mitsui mining & smelting Co ltd basic m<strong>at</strong>erials 55 653 738 0.63% 0.63%<br />
mitsui osK lines ltd industrials 144 903 336 0.52% 0.52%<br />
mitsui sugar Co ltd Consumer Goods 19 461 536 0.67% 0.67%<br />
mitsui-soko Co ltd industrials 11 809 467 0.42% 0.42%<br />
mitsumi electric Co ltd industrials 22 4<strong>31</strong> 635 0.58% 0.58%<br />
mitsuuroko <strong>Holding</strong>s Co ltd utilities 1 545 943 0.07% 0.07%<br />
miura Co ltd industrials 42 404 899 0.60% 0.60%<br />
miyazaki bank ltd/the Financials 10 965 701 0.42% 0.42%<br />
mizuho Financial Group inc Financials 961 870 226 0.50% 0.50%<br />
mizuno Corp Consumer Goods 6 726 859 0.16% 0.16%<br />
mochida Pharmaceutical Co ltd Health Care 27 410 064 0.34% 0.34%<br />
modec inc oil & Gas 6 330 223 0.13% 0.13%<br />
monex Group inc Financials 8 456 342 0.30% 0.30%<br />
mori seiki Co ltd industrials 107 011 580 1.70% 1.70%<br />
morinaga & Co ltd/Japan Consumer Goods 12 382 837 0.33% 0.33%<br />
voting<br />
ownership<br />
sector<br />
market value<br />
(noK)<br />
morinaga milk industry Co ltd Consumer Goods <strong>31</strong> 204 917 0.53% 0.53%<br />
morita <strong>Holding</strong>s Corp industrials 3 111 339 0.20% 0.20%<br />
mory industries inc basic m<strong>at</strong>erials 936 923 0.11% 0.11%<br />
mos Food services inc Consumer services 15 789 533 0.41% 0.41%<br />
moshi moshi Hotline inc Consumer services 6 202 782 0.16% 0.16%<br />
mr max Corp Consumer services 139 076 0.01% 0.01%<br />
ms&aD insurance Group <strong>Holding</strong>s Financials 1 191 869 486 1.70% 1.70%<br />
mur<strong>at</strong>a manufacturing Co ltd industrials 769 073 026 1.11% 1.11%<br />
musashi seimitsu industry Co ltd Consumer Goods 18 069 842 0.45% 0.45%<br />
musashino bank ltd/the Financials 101 369 695 1.49% 1.49%<br />
nabtesco Corp industrials 95 287 606 0.69% 0.69%<br />
nachi-Fujikoshi Corp industrials 38 326 200 0.58% 0.58%<br />
nafco Co ltd Consumer services 29 669 880 0.97% 0.97%<br />
nagaileben Co ltd Consumer Goods 5 401 111 0.18% 0.18%<br />
nagano bank ltd/the Financials 1 400 382 0.13% 0.13%<br />
nagase & Co ltd basic m<strong>at</strong>erials 27 690 737 0.<strong>31</strong>% 0.<strong>31</strong>%<br />
nag<strong>at</strong>anien Co ltd Consumer Goods 1 148 524 0.04% 0.04%<br />
nagoya railroad Co ltd Consumer services 66 246 941 0.47% 0.47%<br />
nakamuraya Co ltd Consumer Goods 1 179 008 0.07% 0.07%<br />
nakanishi inc Health Care 28 221 097 0.81% 0.81%<br />
nakayama steel Works ltd basic m<strong>at</strong>erials 146 600 0.02% 0.02%<br />
namco bandai <strong>Holding</strong>s inc Consumer Goods 95 656 232 0.49% 0.49%<br />
namura shipbuilding Co ltd industrials 1 624 890 0.16% 0.16%<br />
nanto bank ltd/the Financials 56 041 3<strong>31</strong> 0.60% 0.60%<br />
neC Capital solutions ltd technology 182 599 0.01% 0.01%<br />
neC Corp technology 57 020 5<strong>31</strong> 0.18% 0.18%<br />
neC Fielding ltd technology 9 718 249 0.23% 0.23%<br />
neC mobiling ltd technology 2 981 803 0.10% 0.10%<br />
neC networks & system integr<strong>at</strong>ion Corp technology 55 548 095 1.28% 1.28%<br />
net one systems Co ltd technology 73 851 357 0.82% 0.82%<br />
neturen Co ltd basic m<strong>at</strong>erials 1 382 953 0.07% 0.07%<br />
nexon Co ltd technology 42 932 939 0.12% 0.12%<br />
nGK insul<strong>at</strong>ors ltd industrials 161 259 168 0.67% 0.67%<br />
nGK spark Plug Co ltd Consumer Goods 53 630 881 0.32% 0.32%<br />
nHK spring Co ltd Consumer Goods 60 967 488 0.47% 0.47%<br />
nice <strong>Holding</strong>s inc industrials 2 510 123 0.20% 0.20%<br />
nichias Corp industrials 116 246 110 2.81% 2.81%<br />
nichicon Corp industrials 49 569 898 1.06% 1.06%<br />
nichiden Corp industrials 1 654 954 0.05% 0.05%<br />
nichiha Corp industrials 6 094 942 0.25% 0.25%<br />
nichii Gakkan Co industrials 86 178 067 1.62% 1.62%<br />
nichi-iko Pharmaceutical Co ltd Health Care 68 690 071 1.20% 1.20%<br />
nichirei Corp Consumer Goods 44 092 710 0.49% 0.49%<br />
nidec Copal Corp industrials 2 841 718 0.07% 0.07%<br />
nidec Copal electronics Corp industrials 2 153 977 0.09% 0.09%<br />
nidec Corp industrials 856 519 009 1.14% 1.14%<br />
nidec sankyo Corp industrials 9 957 960 0.14% 0.14%<br />
nidec-tosok Corp Consumer Goods 199 159 0.01% 0.01%<br />
nifco inc/Japan Consumer Goods 44 380 791 0.49% 0.49%<br />
niFtY Corp technology 18 195 111 1.21% 1.21%<br />
nihon Dempa Kogyo Co ltd industrials 8 870 170 0.60% 0.60%<br />
nihon Kohden Corp Health Care 53 410 391 0.79% 0.79%<br />
nihon m&a Center inc Financials 9 903 4<strong>31</strong> 0.48% 0.47%<br />
nihon nohyaku Co ltd basic m<strong>at</strong>erials 2 803 090 0.16% 0.16%<br />
nihon Parkerizing Co ltd basic m<strong>at</strong>erials 50 456 558 1.06% 1.06%<br />
nihon trim Co ltd Consumer Goods 9 555 003 1.50% 1.50%<br />
nihon unisys ltd technology 13 405 936 0.32% 0.32%<br />
nihon Yamamura Glass Co ltd industrials 2 348 989 0.14% 0.14%<br />
nikkiso Co ltd Health Care 19 661 890 0.48% 0.48%<br />
nikon Corp Consumer Goods 256 588 430 0.48% 0.48%<br />
nintendo Co ltd Consumer Goods 594 169 660 0.51% 0.51%<br />
nippo Corp industrials 21 922 094 0.32% 0.32%<br />
nippon beet sugar manufacturing Co ltd Consumer Goods 2 527 808 0.14% 0.14%<br />
nippon Carbon Co ltd industrials 22 149 208 1.12% 1.12%<br />
nippon Ceramic Co ltd industrials 39 698 192 1.36% 1.36%<br />
nippon Chemical industrial Co ltd basic m<strong>at</strong>erials 178 713 0.02% 0.02%<br />
nippon Chemi-Con Corp industrials 60 037 856 2.09% 2.09%<br />
nippon Chemiphar Co ltd Health Care 199 656 0.02% 0.02%<br />
nippon Coke & engineering Co ltd basic m<strong>at</strong>erials 10 355 215 0.45% 0.45%<br />
nippon Denko Co ltd basic m<strong>at</strong>erials 13 577 513 0.46% 0.46%<br />
nippon Densetsu Kogyo Co ltd industrials 12 949 691 0.34% 0.34%<br />
nippon Denwa shisetsu Co ltd industrials 1 000 838 0.08% 0.08%<br />
nippon electric Glass Co ltd industrials 141 849 676 0.48% 0.48%<br />
nippon express Co ltd industrials 119 221 490 0.48% 0.48%<br />
nippon Flour mills Co ltd Consumer Goods 14 425 778 0.<strong>31</strong>% 0.<strong>31</strong>%<br />
nippon Gas Co ltd utilities 3 219 808 0.08% 0.08%<br />
nippon Kanzai Co ltd Financials 1 963 684 0.09% 0.09%<br />
nippon Kasei Chemical Co ltd basic m<strong>at</strong>erials 102 387 0.01% 0.01%<br />
nippon Kayaku Co ltd basic m<strong>at</strong>erials 49 957 032 0.48% 0.48%<br />
nippon Kodoshi Corp basic m<strong>at</strong>erials 3 457 323 0.29% 0.29%<br />
nippon Koei Co ltd industrials 3 148 260 0.17% 0.17%<br />
nippon Konpo unyu soko Co ltd industrials 11 247 848 0.24% 0.24%<br />
nippon light metal Co ltd basic m<strong>at</strong>erials 18 410 668 0.43% 0.43%<br />
nippon me<strong>at</strong> Packers inc Consumer Goods 16 906 968 0.10% 0.10%<br />
nippon metal industry Co ltd basic m<strong>at</strong>erials 180 807 0.02% 0.02%<br />
nippon Paint Co ltd basic m<strong>at</strong>erials 51 740 800 0.47% 0.47%<br />
nippon Paper Group inc basic m<strong>at</strong>erials 75 709 597 0.50% 0.50%<br />
nippon Parking Development Co ltd industrials 1 054 630 0.11% 0.11%<br />
nippon road Co ltd/the industrials 204 775 0.01% 0.01%<br />
nippon seiki Co ltd Consumer Goods 69 301 598 1.76% 1.76%<br />
nippon sharyo ltd industrials 45 764 0.00% 0.00%<br />
Country associ<strong>at</strong>ion according to Ftse (the benchmark provider for <strong>equities</strong>). if a company is not in the benchmark, the country <strong>of</strong> incorpor<strong>at</strong>ion is listed. sector classific<strong>at</strong>ion according to iCb (the industry Classific<strong>at</strong>ion<br />
benchmark company).<br />
voting<br />
ownership<br />
HOLdiNgs<br />
21<br />
<strong>Government</strong> <strong>Pension</strong> FunD <strong>Global</strong> ANNUAL REPORT 2011
<strong>Government</strong> <strong>Pension</strong> <strong>Fund</strong> <strong>Global</strong> <strong>Holding</strong> <strong>of</strong> <strong>equities</strong> <strong>at</strong> <strong>31</strong> December 2011<br />
sector<br />
market value<br />
(noK)<br />
nippon sheet Glass Co ltd industrials 88 855 764 0.88% 0.88%<br />
nippon shinyaku Co ltd Health Care 32 899 430 0.63% 0.63%<br />
nippon shokubai Co ltd basic m<strong>at</strong>erials 133 150 3<strong>31</strong> 1.02% 1.02%<br />
nippon signal Co ltd industrials 8 922 209 0.40% 0.40%<br />
nippon soda Co ltd basic m<strong>at</strong>erials 18 083 183 0.43% 0.43%<br />
nippon steel Corp basic m<strong>at</strong>erials 267 642 033 0.26% 0.26%<br />
nippon steel trading Co ltd basic m<strong>at</strong>erials 321 124 0.01% 0.01%<br />
nippon suisan Kaisha ltd Consumer Goods 30 <strong>31</strong>0 795 0.53% 0.53%<br />
nippon synthetic Chemical<br />
industry Co ltd/the basic m<strong>at</strong>erials 10 858 349 0.32% 0.32%<br />
nippon telegraph & telephone Corp telecommunic<strong>at</strong>ions 3 375 776 779 0.84% 0.84%<br />
nippon television network Corp Consumer services 26 244 177 0.11% 0.11%<br />
nippon thompson Co ltd industrials 12 447 295 0.49% 0.49%<br />
nippon valqua industries ltd basic m<strong>at</strong>erials 2 438 839 0.17% 0.17%<br />
nippon Yakin Kogyo Co ltd basic m<strong>at</strong>erials 2 674 873 0.18% 0.18%<br />
nippon Yusen KK industrials 126 229 926 0.49% 0.49%<br />
nipro Corp Health Care 24 580 802 0.38% 0.38%<br />
nishim<strong>at</strong>su Construction Co ltd industrials 10 847 443 0.38% 0.38%<br />
nishim<strong>at</strong>suya Chain Co ltd Consumer services 281 527 0.01% 0.01%<br />
nishi-nippon City bank ltd/the Financials 69 785 689 0.51% 0.51%<br />
nishi-nippon railroad Co ltd Consumer services 52 778 583 0.47% 0.47%<br />
nishio rent all Co ltd industrials 24 453 276 1.99% 1.99%<br />
nissan Chemical industries ltd basic m<strong>at</strong>erials 61 560 366 0.62% 0.62%<br />
nissan motor Co ltd Consumer Goods 1 077 446 517 0.44% 0.44%<br />
nissan sh<strong>at</strong>ai Co ltd Consumer Goods 18 392 207 0.20% 0.20%<br />
nissen <strong>Holding</strong>s Co ltd Consumer services 2 249 546 0.13% 0.13%<br />
nissha Printing Co ltd industrials 21 770 281 0.65% 0.65%<br />
nisshin oillio Group ltd/the Consumer Goods 21 207 088 0.48% 0.48%<br />
nisshin seifun Group inc Consumer Goods 55 579 656 0.<strong>31</strong>% 0.<strong>31</strong>%<br />
nisshin steel Co ltd basic m<strong>at</strong>erials 43 750 488 0.48% 0.48%<br />
nisshinbo <strong>Holding</strong>s inc Consumer Goods 38 650 659 0.40% 0.40%<br />
nissin Corp industrials 1 618 653 0.11% 0.11%<br />
nissin electric Co ltd industrials 9 238 920 0.26% 0.26%<br />
nissin Foods <strong>Holding</strong>s Co ltd Consumer Goods 28 858 614 0.11% 0.11%<br />
nissin Kogyo Co ltd Consumer Goods 23 977 833 0.43% 0.43%<br />
nitori <strong>Holding</strong>s Co ltd Consumer services 123 570 306 0.39% 0.39%<br />
nitta Corp industrials 83 705 641 2.47% 2.47%<br />
nittetsu mining Co ltd basic m<strong>at</strong>erials 354 866 0.02% 0.02%<br />
nitto boseki Co ltd industrials 55 461 756 1.08% 1.08%<br />
nitto Denko Corp basic m<strong>at</strong>erials 202 911 466 0.55% 0.55%<br />
nitto Kogyo Corp industrials 44 530 766 1.47% 1.47%<br />
nitto Kohki Co ltd industrials 5 280 325 0.18% 0.18%<br />
nKsJ <strong>Holding</strong>s inc Financials 442 246 658 0.91% 0.91%<br />
noF Corp basic m<strong>at</strong>erials 28 <strong>31</strong>9 218 0.48% 0.48%<br />
nohmi bosai ltd industrials 1 154 186 0.05% 0.05%<br />
noK Corp Consumer Goods 88 226 584 0.50% 0.50%<br />
nomura Co ltd industrials 1 795 970 0.17% 0.17%<br />
nomura <strong>Holding</strong>s inc Financials 683 401 251 0.99% 0.99%<br />
nomura real est<strong>at</strong>e <strong>Holding</strong>s inc Financials 134 972 038 0.80% 0.80%<br />
nomura research institute ltd technology 146 324 829 0.48% 0.48%<br />
noritake Co ltd Consumer Goods 8 420 596 0.30% 0.30%<br />
noritsu Koki Co ltd Consumer Goods 890 624 0.09% 0.09%<br />
noritz Corp industrials 192 174 948 3.48% 3.48%<br />
nPC inc/Japan industrials 15 990 398 1.82% 1.82%<br />
ns solutions Corp technology 14 290 300 0.23% 0.23%<br />
ns united Kaiun Kaisha ltd industrials 1 511 612 0.07% 0.07%<br />
nsD Co ltd technology 3 017 142 0.13% 0.13%<br />
nsK ltd Consumer Goods 104 221 358 0.49% 0.49%<br />
ntn Corp industrials 59 210 889 0.46% 0.46%<br />
ntt D<strong>at</strong>a Corp technology 128 770 366 0.24% 0.24%<br />
ntt DoComo inc telecommunic<strong>at</strong>ions 2<strong>31</strong> 421 146 0.05% 0.05%<br />
ntt urban Development Corp Financials 34 296 321 0.26% 0.26%<br />
obara Group inc industrials 182 203 0.01% 0.01%<br />
obayashi Corp industrials 94 177 843 0.49% 0.49%<br />
obiC business Consultants ltd technology 3 937 265 0.07% 0.07%<br />
obic Co ltd technology 38 001 259 0.33% 0.33%<br />
odakyu electric railway Co ltd Consumer services 204 520 894 0.48% 0.48%<br />
oenon <strong>Holding</strong>s inc Consumer Goods 181 505 0.02% 0.02%<br />
ogaki Kyoritsu bank ltd/the Financials 32 493 991 0.47% 0.47%<br />
ohara inc industrials 1 428 833 0.09% 0.09%<br />
ohashi technica inc Consumer Goods 109 648 0.01% 0.01%<br />
oiles Corp industrials 16 055 557 0.42% 0.42%<br />
oita bank ltd/the Financials 10 021 874 0.34% 0.34%<br />
oJi Paper Co ltd basic m<strong>at</strong>erials 158 846 465 0.49% 0.49%<br />
okabe Co ltd industrials 6 743 690 0.41% 0.41%<br />
okamoto industries inc basic m<strong>at</strong>erials 5 034 052 0.20% 0.20%<br />
okamura Corp Consumer Goods 65 116 586 1.42% 1.42%<br />
okasan securities Group inc Financials 4 807 248 0.12% 0.12%<br />
oki electric industry Co ltd technology 16 671 710 0.43% 0.43%<br />
okinawa electric Power Co inc/the utilities 18 139 962 0.41% 0.41%<br />
oKuma Corp industrials 37 780 986 0.59% 0.59%<br />
okumura Corp industrials 32 838 463 0.59% 0.59%<br />
okura industrial Co ltd basic m<strong>at</strong>erials 1 323 591 0.12% 0.12%<br />
okuwa Co ltd Consumer services 10 481 144 0.25% 0.25%<br />
olympic Corp Consumer services 145 406 0.01% 0.01%<br />
olympus Corp Health Care 97 610 100 0.46% 0.46%<br />
omron Corp industrials 454 055 485 1.58% 1.58%<br />
ono Pharmaceutical Co ltd Health Care 190 388 694 0.48% 0.48%<br />
onoken Co ltd industrials 199 082 0.02% 0.02%<br />
onward <strong>Holding</strong>s Co ltd Consumer Goods 36 462 359 0.48% 0.48%<br />
oPt inc Consumer services 13 321 <strong>31</strong>1 1.32% 1.32%<br />
voting<br />
ownership<br />
sector<br />
market value<br />
(noK)<br />
optex Co ltd industrials 33 403 238 2.51% 2.51%<br />
oracle Corp Japan technology 107 611 656 0.43% 0.43%<br />
organo Corp industrials 24 400 437 0.92% 0.92%<br />
orient Corp Financials 3 542 840 0.10% 0.10%<br />
oriental land Co ltd/Japan Consumer services 63 565 881 0.11% 0.11%<br />
origin electric Co ltd industrials 27 182 019 4.59% 4.59%<br />
oriX Corp Financials 492 074 952 0.90% 0.90%<br />
osaka Gas Co ltd utilities 53 303 921 0.11% 0.11%<br />
osaka securities exchange Co ltd Financials 34 284 0.00% 0.00%<br />
osaka steel Co ltd basic m<strong>at</strong>erials 2 023 689 0.04% 0.04%<br />
osaKa titanium technologies Co basic m<strong>at</strong>erials 27 335 716 0.28% 0.28%<br />
osaki electric Co ltd industrials 29 800 346 1.35% 1.35%<br />
osG Corp industrials 37 460 607 0.50% 0.50%<br />
otsuka Corp technology 35 806 924 0.28% 0.28%<br />
otsuka <strong>Holding</strong>s Co ltd Health Care 451 559 329 0.48% 0.48%<br />
oyo Corp industrials 3 766 060 0.17% 0.17%<br />
Pacific industrial Co ltd Consumer Goods 1 784 180 0.11% 0.11%<br />
Pacific metals Co ltd basic m<strong>at</strong>erials 29 163 682 0.51% 0.51%<br />
Pack Corp/the industrials 1 298 460 0.08% 0.08%<br />
Pal Co ltd Consumer services 39 567 710 1.48% 1.48%<br />
Paltac Corp Consumer Goods 6 736 260 0.16% 0.16%<br />
Panasonic Corp Consumer Goods 566 994 133 0.72% 0.72%<br />
Panasonic electric Works inform<strong>at</strong>ion<br />
systems Co ltd technology 77 023 0.00% 0.00%<br />
Panasonic electric Works sunX Co ltd industrials 104 994 0.01% 0.01%<br />
Paramount bed <strong>Holding</strong>s Co ltd Health Care 13 279 364 0.24% 0.24%<br />
Parco Co ltd Consumer services 4 269 000 0.11% 0.11%<br />
Paris miki <strong>Holding</strong>s inc Consumer services 3 249 360 0.12% 0.12%<br />
Park24 Co ltd Consumer services 98 615 293 0.83% 0.83%<br />
Pasco Corp industrials 11 603 916 0.74% 0.74%<br />
Pasona Group inc industrials 1 716 154 0.07% 0.07%<br />
Penta-ocean Construction Co ltd industrials 27 497 054 0.53% 0.53%<br />
PGm <strong>Holding</strong>s K K Consumer services 3 913 180 0.09% 0.09%<br />
Pigeon Corp Consumer Goods 130 655 405 2.65% 2.65%<br />
Pilot Corp Consumer Goods 10 513 148 0.39% 0.39%<br />
Piolax inc Consumer Goods 1 925 164 0.11% 0.11%<br />
Pioneer Corp Consumer Goods 565 995 941 6.47% 6.47%<br />
Plenus Co ltd Consumer services 2 556 554 0.06% 0.06%<br />
Pocket Card Co ltd Financials 59 571 0.00% 0.00%<br />
Point inc Consumer services 68 085 056 1.10% 1.10%<br />
Pola orbis <strong>Holding</strong>s inc Consumer Goods 24 975 103 0.27% 0.27%<br />
Press Kogyo Co ltd Consumer Goods 67 194 510 2.05% 2.05%<br />
Prima me<strong>at</strong> Packers ltd Consumer Goods 17 650 674 0.80% 0.80%<br />
Promise Co ltd Financials 5 133 919 0.02% 0.02%<br />
Pronexus inc industrials 1 887 343 0.16% 0.16%<br />
Proto Corp Consumer services 5 279 285 0.26% 0.26%<br />
raito Kogyo Co ltd industrials 8 075 224 0.43% 0.43%<br />
relo <strong>Holding</strong>s inc industrials 47 666 057 2.10% 2.10%<br />
rengo Co ltd industrials 100 842 144 0.89% 0.89%<br />
resona <strong>Holding</strong>s inc Financials 3<strong>31</strong> 224 599 0.50% 0.50%<br />
resorttrust inc Consumer services 19 710 788 0.43% 0.43%<br />
rhythm W<strong>at</strong>ch Co ltd Consumer Goods 2 643 459 0.18% 0.18%<br />
ricoh Co ltd technology 240 413 733 0.62% 0.62%<br />
ricoh leasing Co ltd Financials 4 872 443 0.12% 0.12%<br />
right on Co ltd Consumer services 2 609 299 0.20% 0.20%<br />
riken Corp Consumer Goods 4 079 8<strong>31</strong> 0.17% 0.17%<br />
riken technos Corp basic m<strong>at</strong>erials 169 095 0.02% 0.02%<br />
ringer Hut Co ltd Consumer services 7 350 491 0.41% 0.41%<br />
rinnai Corp Consumer Goods 244 937 342 1.06% 1.06%<br />
riso Kagaku Corp technology 4 381 045 0.20% 0.20%<br />
rock Field Co ltd Consumer Goods 1 994 066 0.15% 0.15%<br />
rohm Co ltd technology 148 366 460 0.47% 0.47%<br />
rohto Pharmaceutical Co ltd Health Care 43 726 442 0.48% 0.48%<br />
roland Corp Consumer Goods 2 365 973 0.17% 0.17%<br />
roland DG Corp technology 119 375 0.01% 0.01%<br />
round one Corp Consumer services 13 562 465 0.37% 0.37%<br />
royal <strong>Holding</strong>s Co ltd Consumer services 3 293 294 0.11% 0.11%<br />
ryobi ltd Consumer Goods 16 514 638 0.44% 0.44%<br />
ryoden trading Co ltd technology 2 649 975 0.17% 0.17%<br />
ryohin Keikaku Co ltd Consumer services 52 339 674 0.64% 0.64%<br />
ryosan Co ltd technology 21 911 638 0.50% 0.50%<br />
ryoyo electro Corp technology 4 841 300 0.24% 0.24%<br />
sagami Chain Co ltd Consumer services 1 256 574 0.12% 0.12%<br />
saibu Gas Co ltd utilities 13 809 203 0.24% 0.24%<br />
saizeriya Co ltd Consumer services 80 997 329 1.56% 1.56%<br />
sakai Chemical industry Co ltd basic m<strong>at</strong>erials 3 957 044 0.17% 0.17%<br />
sak<strong>at</strong>a inX Corp basic m<strong>at</strong>erials 1 911 001 0.11% 0.11%<br />
sak<strong>at</strong>a seed Corp Consumer Goods 12 836 414 0.<strong>31</strong>% 0.<strong>31</strong>%<br />
sala Corp utilities 1 192 698 0.08% 0.08%<br />
samco inc technology 6 150 175 1.81% 1.81%<br />
san-a Co ltd Consumer services 41 734 656 1.11% 1.10%<br />
san-ai oil Co ltd oil & Gas 228 278 0.01% 0.01%<br />
sanden Corp Consumer Goods 22 818 140 0.90% 0.90%<br />
sangetsu Co ltd Consumer Goods 25 205 304 0.41% 0.41%<br />
san-in Godo bank ltd/the Financials 48 962 787 0.65% 0.65%<br />
sankei building Co ltd/the Financials 1 069 918 0.07% 0.07%<br />
sanken electric Co ltd technology 13 271 126 0.56% 0.56%<br />
sanki engineering Co ltd industrials 9 300 120 0.40% 0.40%<br />
sankyo Co ltd Consumer services 229 743 141 0.78% 0.78%<br />
sankyo seiko Co ltd Consumer Goods 3 210 438 0.26% 0.26%<br />
sankyo-t<strong>at</strong>eyama <strong>Holding</strong>s inc industrials 37 742 048 1.33% 1.33%<br />
Country associ<strong>at</strong>ion according to Ftse (the benchmark provider for <strong>equities</strong>). if a company is not in the benchmark, the country <strong>of</strong> incorpor<strong>at</strong>ion is listed. sector classific<strong>at</strong>ion according to iCb (the industry Classific<strong>at</strong>ion<br />
benchmark company).<br />
voting<br />
ownership<br />
HOLdiNgs<br />
22<br />
<strong>Government</strong> <strong>Pension</strong> FunD <strong>Global</strong> ANNUAL REPORT 2011
<strong>Government</strong> <strong>Pension</strong> <strong>Fund</strong> <strong>Global</strong> <strong>Holding</strong> <strong>of</strong> <strong>equities</strong> <strong>at</strong> <strong>31</strong> December 2011<br />
sector<br />
market value<br />
(noK)<br />
sankyu inc industrials 36 272 865 0.49% 0.49%<br />
sanoh industrial Co ltd Consumer Goods 1 774 127 0.11% 0.11%<br />
sanrio Co ltd Consumer Goods 105 653 192 0.39% 0.39%<br />
sanshin electronics Co ltd industrials 2 706 241 0.18% 0.18%<br />
santen Pharmaceutical Co ltd Health Care 104 501 178 0.49% 0.49%<br />
sanwa <strong>Holding</strong>s Corp industrials 68 720 626 1.49% 1.49%<br />
sanyo Chemical industries ltd basic m<strong>at</strong>erials 12 133 927 0.26% 0.26%<br />
sanyo Denki Co ltd industrials 7 567 755 0.38% 0.38%<br />
sanyo shokai ltd Consumer Goods 4 981 695 0.29% 0.29%<br />
sanyo special steel Co ltd basic m<strong>at</strong>erials 22 406 107 0.42% 0.42%<br />
sapporo Hokuyo <strong>Holding</strong>s inc Financials 51 281 429 0.60% 0.60%<br />
sapporo <strong>Holding</strong>s ltd Consumer Goods 44 308 422 0.50% 0.50%<br />
sasebo Heavy industries Co ltd industrials 3 597 136 0.23% 0.23%<br />
s<strong>at</strong>o <strong>Holding</strong> Corp technology 52 344 863 2.21% 2.21%<br />
sawai Pharmaceutical Co ltd Health Care 261 022 673 2.66% 2.66%<br />
sbi <strong>Holding</strong>s inc/Japan Financials 278 400 046 2.84% 2.84%<br />
sbs <strong>Holding</strong>s inc industrials 17 035 790 2.56% 2.56%<br />
sCsK Corp technology 39 264 246 0.38% 0.38%<br />
seC Carbon ltd industrials 2 083 896 0.24% 0.24%<br />
secom Co ltd industrials 309 355 747 0.48% 0.48%<br />
sega sammy <strong>Holding</strong>s inc Consumer Goods 165 612 480 0.48% 0.48%<br />
seika Corp industrials 2 305 658 0.18% 0.18%<br />
seikagaku Corp Health Care 5 8<strong>31</strong> 619 0.15% 0.15%<br />
seiko epson Corp technology 1<strong>31</strong> 269 218 0.83% 0.83%<br />
seiko <strong>Holding</strong>s Corp Consumer Goods 60 358 205 2.64% 2.64%<br />
seino <strong>Holding</strong>s Corp industrials 47 047 986 0.49% 0.49%<br />
seiren Co ltd Consumer Goods 44 834 678 1.98% 1.98%<br />
sekisui Chemical Co ltd Consumer Goods 307 643 438 1.16% 1.16%<br />
sekisui House ltd Consumer Goods 173 981 125 0.49% 0.49%<br />
sekisui Jushi Corp industrials 5 062 596 0.18% 0.18%<br />
sekisui Plastics Co ltd basic m<strong>at</strong>erials 2 013 621 0.09% 0.09%<br />
senko Co ltd industrials 9 494 113 0.<strong>31</strong>% 0.<strong>31</strong>%<br />
senshu ikeda <strong>Holding</strong>s inc Financials 59 034 418 0.56% 0.56%<br />
senshukai Co ltd Consumer services 3 260 274 0.17% 0.17%<br />
seria Co ltd Consumer services 20 203 690 0.80% 0.80%<br />
seven & i <strong>Holding</strong>s Co ltd Consumer services 711 364 817 0.48% 0.48%<br />
seven bank ltd Financials 100 011 944 0.72% 0.72%<br />
sFCG Co ltd Financials 0 0.01% 0.01%<br />
sharp Corp/Japan Consumer Goods 82 065 998 0.14% 0.14%<br />
shibaura electronics Co ltd industrials 26 036 210 3.00% 3.00%<br />
shibaura mech<strong>at</strong>ronics Corp industrials 89 822 0.01% 0.01%<br />
shibusawa Warehouse Co ltd/the industrials 2 167 978 0.17% 0.17%<br />
shiga bank ltd/the Financials 53 082 022 0.49% 0.49%<br />
shikoku bank ltd/the Financials 15 1<strong>31</strong> 243 0.<strong>31</strong>% 0.<strong>31</strong>%<br />
shikoku Chemicals Corp basic m<strong>at</strong>erials 1 721 506 0.09% 0.09%<br />
shikoku electric Power Co inc utilities 53 566 711 0.14% 0.14%<br />
shima seiki manufacturing ltd industrials 16 753 426 0.45% 0.45%<br />
shimachu Co ltd Consumer services 127 649 750 1.81% 1.81%<br />
shimadzu Corp industrials 70 499 066 0.47% 0.47%<br />
shimamura Co ltd Consumer services 135 336 026 0.60% 0.60%<br />
shimano inc Consumer Goods 160 511 172 0.59% 0.59%<br />
shimizu bank ltd/the Financials 3 276 400 0.16% 0.16%<br />
shimizu Corp industrials 96 760 381 0.49% 0.49%<br />
shimojima Co ltd industrials 142 218 0.01% 0.01%<br />
shinagawa refractories Co ltd industrials 33 210 781 2.04% 2.04%<br />
shindengen electric manufacturing Co ltd technology 400 863 0.02% 0.02%<br />
shin-etsu Chemical Co ltd basic m<strong>at</strong>erials 368 844 910 0.29% 0.29%<br />
shin-etsu Polymer Co ltd basic m<strong>at</strong>erials 2 355 068 0.11% 0.11%<br />
shinkawa ltd technology 103 753 0.02% 0.02%<br />
shin-Keisei electric railway Co ltd Consumer services 162 889 0.01% 0.01%<br />
shinko electric industries Co ltd technology 15 469 386 0.28% 0.28%<br />
shinko Plantech Co ltd industrials 3 521 975 0.16% 0.16%<br />
shinko shoji Co ltd technology 13 379 044 1.14% 1.14%<br />
shin-Kobe electric machinery Co ltd industrials 48 167 422 0.71% 0.71%<br />
shinmaywa industries ltd industrials 4 889 468 0.17% 0.17%<br />
shinsei bank ltd Financials 192 379 026 1.13% 1.13%<br />
shinwa Co ltd/nagoya industrials 1 453 786 0.15% 0.15%<br />
shionogi & Co ltd Health Care 129 815 445 0.48% 0.48%<br />
ship Healthcare <strong>Holding</strong>s inc Health Care 28 473 007 0.53% 0.53%<br />
shiroki Corp Consumer Goods 100 991 0.01% 0.01%<br />
shiseido Co ltd Consumer Goods 435 479 608 0.99% 0.99%<br />
shizuki electric Co inc industrials 3 966 895 0.55% 0.55%<br />
shizuoka bank ltd/the Financials 211 <strong>31</strong>2 435 0.49% 0.49%<br />
shizuoka Gas Co ltd utilities 48 720 974 1.69% 1.69%<br />
sHo-bonD <strong>Holding</strong>s Co ltd industrials 17 515 258 0.46% 0.46%<br />
shochiku Co ltd Consumer services 18 597 913 0.24% 0.24%<br />
shoei Co ltd/Chiyoda-ku Financials 3 001 458 0.29% 0.29%<br />
shoko Co ltd basic m<strong>at</strong>erials 158 235 0.02% 0.02%<br />
showa Corp Consumer Goods 5 682 506 0.22% 0.22%<br />
showa Denko KK basic m<strong>at</strong>erials 89 495 534 0.49% 0.49%<br />
showa sangyo Co ltd Consumer Goods 2 849 397 0.09% 0.09%<br />
showa shell sekiyu KK oil & Gas 72 204 780 0.48% 0.48%<br />
siix Corp industrials 5 906 362 0.<strong>31</strong>% 0.<strong>31</strong>%<br />
simplex <strong>Holding</strong>s inc technology 80 989 0.01% 0.01%<br />
sinanen Co ltd oil & Gas 237 353 0.01% 0.01%<br />
sinfonia technology Co ltd industrials 1 826 686 0.10% 0.10%<br />
sinko industries ltd industrials 15 416 299 2.76% 2.76%<br />
sintokogio ltd industrials 5 074 929 0.17% 0.17%<br />
sKY Perfect Js<strong>at</strong> <strong>Holding</strong>s inc Consumer services 10 567 297 0.10% 0.10%<br />
skymark airlines inc Consumer services 57 628 097 0.80% 0.80%<br />
smC Corp/Japan industrials 781 296 681 1.13% 1.13%<br />
voting<br />
ownership<br />
sector<br />
market value<br />
(noK)<br />
smK Corp industrials 6 122 540 0.40% 0.40%<br />
sodick Co ltd industrials 14 828 866 0.95% 0.95%<br />
s<strong>of</strong>tbank Corp telecommunic<strong>at</strong>ions 1 475 053 375 0.76% 0.76%<br />
sohgo security services Co ltd industrials 17 043 423 0.27% 0.27%<br />
sojitz Corp industrials 76 526 377 0.66% 0.66%<br />
so-net entertainment Corp technology 16 055 748 0.29% 0.29%<br />
sony Corp Consumer Goods 604 860 418 0.54% 0.56%<br />
sony Financial <strong>Holding</strong>s inc Financials 1 220 614 451 3.19% 3.19%<br />
sosei Group Corp Health Care 51 412 989 4.41% 4.42%<br />
sotetsu <strong>Holding</strong>s inc Consumer services 46 221 749 0.51% 0.51%<br />
square enix <strong>Holding</strong>s Co ltd technology 36 321 103 0.27% 0.27%<br />
sra <strong>Holding</strong>s technology 7 622 904 0.82% 0.82%<br />
sri sports ltd Consumer Goods 3 299 460 0.17% 0.17%<br />
st Corp basic m<strong>at</strong>erials 1 815 136 0.10% 0.10%<br />
st marc <strong>Holding</strong>s Co ltd Consumer services 8 072 440 0.<strong>31</strong>% 0.<strong>31</strong>%<br />
stanley electric Co ltd Consumer Goods 110 009 983 0.70% 0.70%<br />
star micronics Co ltd industrials 12 640 093 0.50% 0.50%<br />
start today Co ltd Consumer services 143 398 847 0.93% 0.93%<br />
starzen Co ltd Consumer Goods 1 164 658 0.07% 0.07%<br />
stella Chemifa Corp basic m<strong>at</strong>erials 101 845 867 4.56% 4.56%<br />
studio alice Co ltd Consumer services 139 968 0.01% 0.01%<br />
sugi <strong>Holding</strong>s Co ltd Consumer services 99 <strong>31</strong>7 920 0.90% 0.90%<br />
sumco Corp technology 18 637 816 0.16% 0.16%<br />
sumida Corp industrials 103 256 0.01% 0.01%<br />
sumikin bussan Corp basic m<strong>at</strong>erials 2 828 455 0.11% 0.11%<br />
sumitomo bakelite Co ltd basic m<strong>at</strong>erials 43 709 451 0.50% 0.50%<br />
sumitomo Chemical Co ltd basic m<strong>at</strong>erials 332 070 325 0.92% 0.92%<br />
sumitomo Corp industrials 888 937 950 0.88% 0.88%<br />
sumitomo electric industries ltd Consumer Goods 709 267 446 1.37% 1.37%<br />
sumitomo Forestry Co ltd Consumer Goods 53 156 908 0.57% 0.57%<br />
sumitomo Heavy industries ltd industrials 104 760 405 0.49% 0.49%<br />
sumitomo light metal industries ltd basic m<strong>at</strong>erials 17 303 642 0.54% 0.54%<br />
sumitomo metal industries ltd basic m<strong>at</strong>erials 42 747 577 0.08% 0.08%<br />
sumitomo metal mining Co ltd basic m<strong>at</strong>erials 210 221 774 0.47% 0.47%<br />
sumitomo mitsui Construction Co ltd industrials 110 369 0.01% 0.01%<br />
sumitomo mitsui Financial Group inc Financials 2 403 355 902 1.<strong>31</strong>% 1.<strong>31</strong>%<br />
sumitomo mitsui trust <strong>Holding</strong>s inc Financials 817 193 261 1.12% 1.12%<br />
sumitomo osaka Cement Co ltd industrials 44 141 670 0.63% 0.63%<br />
sumitomo Precision Products Co ltd industrials 5 625 262 0.29% 0.29%<br />
sumitomo real est<strong>at</strong>e sales Co ltd Financials 15 742 675 0.24% 0.24%<br />
sumitomo realty & Development Co ltd Financials 320 653 004 0.64% 0.64%<br />
sumitomo rubber industries ltd Consumer Goods 59 006 938 0.<strong>31</strong>% 0.<strong>31</strong>%<br />
sumitomo seika Chemicals Co ltd basic m<strong>at</strong>erials 2 010 518 0.11% 0.11%<br />
sumitomo Warehouse Co ltd/the industrials 16 420 783 0.30% 0.30%<br />
sundrug Co ltd Consumer services 21 073 053 0.17% 0.17%<br />
suruga bank ltd Financials 70 063 997 0.51% 0.51%<br />
suruga Corp Financials 0 0.05% 0.05%<br />
suzuken Co ltd Health Care 50 220 726 0.32% 0.32%<br />
suzuki motor Corp Consumer Goods 3<strong>31</strong> 827 590 0.48% 0.48%<br />
sWCC showa <strong>Holding</strong>s Co ltd industrials 10 186 005 0.61% 0.61%<br />
sysmex Corp Health Care 422 065 835 2.11% 2.11%<br />
t Hasegawa Co ltd basic m<strong>at</strong>erials 2 619 607 0.07% 0.07%<br />
t raD Co ltd Consumer Goods 44 088 289 2.67% 2.67%<br />
t&D <strong>Holding</strong>s inc Financials 559 896 495 1.48% 1.48%<br />
tachi-s Co ltd Consumer Goods 6 252 649 0.17% 0.17%<br />
tadano ltd industrials 20 130 <strong>31</strong>3 0.41% 0.41%<br />
taihei Dengyo Kaisha ltd industrials 10 320 660 0.52% 0.52%<br />
taihei Kogyo Co ltd industrials 8 173 159 0.33% 0.33%<br />
taiheiyo Cement Corp industrials 63 720 585 0.45% 0.45%<br />
taiho Kogyo Co ltd Consumer Goods 145 297 0.01% 0.01%<br />
taikisha ltd industrials 25 486 459 0.54% 0.54%<br />
taisei Corp industrials 84 949 926 0.49% 0.49%<br />
taisei lamick Co ltd industrials 900 265 0.08% 0.08%<br />
taisho Pharmaceutical <strong>Holding</strong>s Co ltd Health Care 200 282 077 0.48% 0.48%<br />
taiyo <strong>Holding</strong>s Co ltd basic m<strong>at</strong>erials 9 735 748 0.23% 0.23%<br />
taiyo nippon sanso Corp basic m<strong>at</strong>erials 84 079 397 0.50% 0.50%<br />
taiyo Yuden Co ltd industrials 36 865 084 0.69% 0.69%<br />
takam<strong>at</strong>su Construction Group Co ltd industrials 189 107 0.01% 0.01%<br />
takaoka electric manufacturing Co ltd industrials 6 322 428 0.47% 0.47%<br />
takara <strong>Holding</strong>s inc Consumer Goods 40 391 867 0.48% 0.48%<br />
takara leben Co ltd Financials 49 <strong>31</strong>5 217 4.19% 4.19%<br />
takara standard Co ltd Consumer Goods 14 400 801 0.22% 0.22%<br />
takasago intern<strong>at</strong>ional Corp basic m<strong>at</strong>erials 6 202 821 0.22% 0.22%<br />
takasago thermal engineering Co ltd industrials 13 463 909 0.<strong>31</strong>% 0.<strong>31</strong>%<br />
takashimaya Co ltd Consumer services 67 118 241 0.47% 0.47%<br />
tak<strong>at</strong>a Corp Consumer Goods 34 216 226 0.34% 0.34%<br />
takeda Pharmaceutical Co ltd Health Care 998 662 360 0.48% 0.48%<br />
takihyo Co ltd Consumer Goods 1 738 260 0.11% 0.11%<br />
takiron Co ltd industrials 1 700 563 0.11% 0.11%<br />
takuma Co ltd industrials 13 726 130 0.64% 0.64%<br />
tamron Co ltd Consumer Goods 17 558 548 0.44% 0.44%<br />
tamura Corp industrials 32 098 170 2.72% 2.72%<br />
tanaka Chemical Corp basic m<strong>at</strong>erials 11 856 868 2.08% 2.08%<br />
t<strong>at</strong>suta electric Wire and Cable Co ltd industrials 5 681 575 0.32% 0.32%<br />
tDK Corp industrials 250 718 942 0.73% 0.73%<br />
tecmo Koei <strong>Holding</strong>s Co ltd technology 7 671 616 0.17% 0.17%<br />
teijin ltd basic m<strong>at</strong>erials 90 643 397 0.50% 0.50%<br />
teikoku electric manufacturing Co ltd industrials 7 359 101 0.73% 0.73%<br />
tekken Corp industrials 546 610 0.05% 0.05%<br />
tenma Corp Consumer Goods 373 559 0.02% 0.02%<br />
tenpos busters Co ltd Consumer services 7 307 326 1.49% 1.48%<br />
Country associ<strong>at</strong>ion according to Ftse (the benchmark provider for <strong>equities</strong>). if a company is not in the benchmark, the country <strong>of</strong> incorpor<strong>at</strong>ion is listed. sector classific<strong>at</strong>ion according to iCb (the industry Classific<strong>at</strong>ion<br />
benchmark company).<br />
voting<br />
ownership<br />
HOLdiNgs<br />
23<br />
<strong>Government</strong> <strong>Pension</strong> FunD <strong>Global</strong> ANNUAL REPORT 2011
<strong>Government</strong> <strong>Pension</strong> <strong>Fund</strong> <strong>Global</strong> <strong>Holding</strong> <strong>of</strong> <strong>equities</strong> <strong>at</strong> <strong>31</strong> December 2011<br />
sector<br />
market value<br />
(noK)<br />
tera Probe inc technology 1 774 406 0.30% 0.30%<br />
terumo Corp Health Care 286 250 232 0.54% 0.54%<br />
t-Gaia Corp technology 52 923 259 0.93% 0.93%<br />
tHK Co ltd industrials 245 467 329 1.56% 1.56%<br />
tKC Corp industrials 2 987 217 0.09% 0.09%<br />
toa Corp/Hyogo industrials 21 660 928 1.64% 1.64%<br />
toa Corp/tokyo industrials 10 134 035 0.45% 0.45%<br />
toa oil Co ltd oil & Gas 85 633 0.01% 0.01%<br />
toagosei Co ltd basic m<strong>at</strong>erials 32 452 493 0.50% 0.50%<br />
tobishima Corp industrials 1 570 105 0.23% 0.23%<br />
tobu railway Co ltd Consumer services 211 104 682 0.64% 0.64%<br />
toC Co ltd Financials 16 012 008 0.43% 0.43%<br />
tocalo Co ltd basic m<strong>at</strong>erials 69 480 683 3.47% 3.47%<br />
tochigi bank ltd/the Financials 68 763 443 2.81% 2.81%<br />
toda Corp industrials 36 765 765 0.52% 0.52%<br />
toda Kogyo Corp basic m<strong>at</strong>erials 58 883 282 2.28% 2.28%<br />
toei Co ltd Consumer services 10 503 639 0.25% 0.25%<br />
toenec Corp industrials 2 129 660 0.07% 0.07%<br />
toho bank ltd/the Financials 14 149 176 0.32% 0.32%<br />
toho Co ltd/Kobe Consumer services 1 182 033 0.09% 0.09%<br />
toho Co ltd/tokyo Consumer services 92 873 557 0.46% 0.46%<br />
toho Gas Co ltd utilities 102 202 113 0.49% 0.49%<br />
toho <strong>Holding</strong>s Co ltd Health Care 21 741 900 0.34% 0.34%<br />
toho real est<strong>at</strong>e Co ltd Financials 2 934 651 0.17% 0.17%<br />
toho titanium Co ltd basic m<strong>at</strong>erials 17 625 969 0.28% 0.28%<br />
toho Zinc Co ltd basic m<strong>at</strong>erials 13 340 703 0.43% 0.43%<br />
tohoku electric Power Co inc utilities 47 660 866 0.17% 0.17%<br />
tohokushinsha Film Corp Consumer services 37 643 810 1.99% 1.99%<br />
tokai Carbon Co ltd basic m<strong>at</strong>erials 38 193 949 0.52% 0.52%<br />
toKai <strong>Holding</strong>s Corp utilities 3 703 790 0.08% 0.08%<br />
tokai rika Co ltd Consumer Goods 22 670 616 0.26% 0.26%<br />
tokai rubber industries ltd Consumer Goods 15 283 894 0.22% 0.22%<br />
tokai tokyo Financial <strong>Holding</strong>s inc Financials 9 661 967 0.21% 0.21%<br />
token Corp Consumer Goods 5 997 984 0.22% 0.22%<br />
tokio marine <strong>Holding</strong>s inc Financials 443 171 481 0.42% 0.42%<br />
toko inc industrials 5 232 001 0.52% 0.52%<br />
tokuyama Corp basic m<strong>at</strong>erials 46 186 195 0.70% 0.69%<br />
tokyo broadcasting system <strong>Holding</strong>s inc Consumer services 13 572 435 0.09% 0.09%<br />
tokyo Dome Corp Consumer services 11 933 263 0.42% 0.42%<br />
tokyo electric Power Co inc/the utilities 359 361 053 1.58% 1.58%<br />
tokyo electron Device ltd technology 137 440 0.01% 0.01%<br />
tokyo electron ltd technology 221 108 144 0.40% 0.40%<br />
tokyo energy & systems inc industrials 1 303 114 0.11% 0.11%<br />
tokyo Gas Co ltd utilities 364 203 671 0.51% 0.51%<br />
tokyo ohka Kogyo Co ltd technology 29 308 483 0.53% 0.53%<br />
tokyo rakutenchi Co ltd Financials 174 369 0.01% 0.01%<br />
tokyo rope manufacturing Co ltd basic m<strong>at</strong>erials 8 225 905 0.43% 0.43%<br />
tokyo seimitsu Co ltd technology 19 788 036 0.42% 0.42%<br />
tokyo steel manufacturing Co ltd basic m<strong>at</strong>erials 36 970 915 0.49% 0.49%<br />
tokyo t<strong>at</strong>emono Co ltd Financials 59 875 665 0.77% 0.76%<br />
tokyo tekko Co ltd basic m<strong>at</strong>erials 169 870 0.02% 0.02%<br />
tokyo tomin bank ltd/the Financials 17 246 871 0.59% 0.59%<br />
tokyotokeiba Co ltd Consumer services 2 133 849 0.09% 0.09%<br />
tokyu Community Corp Financials 1 827 400 0.07% 0.07%<br />
tokyu Construction Co ltd industrials 1 743 066 0.11% 0.11%<br />
tokyu Corp Consumer services 179 193 941 0.48% 0.48%<br />
tokyu land Corp Financials 56 000 609 0.47% 0.47%<br />
tokyu livable inc Financials 23 969 844 1.09% 1.09%<br />
toli Corp industrials 944 757 0.13% 0.13%<br />
tomen electronics Corp technology 144 273 0.01% 0.01%<br />
tomoku Co ltd industrials 1 060 176 0.07% 0.07%<br />
tomonY <strong>Holding</strong>s inc Financials 26 201 674 0.65% 0.65%<br />
tomy Co ltd Consumer Goods 17 280 512 0.43% 0.43%<br />
tonami <strong>Holding</strong>s Co ltd industrials 896 666 0.07% 0.07%<br />
tonenGeneral sekiyu KK oil & Gas 118 985 <strong>31</strong>0 0.32% 0.32%<br />
topcon Corp Health Care 1 173 035 0.05% 0.05%<br />
toppan Forms Co ltd industrials 7 781 <strong>31</strong>8 0.15% 0.15%<br />
toppan Printing Co ltd industrials 149 985 268 0.49% 0.49%<br />
topre Corp Consumer Goods 2 753 859 0.09% 0.09%<br />
topy industries ltd industrials 58 464 191 1.66% 1.66%<br />
toray industries inc basic m<strong>at</strong>erials 293 917 374 0.42% 0.42%<br />
toridoll.corp Consumer services 2 837 064 0.13% 0.13%<br />
torii Pharmaceutical Co ltd Health Care 381 083 0.01% 0.01%<br />
torishima Pump manufacturing Co ltd industrials 8 437 567 0.37% 0.37%<br />
tosei Corp Financials 15 742 378 2.25% 2.25%<br />
toshiba Corp industrials 564 468 885 0.55% 0.55%<br />
toshiba machine Co ltd industrials 47 190 087 0.94% 0.94%<br />
toshiba Plant systems & services Corp industrials 15 144 817 0.26% 0.26%<br />
toshiba teC Corp industrials 18 022 682 0.29% 0.29%<br />
toshin Group Co ltd Consumer Goods 26 645 493 1.61% 1.61%<br />
tosho Printing Co ltd industrials 110 920 0.01% 0.01%<br />
tosoh Corp basic m<strong>at</strong>erials 45 459 273 0.47% 0.47%<br />
totetsu Kogyo Co ltd industrials 3 748 468 0.20% 0.20%<br />
toto ltd industrials 120 249 600 0.70% 0.70%<br />
towa bank ltd/the Financials 8 401 437 0.40% 0.40%<br />
towa Pharmaceutical Co ltd Health Care 10 013 846 0.23% 0.23%<br />
toyo Construction Co ltd industrials 8 144 460 0.39% 0.39%<br />
toyo Corp/Chuo-ku industrials 3 436 729 0.18% 0.18%<br />
toyo Denki seizo - toyo electric<br />
manufacturing Co ltd industrials 2 912 459 0.26% 0.26%<br />
toyo engineering Corp industrials 12 095 687 0.29% 0.29%<br />
voting<br />
ownership<br />
sector<br />
market value<br />
(noK)<br />
toyo ink sC <strong>Holding</strong>s Co ltd basic m<strong>at</strong>erials 21 575 838 0.32% 0.32%<br />
toyo Kanetsu KK industrials 2 573 649 0.17% 0.17%<br />
toyo Kohan Co ltd basic m<strong>at</strong>erials 28 906 <strong>31</strong>7 1.39% 1.39%<br />
toyo securities Co ltd Financials 1 258 435 0.17% 0.17%<br />
toyo seikan Kaisha ltd industrials 87 128 293 0.49% 0.49%<br />
toyo suisan Kaisha ltd Consumer Goods 79 708 278 0.50% 0.50%<br />
toyo tanso Co ltd basic m<strong>at</strong>erials 60 561 506 1.19% 1.19%<br />
toyo tire & rubber Co ltd Consumer Goods 6 013 326 0.17% 0.17%<br />
toyo Wharf & Warehouse Co ltd industrials 155 133 0.02% 0.02%<br />
toyobo Co ltd Consumer Goods 45 957 093 0.64% 0.64%<br />
toyoda Gosei Co ltd Consumer Goods <strong>31</strong> 721 438 0.26% 0.26%<br />
toyota auto body Co ltd Consumer Goods 15 360 684 0.15% 0.15%<br />
toyota boshoku Corp Consumer Goods 32 438 407 0.28% 0.28%<br />
toyota industries Corp Consumer Goods 106 004 192 0.20% 0.20%<br />
toyota motor Corp Consumer Goods 3 030 222 938 0.44% 0.44%<br />
toyota tsusho Corp basic m<strong>at</strong>erials 91 335 920 0.24% 0.24%<br />
tPr Co ltd Consumer Goods 50 045 814 2.01% 2.01%<br />
trancom Co ltd industrials 16 862 662 1.44% 1.44%<br />
transcosmos inc technology 5 499 589 0.16% 0.16%<br />
trend micro inc technology 168 711 990 0.67% 0.67%<br />
trusco nakayama Corp industrials 70 209 806 1.95% 1.95%<br />
ts tech Co ltd Consumer Goods 18 305 519 0.28% 0.28%<br />
tsi <strong>Holding</strong>s Co ltd Consumer Goods 46 740 870 1.37% 1.37%<br />
tsubakimoto Chain Co industrials 25 250 929 0.43% 0.43%<br />
tsugami Corp industrials 12 537 582 0.44% 0.44%<br />
tsukishima Kikai Co ltd industrials 26 569 866 1.19% 1.19%<br />
tsukuba bank ltd Financials 7 696 639 0.48% 0.48%<br />
tsumura & Co Health Care 58 668 346 0.47% 0.47%<br />
tsuruha <strong>Holding</strong>s inc Consumer services 20 736 610 0.26% 0.26%<br />
tsurumi manufacturing Co ltd industrials 265 277 0.02% 0.02%<br />
tsutsumi Jewelry Co ltd Consumer services 3 232 808 0.11% 0.11%<br />
tv asahi Corp Consumer services 9 616 769 0.10% 0.10%<br />
tv tokyo <strong>Holding</strong>s Corp Consumer services 1 273 794 0.06% 0.06%<br />
ube industries ltd/Japan basic m<strong>at</strong>erials 95 020 922 0.58% 0.58%<br />
ubic inc technology 14 238 067 0.99% 0.99%<br />
uchida Yoko Co ltd Consumer Goods 1 472 984 0.17% 0.17%<br />
uKC <strong>Holding</strong>s Corp technology 73 409 0.01% 0.01%<br />
ulvac inc industrials 15 515 863 0.43% 0.43%<br />
unicharm Corp Consumer Goods 45 832 483 0.08% 0.08%<br />
uniden Corp technology 7 264 393 0.57% 0.57%<br />
union tool Co industrials 1 695 692 0.07% 0.07%<br />
unipres Corp Consumer Goods 43 992 246 0.55% 0.55%<br />
united arrows ltd Consumer services 11 411 087 0.23% 0.23%<br />
unitika ltd Consumer Goods 9 411 738 0.50% 0.50%<br />
unY Co ltd Consumer services 51 248 526 0.48% 0.48%<br />
u-shin ltd Consumer Goods 197 173 0.01% 0.01%<br />
ushio inc industrials 56 660 062 0.47% 0.47%<br />
uss Co ltd Consumer services 84 607 070 0.50% 0.50%<br />
v technology Co ltd industrials 5 301 462 0.41% 0.41%<br />
valor Co ltd Consumer services 43 498 746 0.89% 0.89%<br />
village vanguard Co ltd Consumer services 20 720 158 2.80% 2.80%<br />
vital KsK <strong>Holding</strong>s inc Health Care 112 937 0.00% 0.00%<br />
Wacoal <strong>Holding</strong>s Corp Consumer Goods 55 015 284 0.48% 0.48%<br />
Wacom Co ltd/Japan technology 18 397 218 0.48% 0.48%<br />
Warabeya nichiyo Co ltd Consumer Goods 1 270 652 0.10% 0.10%<br />
W<strong>at</strong>abe Wedding Corp Consumer services 13 024 543 2.39% 2.39%<br />
W<strong>at</strong>ami Co ltd Consumer services 34 852 859 0.59% 0.59%<br />
West Japan railway Co Consumer services 250 326 260 0.48% 0.48%<br />
Wood one Co ltd industrials 2 371 977 0.22% 0.22%<br />
Wowow inc Consumer services 16 758 041 0.78% 0.78%<br />
Xebio Co ltd Consumer services 125 321 862 1.84% 1.84%<br />
Yachiyo bank ltd/the Financials 5 047 766 0.22% 0.22%<br />
Yachiyo industry Co ltd Consumer Goods 8 936 334 1.04% 1.04%<br />
Yahagi Construction Co ltd industrials 5 187 633 0.39% 0.39%<br />
Yahoo Japan Corp technology 213 742 185 0.19% 0.19%<br />
Yakult Honsha Co ltd Consumer Goods 46 629 554 0.14% 0.14%<br />
YamabiKo Corp industrials 107 062 0.01% 0.01%<br />
Yamada Denki Co ltd Consumer services <strong>31</strong>0 540 396 0.79% 0.79%<br />
Yamag<strong>at</strong>a bank ltd/the Financials 14 524 132 0.29% 0.29%<br />
Yamaguchi Financial Group inc Financials 82 324 201 0.55% 0.55%<br />
Yamaha Corp Consumer Goods 51 218 709 0.47% 0.47%<br />
Yamaha motor Co ltd Consumer Goods 127 391 671 0.48% 0.48%<br />
Yamanashi Chuo bank ltd/the Financials 20 563 675 0.46% 0.46%<br />
Yam<strong>at</strong>ake Corp industrials 145 388 523 1.49% 1.49%<br />
Yam<strong>at</strong>o <strong>Holding</strong>s Co ltd industrials 227 036 081 0.48% 0.48%<br />
Yam<strong>at</strong>o Kogyo Co ltd basic m<strong>at</strong>erials 73 728 383 0.61% 0.61%<br />
Yamazaki baking Co ltd Consumer Goods 66 264 490 0.38% 0.38%<br />
Yamazen Corp industrials 4 672 221 0.11% 0.11%<br />
Yaoko Co ltd Consumer services 9 298 336 0.23% 0.23%<br />
Yaskawa electric Corp industrials 273 359 712 2.13% 2.13%<br />
Yellow H<strong>at</strong> ltd Consumer services 16 659 470 0.70% 0.70%<br />
Yodogawa steel Works ltd basic m<strong>at</strong>erials 6 709 949 0.14% 0.14%<br />
Yokogawa bridge <strong>Holding</strong>s Corp industrials 2 775 632 0.16% 0.16%<br />
Yokogawa electric Corp industrials 72 646 594 0.50% 0.50%<br />
Yokohama reito Co ltd Consumer Goods 4 043 065 0.16% 0.16%<br />
Yokohama rubber Co ltd/the Consumer Goods 54 853 636 0.48% 0.48%<br />
Yokowo Co ltd Consumer Goods 111 075 0.02% 0.02%<br />
Yomiuri land Co ltd Consumer services 1 432 494 0.09% 0.09%<br />
Yonekyu Corp Consumer Goods 3 309 366 0.20% 0.20%<br />
Yorozu Corp Consumer Goods 8 768 046 0.30% 0.30%<br />
Yoshinoya <strong>Holding</strong>s Co ltd Consumer services 19 117 607 0.34% 0.34%<br />
Country associ<strong>at</strong>ion according to Ftse (the benchmark provider for <strong>equities</strong>). if a company is not in the benchmark, the country <strong>of</strong> incorpor<strong>at</strong>ion is listed. sector classific<strong>at</strong>ion according to iCb (the industry Classific<strong>at</strong>ion<br />
benchmark company).<br />
voting<br />
ownership<br />
HOLdiNgs<br />
24<br />
<strong>Government</strong> <strong>Pension</strong> FunD <strong>Global</strong> ANNUAL REPORT 2011
<strong>Government</strong> <strong>Pension</strong> <strong>Fund</strong> <strong>Global</strong> <strong>Holding</strong> <strong>of</strong> <strong>equities</strong> <strong>at</strong> <strong>31</strong> December 2011<br />
sector<br />
market value<br />
(noK)<br />
Yuasa trading Co ltd industrials 3 470 936 0.17% 0.17%<br />
Yurtec Corp industrials 3 119 328 0.13% 0.13%<br />
Yusen logistics Co ltd industrials <strong>31</strong> 832 785 0.98% 0.98%<br />
Yushin Precision equipment Co ltd industrials 42 127 517 2.11% 2.11%<br />
Yushiro Chemical industry Co ltd basic m<strong>at</strong>erials 8 823 382 0.88% 0.88%<br />
Zappallas inc Consumer services 1 587 177 0.20% 0.20%<br />
Zenrin Co ltd Consumer services 2 559 928 0.13% 0.13%<br />
Zensho <strong>Holding</strong>s Co ltd Consumer services 33 969 689 0.35% 0.35%<br />
Zeon Corp basic m<strong>at</strong>erials 58 215 674 0.46% 0.46%<br />
Zeria Pharmaceutical Co ltd Health Care 4 329 595 0.09% 0.09%<br />
Zuken inc industrials 1 890 515 0.20% 0.20%<br />
JERsEy C.i.<br />
max Property Group PlC Financials 34 873 215 1.82% 1.82%<br />
kAzAkHsTAN<br />
Kazakhtelecom JsC telecommunic<strong>at</strong>ions 3 004 792 0.00% 0.03%<br />
Kazkommertsbank JsC Financials 35 768 695 0.00% 5.01%<br />
KazmunaiGas explor<strong>at</strong>ion Production oil & Gas 135 448 764 0.09% 0.36%<br />
LiTHUANiA<br />
avia solutions Group ab Consumer services 1 573 739 0.54% 0.54%<br />
LUxEmBOURg<br />
oriflame Cosmetics sa Consumer Goods 278 710 146 2.58% 2.58%<br />
reinet investments sCa Financials 106 280 023 0.52% 0.52%<br />
rtl Group sa Consumer services 46 135 <strong>31</strong>2 0.05% 0.05%<br />
mALAysiA<br />
affin <strong>Holding</strong>s bhd Financials 6 451 425 0.07% 0.07%<br />
airasia bHD Consumer services 164 485 978 0.83% 0.83%<br />
alam maritim resources bhd oil & Gas 36 240 996 3.22% 3.22%<br />
alliance Financial Group bhd Financials 76 815 085 0.67% 0.67%<br />
ammb <strong>Holding</strong>s bhd Financials 898 374 0.00% 0.00%<br />
ann Joo resources bhd basic m<strong>at</strong>erials 13 096 295 0.77% 0.77%<br />
aPm automotive <strong>Holding</strong>s bhd Consumer Goods 4 007 064 0.24% 0.24%<br />
axi<strong>at</strong>a Group bhd telecommunic<strong>at</strong>ions 390 024 115 0.48% 0.48%<br />
b<strong>at</strong>u Kawan bHD basic m<strong>at</strong>erials <strong>31</strong> 260 122 0.22% 0.22%<br />
benalec <strong>Holding</strong>s bHD industrials 33 382 321 1.64% 1.64%<br />
berjaya Corp bhd Consumer services 64 110 118 0.57% 0.57%<br />
boustead <strong>Holding</strong>s bhd industrials 27 813 433 0.27% 0.27%<br />
bumi armada bhd oil & Gas 11 592 093 0.05% 0.05%<br />
Carlsberg brewery-malay bHD Consumer Goods 6 254 223 0.13% 0.13%<br />
Cimb Group <strong>Holding</strong>s bhd Financials 502 821 619 0.48% 0.48%<br />
Coastal Contracts bhd industrials 68 366 417 3.89% 3.89%<br />
CsF Group PlC technology 17 611 089 1.93% 1.93%<br />
Cypark resources bhd industrials 1 145 159 0.29% 0.29%<br />
Dialog Group bHD oil & Gas 150 680 287 1.52% 1.52%<br />
DiGi.Com bhd telecommunic<strong>at</strong>ions 10 767 010 0.02% 0.02%<br />
Drb-Hicom bhd industrials 127 021 592 1.71% 1.71%<br />
Faber Group bHD Health Care 20 119 740 1.64% 1.64%<br />
Felda <strong>Global</strong> ventures <strong>Holding</strong>s sdn bhd Consumer Goods 24 667 778 0.38% 0.38%<br />
Gamuda bhd industrials 160 773 501 1.22% 1.22%<br />
Genting bhd Consumer services 110 726 746 0.14% 0.14%<br />
Genting malaysia bHD Consumer services 138 881 219 0.33% 0.33%<br />
Genting Plant<strong>at</strong>ions bhd Consumer Goods 26 670 863 0.22% 0.22%<br />
Hong leong Financial Group bhd Financials 30 688 216 0.13% 0.13%<br />
iJm Corp bHD industrials 173 488 192 1.18% 1.18%<br />
iJm land bhd Financials 7 032 015 0.12% 0.12%<br />
Kencana Petroleum bhd oil & Gas 190 792 779 1.71% 1.71%<br />
Kimlun Corp bhd industrials 19 670 851 3.33% 3.33%<br />
Kinsteel bhd basic m<strong>at</strong>erials 16 229 718 1.64% 1.64%<br />
Knm Group bhd oil & Gas 37 718 995 2.02% 2.02%<br />
KPJ Healthcare bhd Health Care 79 858 400 1.54% 1.54%<br />
Ksl <strong>Holding</strong>s bHD Financials 1 623 252 0.16% 0.16%<br />
Kuala lumpur Kepong bhd Consumer Goods 21 367 897 0.05% 0.05%<br />
Kulim malaysia bHD Consumer Goods 68 767 076 0.69% 0.69%<br />
lafarge malayan Cement bhd industrials 20 489 836 0.18% 0.18%<br />
lion industries Corp bhd basic m<strong>at</strong>erials 13 020 297 0.72% 0.72%<br />
mah sing Group bhd Financials 24 439 546 0.74% 0.74%<br />
malayan banking bhd Financials 753 372 090 0.61% 0.61%<br />
malaysia building society Financials 34 137 404 0.79% 0.79%<br />
malaysia steel Works Kl bhd basic m<strong>at</strong>erials 6 551 567 1.42% 1.42%<br />
malaysian Pacific industries bhd technology 1 680 240 0.15% 0.15%<br />
malaysian resources Corp bhd industrials 199 420 243 3.54% 3.54%<br />
maxis bhd telecommunic<strong>at</strong>ions 68 910 534 0.09% 0.09%<br />
media Prima bhd Consumer services 80 416 978 1.54% 1.54%<br />
misC bhd industrials 47 530 458 0.10% 0.10%<br />
mmC Corp bhd utilities 67 907 338 0.43% 0.43%<br />
muhibbah engineering m bhd industrials 22 160 243 2.55% 2.55%<br />
multi-Purpose <strong>Holding</strong>s bHD Consumer services 86 543 087 1.20% 1.20%<br />
my eG services bhd industrials 23 103 083 3.19% 3.19%<br />
Padini <strong>Holding</strong>s bhd Consumer Goods 20 520 711 1.52% 1.52%<br />
Parkson <strong>Holding</strong>s bhd Consumer services 36 710 952 0.32% 0.32%<br />
Perdana Petroleum bhd oil & Gas 28 754 282 3.93% 3.93%<br />
Perisai Petroleum teknologi bhd oil & Gas 14 047 541 1.34% 1.34%<br />
Petronas Dagangan bHD oil & Gas 62 799 401 0.19% 0.19%<br />
Pharmaniaga bhd Health Care 1 771 997 0.15% 0.15%<br />
Public bank bhd Financials 308 922 403 0.35% 0.35%<br />
PureCircle ltd Consumer Goods 39 705 148 3.07% 3.07%<br />
rHb Capital bhd Financials 79 214 068 0.26% 0.26%<br />
sapuraCrest Petroleum bHD oil & Gas 140 594 397 1.27% 1.27%<br />
sime Darby bhd industrials 150 755 <strong>31</strong>2 0.14% 0.14%<br />
sP setia bhd Financials 104 269 584 0.78% 0.78%<br />
sunway bhd Financials 55 802 362 0.90% 0.90%<br />
ta ann <strong>Holding</strong>s bhd basic m<strong>at</strong>erials 17 671 053 0.56% 0.56%<br />
voting<br />
ownership<br />
sector<br />
market value<br />
(noK)<br />
tDm bHD Consumer Goods 11 150 375 0.66% 0.66%<br />
telekom malaysia bhd telecommunic<strong>at</strong>ions 58 370 994 0.17% 0.17%<br />
tenaga nasional bhd utilities 74 970 070 0.12% 0.12%<br />
time dotCom bhd telecommunic<strong>at</strong>ions 46 368 303 1.34% 1.34%<br />
tradewinds malaysia bhd Consumer Goods 62 970 834 1.12% 1.12%<br />
uem land <strong>Holding</strong>s bhd Financials 135 565 143 0.69% 0.69%<br />
united Plant<strong>at</strong>ions bHD Consumer Goods 9 425 407 0.13% 0.13%<br />
vitrox Corp bhd technology 1 681 951 0.44% 0.44%<br />
WCt bhd industrials 129 003 392 3.58% 3.58%<br />
WtK <strong>Holding</strong>s bHD industrials 23 568 771 2.30% 2.30%<br />
Ytl Cement bhd industrials 22 967 172 0.55% 0.55%<br />
Ytl Corp bhd utilities 32 112 142 0.13% 0.13%<br />
mExiCO<br />
alfa sab de Cv industrials 115 953 622 0.34% 0.34%<br />
america movil sab de Cv telecommunic<strong>at</strong>ions 759 471 175 0.47% 0.15%<br />
arca Continental sab de Cv Consumer Goods 102 190 408 0.25% 0.25%<br />
Coca-Cola Femsa sab de Cv Consumer Goods 163 956 <strong>31</strong>5 0.15% 0.15%<br />
Controladora Comercial mexicana sab de Cv Consumer services 64 390 819 0.60% 0.60%<br />
el Puerto de liverpool sab de Cv Consumer services 84 448 876 0.15% 0.15%<br />
empresas iCa sab de Cv industrials 59 759 772 1.29% 1.29%<br />
Fomento economico mexicano sab de Cv Consumer Goods 848 576 775 0.36% 0.57%<br />
Genomma lab internacional sab de Cv Health Care 63 338 252 0.52% 0.52%<br />
Grupo aeroportuario del Centro norte<br />
sab de Cv industrials 16 466 889 0.52% 0.44%<br />
Grupo aeroportuario del Pacifico sab de Cv industrials 73 803 916 0.50% 0.65%<br />
Grupo aeroportuario del sureste sab de Cv industrials 95 255 010 0.95% 0.95%<br />
Grupo bimbo sab de Cv Consumer Goods 66 239 009 0.12% 0.12%<br />
Grupo embotelladoras unidas sab de Cv industrials 1 169 892 0.01% 0.01%<br />
Grupo Famsa sab de Cv Consumer services 20 886 770 0.92% 0.92%<br />
Grupo mexico sab de Cv basic m<strong>at</strong>erials 850 012 512 0.70% 0.70%<br />
Grupo modelo sab de Cv Consumer Goods 324 519 585 0.00% 0.27%<br />
Grupo simec sab de Cv basic m<strong>at</strong>erials 25 114 818 0.35% 0.35%<br />
Grupo televisa sab Consumer services 100 421 2<strong>31</strong> 0.13% 0.13%<br />
impulsora del Desarrollo y el empleo en<br />
america l<strong>at</strong>ina sab de Cv industrials 55 422 286 0.20% 0.20%<br />
industrias CH sab de Cv basic m<strong>at</strong>erials 22 221 896 0.25% 0.25%<br />
industrias Penoles sab de Cv basic m<strong>at</strong>erials 445 940 513 0.43% 0.43%<br />
Kimberly-Clark de mexico sab de Cv Consumer Goods 65 328 985 0.19% 0.19%<br />
mexichem sab de Cv basic m<strong>at</strong>erials 112 595 805 0.33% 0.33%<br />
minera Frisco sab de Cv basic m<strong>at</strong>erials 36 388 387 0.07% 0.07%<br />
oHl mexico sab de Cv industrials 39 844 237 0.29% 0.29%<br />
organizacion soriana sab de Cv Consumer services 20 447 985 0.08% 0.08%<br />
Promotora y operadora de infraestructura<br />
sab de Cv industrials 35 952 054 0.42% 0.42%<br />
tv azteca sab de Cv Consumer services 73 794 375 0.68% 0.68%<br />
urbi Desarrollos urbanos sab de Cv Consumer Goods 10 4<strong>31</strong> 385 0.16% 0.16%<br />
mOROCCO<br />
Douja Promotion Groupe addoha sa Financials 32 675 349 0.21% 0.21%<br />
NETHERLANds<br />
aalberts industries nv industrials 249 658 405 2.30% 2.30%<br />
accell Group Consumer Goods 33 452 911 1.45% 1.45%<br />
aegon nv Financials 858 678 733 1.87% 1.87%<br />
akzo nobel nv basic m<strong>at</strong>erials 2 113 129 551 3.11% 3.11%<br />
amG advanced metallurgical Group nv industrials 69 501 464 4.29% 4.29%<br />
aPeram basic m<strong>at</strong>erials 121 814 249 1.85% 1.85%<br />
arcadis nv industrials 108 916 977 1.62% 1.62%<br />
arcelormittal basic m<strong>at</strong>erials 3 038 839 782 1.76% 1.78%<br />
asm intern<strong>at</strong>ional nv technology 288 450 722 3.01% 3.01%<br />
asml <strong>Holding</strong> nv technology 2 373 100 782 2.14% 2.19%<br />
beter bed <strong>Holding</strong> nv Consumer services 22 607 349 0.96% 0.96%<br />
binckbank nv Financials 119 974 301 2.50% 2.50%<br />
brunel intern<strong>at</strong>ional nv industrials 51 812 339 1.25% 1.25%<br />
Corio nv Financials 514 619 912 2.14% 2.14%<br />
Csm Consumer Goods 120 636 973 1.83% 1.83%<br />
Delta lloyd nv Financials 289 322 876 1.68% 1.68%<br />
eurocommercial Properties nv Financials 571 406 925 7.36% 7.36%<br />
Fugro nv oil & Gas 607 644 589 2.15% 2.15%<br />
Grontmij nv industrials 10 236 758 1.18% 1.18%<br />
Heijmans nv industrials 37 344 665 3.47% 3.47%<br />
Heineken <strong>Holding</strong> nv Consumer Goods 668 735 475 0.95% 0.95%<br />
Heineken nv Consumer Goods 1 341 282 005 0.84% 0.84%<br />
imtech nv industrials <strong>31</strong>8 562 825 2.24% 2.24%<br />
inG Groep nv Financials 3 615 103 352 2.19% 2.19%<br />
Kardan nv Financials 9 414 509 1.04% 1.04%<br />
Kas bank nv Financials 309 205 0.03% 0.03%<br />
Koninklijke ahold nv Consumer services 2 015 668 787 2.30% 2.30%<br />
Koninklijke bam Groep nv industrials 105 155 340 1.79% 1.79%<br />
Koninklijke boskalis Westminster nv industrials 359 048 574 1.58% 1.58%<br />
Koninklijke Dsm nv basic m<strong>at</strong>erials 1 238 302 966 2.46% 2.46%<br />
Koninklijke KPn nv telecommunic<strong>at</strong>ions 1 932 586 160 1.83% 1.83%<br />
Koninklijke Philips electronics nv Consumer Goods 2 573 672 302 2.02% 2.02%<br />
Koninklijke ten C<strong>at</strong>e nv industrials 101 791 691 2.38% 2.38%<br />
Koninklijke vopak nv industrials 342 852 984 0.85% 0.85%<br />
Koninklijke Wessanen nv Consumer Goods 43 185 998 2.59% 2.59%<br />
mediq nv Consumer services 114 691 624 2.08% 2.08%<br />
nieuwe steen investments nv Financials 106 670 601 3.22% 3.22%<br />
nutreco nv Consumer Goods 238 746 568 1.73% 1.73%<br />
ordina nv technology 16 610 403 2.42% 2.42%<br />
Postnl nv industrials 165 706 736 2.22% 2.22%<br />
randstad <strong>Holding</strong> nv industrials 481 262 041 1.59% 1.59%<br />
reed elsevier nv Consumer services 1 284 578 922 2.54% 2.54%<br />
Country associ<strong>at</strong>ion according to Ftse (the benchmark provider for <strong>equities</strong>). if a company is not in the benchmark, the country <strong>of</strong> incorpor<strong>at</strong>ion is listed. sector classific<strong>at</strong>ion according to iCb (the industry Classific<strong>at</strong>ion<br />
benchmark company).<br />
voting<br />
ownership<br />
HOLdiNgs<br />
25<br />
<strong>Government</strong> <strong>Pension</strong> FunD <strong>Global</strong> ANNUAL REPORT 2011
<strong>Government</strong> <strong>Pension</strong> <strong>Fund</strong> <strong>Global</strong> <strong>Holding</strong> <strong>of</strong> <strong>equities</strong> <strong>at</strong> <strong>31</strong> December 2011<br />
sector<br />
market value<br />
(noK)<br />
sbm <strong>of</strong>fshore nv oil & Gas 451 896 750 2.14% 2.14%<br />
sligro Food Group nv Consumer services 69 258 822 0.97% 0.97%<br />
sns reaal nv Financials 54 966 047 1.46% 1.46%<br />
tKH Group nv industrials 61 063 681 1.23% 1.23%<br />
tnt express nv industrials 390 736 986 1.61% 1.61%<br />
tomtom nv technology 42 695 004 0.81% 0.81%<br />
unilever nv Consumer Goods 6 420 916 362 1.82% 1.03%<br />
unit 4 nv technology 95 709 228 2.30% 2.30%<br />
usG People nv industrials 91 550 336 2.35% 2.35%<br />
vastned retail nv Financials 111 129 743 2.23% 2.23%<br />
vimpelCom ltd telecommunic<strong>at</strong>ions 510 581 412 0.55% 0.55%<br />
Wavin nv industrials 86 632 480 2.32% 2.32%<br />
Wereldhave nv Financials 194 892 605 2.26% 2.26%<br />
Wolters Kluwer nv Consumer services 488 005 839 1.56% 1.56%<br />
NEw zEALANd<br />
air new Zealand ltd Consumer services 6 900 033 0.15% 0.15%<br />
auckland intern<strong>at</strong>ional airport ltd industrials 92 040 276 0.59% 0.59%<br />
Chorus ltd telecommunic<strong>at</strong>ions 36 227 948 0.65% 0.65%<br />
Contact energy ltd utilities 67 644 100 0.39% 0.39%<br />
Fisher & Paykel appliances <strong>Holding</strong>s ltd Consumer Goods 10 477 116 0.86% 0.86%<br />
Fisher & Paykel Healthcare Corp ltd Health Care 40 841 856 0.66% 0.66%<br />
Fletcher building ltd industrials 137 143 458 0.71% 0.71%<br />
Freightways ltd industrials 15 768 125 0.60% 0.60%<br />
infr<strong>at</strong>il ltd industrials 23 430 883 0.45% 0.45%<br />
mainfreight ltd industrials 16 846 555 0.37% 0.37%<br />
new Zealand oil & Gas ltd oil & Gas 8 467 092 0.65% 0.65%<br />
nuplex industries ltd basic m<strong>at</strong>erials 11 820 865 0.56% 0.56%<br />
sky City entertainment Group ltd Consumer services 209 461 658 2.29% 2.29%<br />
sky network television ltd Consumer services 38 634 165 0.40% 0.40%<br />
telecom Corp <strong>of</strong> new Zealand ltd telecommunic<strong>at</strong>ions 18 063 265 0.10% 0.10%<br />
tower ltd Financials 10 714 792 0.57% 0.57%<br />
trade me ltd Consumer services 33 945 141 0.62% 0.62%<br />
vector ltd utilities 23 563 454 0.21% 0.21%<br />
Warehouse Group ltd/the Consumer services 13 395 8<strong>31</strong> 0.<strong>31</strong>% 0.<strong>31</strong>%<br />
PANAmA<br />
avianca taca <strong>Holding</strong> sa Consumer services 10 000 618 0.00% 0.11%<br />
PERU<br />
Cia de minas buenaventura sa basic m<strong>at</strong>erials 113 775 684 0.18% 0.18%<br />
Credicorp ltd Financials 1<strong>31</strong> 439 461 0.24% 0.24%<br />
volcan Cia minera saa basic m<strong>at</strong>erials 44 881 130 0.54% 0.22%<br />
PHiLiPPiNEs<br />
aboitiz equity ventures inc industrials 73 295 247 0.24% 0.24%<br />
aboitiz Power Corp utilities 82 981 639 0.28% 0.28%<br />
alliance <strong>Global</strong> Group inc industrials 115 332 542 0.80% 0.80%<br />
ayala Corp industrials 44 177 847 0.18% 0.18%<br />
ayala land inc Financials 45 <strong>31</strong>2 155 0.17% 0.17%<br />
bank <strong>of</strong> the Philippine islands Financials 48 508 693 0.18% 0.18%<br />
energy Development Corp utilities 341 035 751 2.12% 2.12%<br />
Filinvest land inc Financials 24 977 338 0.76% 0.76%<br />
First Gen Corp utilities 43 752 838 0.65% 0.65%<br />
First Philippine <strong>Holding</strong>s Corp utilities 48 782 919 1.07% 1.07%<br />
intern<strong>at</strong>ional Container terminal services inc industrials 27 266 107 0.19% 0.19%<br />
Jollibee Foods Corp Consumer services 29 321 212 0.23% 0.23%<br />
manila electric Co utilities 56 850 770 0.15% 0.15%<br />
manila W<strong>at</strong>er Co inc utilities 97 390 598 1.83% 1.83%<br />
megaworld Corp Financials 56 184 245 0.95% 0.95%<br />
metro Pacific investments Corp utilities 45 959 067 0.38% 0.38%<br />
Philex Petroleum Corp oil & Gas 1 432 829 0.09% 0.09%<br />
Philippine long Distance telephone Co telecommunic<strong>at</strong>ions 22 936 539 0.03% 0.03%<br />
Philippine n<strong>at</strong>ional bank Financials 22 015 621 0.43% 0.43%<br />
robinsons land Corp Financials 21 821 533 0.35% 0.35%<br />
san miguel Corp Consumer Goods 71 937 413 0.19% 0.19%<br />
semirara mining Corp basic m<strong>at</strong>erials 16 873 706 0.16% 0.16%<br />
sm investments Corp Consumer services 140 335 090 0.29% 0.29%<br />
sm Prime <strong>Holding</strong>s inc Financials 38 <strong>31</strong>9 659 0.15% 0.15%<br />
universal robina Corp Consumer Goods 82 485 460 0.61% 0.61%<br />
vista land & lifescapes inc Financials 19 634 225 0.60% 0.60%<br />
POLANd<br />
agora sa Consumer services 15 001 743 1.14% 1.53%<br />
amrest <strong>Holding</strong>s se Consumer services 17 759 209 0.75% 0.75%<br />
asseco Poland sa technology 103 048 508 1.58% 1.58%<br />
<strong>at</strong>rem sa technology 2 049 232 1.93% 2.90%<br />
bank Handlowy w Warszawie sa Financials 60 094 126 0.39% 0.39%<br />
bank millennium sa Financials 105 869 746 1.32% 1.32%<br />
bank Pekao sa Financials 322 812 360 0.50% 0.50%<br />
bioton sa Health Care 4 800 747 0.69% 0.69%<br />
bre bank sa Financials <strong>31</strong>5 369 439 1.75% 1.75%<br />
budimex sa industrials 86 309 070 2.54% 2.54%<br />
Cersanit sa industrials 29 977 166 1.56% 1.56%<br />
Ciech sa basic m<strong>at</strong>erials 19 119 423 1.20% 1.20%<br />
City interactive sa Consumer Goods 14 111 957 2.21% 2.21%<br />
Cognor sa basic m<strong>at</strong>erials 14 780 171 3.95% 3.95%<br />
Cyfrowy Pols<strong>at</strong> sa Consumer services 159 353 251 1.29% 1.95%<br />
enea sa utilities 35 367 397 0.26% 0.26%<br />
eurocash sa Consumer services 19 607 336 0.29% 0.29%<br />
Getin <strong>Holding</strong> sa Financials 67 589 633 0.75% 0.75%<br />
Globe trade Centre sa Financials 46 113 809 1.30% 1.30%<br />
Grupa lotos sa oil & Gas 110 998 492 2.11% 2.11%<br />
inG bank slaski sa Financials 26 559 325 0.15% 0.15%<br />
ipopema securities sa Financials 12 973 268 2.91% 2.91%<br />
izostal sa basic m<strong>at</strong>erials 10 703 539 2.86% 2.86%<br />
voting<br />
ownership<br />
sector<br />
market value<br />
(noK)<br />
Jastrzebska spolka Weglowa sa basic m<strong>at</strong>erials 386 060 726 2.22% 2.22%<br />
JW Construction <strong>Holding</strong> sa Consumer Goods 3 364 627 0.66% 0.66%<br />
Kernel <strong>Holding</strong> sa Consumer Goods 20 923 041 0.22% 0.22%<br />
KGHm Polska miedz sa basic m<strong>at</strong>erials 511 537 596 1.33% 1.33%<br />
lubelski Wegiel bogdanka sa basic m<strong>at</strong>erials 166 527 696 2.71% 2.71%<br />
mirbud sa industrials 6 193 967 2.40% 2.40%<br />
netia sa telecommunic<strong>at</strong>ions 133 746 086 3.71% 3.71%<br />
orbis sa Consumer services 80 556 206 2.65% 2.65%<br />
PbG sa industrials 19 233 594 0.84% 1.09%<br />
PGe sa utilities 451 520 164 0.67% 0.67%<br />
Pharmena sa Health Care 4 605 503 1.60% 1.60%<br />
Polimex-mostostal sa industrials 25 264 919 1.68% 1.68%<br />
Polnord sa industrials 25 251 532 4.49% 4.49%<br />
Polski Koncern naftowy orlen s.a. oil & Gas 161 078 832 0.64% 0.64%<br />
Polskie Gornictwo naftowe i<br />
Gazownictwo sa oil & Gas 99 768 774 0.24% 0.24%<br />
Powszechna Kasa oszczednosci bank<br />
Polski sa Financials 618 288 408 0.89% 0.89%<br />
Powszechny Zaklad ubezpieczen sa Financials 942 690 213 2.03% 2.03%<br />
PZ Cormay sa Health Care 12 250 013 1.37% 1.37%<br />
stalprodukt sa basic m<strong>at</strong>erials 43 387 124 0.61% 1.61%<br />
synthos sa basic m<strong>at</strong>erials 100 364 590 0.99% 0.99%<br />
telekomunikacja Polska sa telecommunic<strong>at</strong>ions 241 222 718 0.60% 0.60%<br />
tesgas sa industrials 3 811 271 2.08% 3.00%<br />
towarzystwo ubezpieczeniowe euroPa sa Financials 32 551 349 1.06% 1.06%<br />
tvn sa Consumer services 118 191 233 1.92% 1.92%<br />
Wawel sa Consumer Goods 35 245 342 2.76% 2.76%<br />
PORTUgAL<br />
altri sGPs sa basic m<strong>at</strong>erials 84 280 729 4.42% 4.42%<br />
banco bPi sa Financials 28 273 206 0.77% 0.77%<br />
banco Comercial Portugues sa Financials 141 368 078 1.86% 1.86%<br />
banco espirito santo sa Financials 80 117 835 0.52% 0.52%<br />
baniF sGPs sa Financials 8 032 337 0.53% 0.53%<br />
brisa auto-estradas de Portugal sa industrials 233 084 386 1.97% 1.97%<br />
Cimpor Cimentos de Portugal sGPs sa industrials 172 272 397 0.62% 0.62%<br />
eDP - energias de Portugal sa utilities 2 083 496 368 3.08% 3.08%<br />
eDP renovaveis sa utilities 335 148 091 1.05% 1.05%<br />
Galp energia sGPs sa oil & Gas 475 222 014 0.65% 0.65%<br />
ibersol sGPs sa Consumer services 27 903 297 4.44% 4.44%<br />
Jeronimo martins sGPs sa Consumer services 550 471 301 0.88% 0.88%<br />
martifer sGPs sa industrials 1 576 040 0.19% 0.19%<br />
mota-engil sGPs sa industrials 14 437 619 0.88% 0.88%<br />
Portucel empresa Produtora de Pasta e<br />
Papel sa basic m<strong>at</strong>erials 186 047 175 1.70% 1.70%<br />
Portugal telecom sGPs sa telecommunic<strong>at</strong>ions 1 529 023 <strong>31</strong>5 4.95% 4.95%<br />
ren - redes energeticas nacionais sa utilities 26 917 460 0.<strong>31</strong>% 0.<strong>31</strong>%<br />
semapa-sociedade de investimento e Gestao basic m<strong>at</strong>erials 258 590 584 5.25% 5.25%<br />
sonae Consumer services 277 051 840 3.90% 3.90%<br />
sonae industria sGPs sa industrials 7 050 358 1.02% 1.02%<br />
sonaecom - sGPs sa telecommunic<strong>at</strong>ions 29 128 168 0.84% 0.84%<br />
teixeira Duarte sa industrials 7 280 946 1.07% 1.07%<br />
Zon multimedia servicos de<br />
telecomunicacoes e multimedia sGPs sa Consumer services 124 066 235 2.23% 2.23%<br />
RUssiA<br />
acron JsC basic m<strong>at</strong>erials 30 922 468 0.26% 0.26%<br />
aer<strong>of</strong>lot - russian airlines oJsC Consumer services 95 378 227 0.92% 0.92%<br />
aK transneft oao oil & Gas 880 999 989 0.00% 1.35%<br />
ashinsky metallurgical Plant basic m<strong>at</strong>erials 10 201 960 1.39% 1.39%<br />
bank st Petersburg oJsC Financials 96 079 753 2.<strong>31</strong>% 1.84%<br />
bashkirenergo oJsC utilities 104 266 084 1.60% 1.53%<br />
bashneft oao oil & Gas 545 183 454 0.02% 1.33%<br />
Cherkizovo Group oJsC Consumer Goods 100 335 025 2.35% 2.35%<br />
DiXY Group oJsC Consumer services 172 025 628 2.52% 2.52%<br />
e.on russia JsC utilities 125 901 271 0.50% 0.50%<br />
enel oGK-5 oJsC utilities 35 206 708 0.29% 0.29%<br />
Federal Grid Co unified energy system JsC utilities 381 751 169 0.58% 0.58%<br />
Federal Hydrogener<strong>at</strong>ing Co JsC utilities <strong>31</strong>6 483 644 0.61% 0.61%<br />
Gaiskiy GoK basic m<strong>at</strong>erials 4 543 102 0.42% 0.42%<br />
GaZ auto Plant Consumer Goods 73 251 565 2.15% 2.66%<br />
Gazprom neft JsC oil & Gas 481 048 726 0.37% 0.37%<br />
Gazprom oao oil & Gas 6 178 396 837 0.65% 0.82%<br />
<strong>Global</strong> Ports investments PlC industrials 30 533 906 0.00% 0.93%<br />
Hydraulic machines and systems Group PlC industrials 48 500 262 1.57% 1.57%<br />
iDGC <strong>Holding</strong> JsC utilities 186 503 165 1.02% 0.97%<br />
iDGC <strong>of</strong> south JsC utilities 17 459 085 2.84% 2.84%<br />
integra Group <strong>Holding</strong>s oil & Gas 87 299 560 4.59% 4.59%<br />
inter-regional Distribution network Co<br />
Center and Privolzhya oJsC utilities 2 998 215 0.10% 0.10%<br />
inter-regional Distribution network Co<br />
volga oao utilities 5 426 097 0.18% 0.18%<br />
irkutskenergo oJsC utilities 66 259 078 0.50% 0.50%<br />
Kuzbasskaya toplivnaya Kompaniya oao basic m<strong>at</strong>erials 29 871 573 1.07% 1.07%<br />
lenenergo utilities 2 684 275 0.00% 0.06%<br />
lsr Group industrials 106 423 081 0.27% 1.06%<br />
lukoil oao oil & Gas 3 862 030 632 1.43% 1.43%<br />
m video oJsC Consumer services 26 851 799 0.44% 0.44%<br />
magnit oJsC Consumer services 512 869 823 0.83% 0.95%<br />
mail.ru Group ltd technology 162 545 032 0.50% 0.50%<br />
mechel basic m<strong>at</strong>erials 259 852 015 0.87% 2.28%<br />
mosenergo oao utilities 20 921 544 0.17% 0.17%<br />
mostotrest industrials 29 903 555 0.<strong>31</strong>% 0.<strong>31</strong>%<br />
Country associ<strong>at</strong>ion according to Ftse (the benchmark provider for <strong>equities</strong>). if a company is not in the benchmark, the country <strong>of</strong> incorpor<strong>at</strong>ion is listed. sector classific<strong>at</strong>ion according to iCb (the industry Classific<strong>at</strong>ion<br />
benchmark company).<br />
voting<br />
ownership<br />
HOLdiNgs<br />
26<br />
<strong>Government</strong> <strong>Pension</strong> FunD <strong>Global</strong> ANNUAL REPORT 2011
<strong>Government</strong> <strong>Pension</strong> <strong>Fund</strong> <strong>Global</strong> <strong>Holding</strong> <strong>of</strong> <strong>equities</strong> <strong>at</strong> <strong>31</strong> December 2011<br />
sector<br />
market value<br />
(noK)<br />
nov<strong>at</strong>ek oao oil & Gas 1 330 128 499 0.22% 0.59%<br />
novoil oao oil & Gas 1 384 564 0.00% 0.05%<br />
novolipetsk steel oJsC basic m<strong>at</strong>erials 574 230 889 0.82% 0.82%<br />
oGK-1 oao utilities 62 603 767 0.78% 0.78%<br />
oGK-6 oao utilities 3 070 667 0.07% 0.07%<br />
orsknefteorgsintez oil & Gas 9 489 041 0.00% 2.52%<br />
Pharmstandard oJsC Health Care 1<strong>31</strong> 307 714 0.07% 1.04%<br />
Phosagro oao basic m<strong>at</strong>erials 35 848 475 0.00% 0.19%<br />
Protek Health Care 24 400 812 1.38% 1.38%<br />
raspadskaya oao basic m<strong>at</strong>erials 106 898 076 0.74% 0.74%<br />
rosneft oil Co oil & Gas 1 494 867 467 0.35% 0.36%<br />
rostelecom oJsC telecommunic<strong>at</strong>ions 130 895 663 0.12% 0.16%<br />
sar<strong>at</strong>ovskiy neftepererab<strong>at</strong>yvayuschiy<br />
Zavod oao oil & Gas 2 237 981 0.33% 0.25%<br />
sberbank <strong>of</strong> russia Financials 2 216 695 584 0.65% 0.67%<br />
severstal oao basic m<strong>at</strong>erials 298 447 102 0.44% 0.44%<br />
sistema JsFC telecommunic<strong>at</strong>ions 528 575 864 0.87% 0.87%<br />
sollers oJsC Consumer Goods 10 370 885 0.54% 0.54%<br />
surgutneftegas oJsC oil & Gas 1 568 913 065 0.83% 1.57%<br />
synergy Co Consumer Goods 13 709 995 0.64% 0.64%<br />
t<strong>at</strong>neft oil & Gas 260 894 790 0.41% 0.38%<br />
tGK-1 oao utilities <strong>31</strong> 013 708 0.47% 0.47%<br />
tGK-5 utilities 5 856 784 0.40% 0.40%<br />
tGK-6 JsC utilities 3 696 521 0.16% 0.16%<br />
tGK-9 oao utilities 16 944 790 0.43% 0.43%<br />
tmK oao basic m<strong>at</strong>erials 2 708 996 0.02% 0.02%<br />
tnK-bP <strong>Holding</strong> oil & Gas 141 444 683 0.01% 0.07%<br />
transContainer oao industrials 6 017 444 0.09% 0.09%<br />
ufa oil refinery oil & Gas 6 260 928 0.00% 0.22%<br />
ufaneftekhim oao oil & Gas 42 600 510 0.00% 0.98%<br />
ufaorgsintez oao basic m<strong>at</strong>erials 2 983 975 0.10% 0.22%<br />
uralkali oJsC basic m<strong>at</strong>erials 236 254 198 0.18% 0.15%<br />
vtb bank oJsC Financials 498 021 979 0.44% 0.44%<br />
X5 retail Group nv Consumer services 355 912 126 3.85% 0.96%<br />
siNgAPORE<br />
aims amP Capital industrial reit Financials 5 617 748 0.29% 0.29%<br />
ara asset management ltd Financials 4 992 603 0.12% 0.12%<br />
ascendas india trust Financials 11 147 016 0.46% 0.46%<br />
ascendas real est<strong>at</strong>e investment trust Financials 113 917 578 0.65% 0.65%<br />
ascott residence trust Financials 20 538 769 0.40% 0.40%<br />
biosensors intern<strong>at</strong>ional Group ltd Health Care 490 685 894 4.34% 4.34%<br />
Cache logistics trust Financials 12 256 010 0.44% 0.44%<br />
Cambridge industrial trust Financials 14 458 557 0.56% 0.56%<br />
CapitaCommercial trust Financials 72 371 216 0.53% 0.53%<br />
Capitaland ltd Financials 208 638 930 0.48% 0.48%<br />
Capitamall trust Financials 125 694 351 0.48% 0.48%<br />
Capitamalls asia ltd Financials 52 201 716 0.26% 0.26%<br />
Capitaretail China trust Financials 10 924 711 0.30% 0.30%<br />
CDl Hospitality trusts Financials 34 762 852 0.51% 0.51%<br />
CH <strong>of</strong>fshore ltd oil & Gas 3 943 500 0.35% 0.35%<br />
China energy ltd oil & Gas 1 005 721 0.<strong>31</strong>% 0.<strong>31</strong>%<br />
China Fishery Group ltd Consumer Goods 7 283 802 0.17% 0.17%<br />
China XlX Fertiliser ltd basic m<strong>at</strong>erials 3 565 720 0.24% 0.24%<br />
City Developments ltd Financials 180 686 430 0.49% 0.49%<br />
Cityspring infrastructure trust Financials 10 161 913 0.43% 0.43%<br />
ComfortDelGro Corp ltd Consumer services 88 089 652 0.65% 0.65%<br />
Cosco Corp singapore ltd industrials 24 385 104 0.27% 0.27%<br />
Cse <strong>Global</strong> ltd technology 8 978 505 0.50% 0.50%<br />
Dbs Group <strong>Holding</strong>s ltd Financials 915 598 037 0.74% 0.74%<br />
ezion <strong>Holding</strong>s ltd oil & Gas 13 356 812 0.62% 0.62%<br />
ezra <strong>Holding</strong>s ltd oil & Gas 18 <strong>31</strong>7 945 0.55% 0.55%<br />
First resources ltd Consumer Goods 17 993 324 0.18% 0.18%<br />
First ship lease trust industrials 2 412 287 0.28% 0.28%<br />
Fortune real est<strong>at</strong>e investment trust Financials 23 034 246 0.47% 0.47%<br />
Fraser and neave ltd industrials 259 670 639 0.64% 0.64%<br />
Frasers Centrepoint trust Financials 14 123 696 0.26% 0.26%<br />
Frasers Commercial trust Financials 13 127 656 0.61% 0.61%<br />
Gallant venture ltd utilities 7 577 706 0.28% 0.28%<br />
Genting singapore PlC Consumer services 273 235 824 0.32% 0.32%<br />
<strong>Global</strong> logistic Properties ltd Financials 299 948 450 0.81% 0.81%<br />
GmG <strong>Global</strong> ltd Consumer Goods 19 338 100 0.49% 0.49%<br />
Golden agri-resources ltd Consumer Goods 264 152 675 0.66% 0.66%<br />
Goodpack ltd industrials 13 135 059 0.42% 0.42%<br />
Guocoland ltd Financials 12 885 278 0.13% 0.13%<br />
Guocoleisure ltd Consumer services 12 211 158 0.33% 0.33%<br />
Hi-P intern<strong>at</strong>ional ltd industrials 3 522 478 0.14% 0.14%<br />
Ho bee investment ltd Financials 8 760 687 0.26% 0.26%<br />
Hong leong asia ltd industrials 4 746 813 0.18% 0.18%<br />
Hotel Properties ltd Consumer services 9 189 349 0.23% 0.23%<br />
Hyflux ltd utilities 59 390 653 1.25% 1.25%<br />
ind<strong>of</strong>ood agri resources ltd Consumer Goods 14 188 891 0.17% 0.17%<br />
Jardine Cycle & Carriage ltd Consumer services 198 701 359 0.25% 0.25%<br />
Jaya <strong>Holding</strong>s ltd industrials 105 998 0.01% 0.01%<br />
Jurong technologies industrial Corp ltd industrials 1 084 0.39% 0.39%<br />
K1 ventures ltd Financials 1 294 598 0.17% 0.17%<br />
Keppel Corp ltd oil & Gas 369 841 413 0.48% 0.48%<br />
Keppel land ltd Financials 53 244 382 0.35% 0.35%<br />
Keppel telecommunic<strong>at</strong>ions &<br />
transport<strong>at</strong>ion ltd industrials 5 864 990 0.21% 0.21%<br />
K-reit asia Financials 21 845 032 0.23% 0.23%<br />
lionGold Corp ltd technology 14 119 001 0.48% 0.48%<br />
voting<br />
ownership<br />
sector<br />
market value<br />
(noK)<br />
lippo malls indonesia retail trust Financials 18 650 359 0.53% 0.53%<br />
m1 ltd/singapore telecommunic<strong>at</strong>ions 23 959 940 0.23% 0.23%<br />
mapletree logistics trust Financials 46 343 261 0.49% 0.49%<br />
midas <strong>Holding</strong>s ltd basic m<strong>at</strong>erials 7 662 624 0.41% 0.41%<br />
neptune orient lines ltd/singapore industrials 35 686 709 0.27% 0.27%<br />
noble Group ltd industrials 161 484 960 0.49% 0.49%<br />
oceanus Group ltd Consumer Goods 1 993 971 0.32% 0.32%<br />
olam intern<strong>at</strong>ional ltd Consumer Goods 118 727 365 0.50% 0.50%<br />
osim intern<strong>at</strong>ional ltd Consumer Goods 14 379 761 0.35% 0.35%<br />
oversea-Chinese banking Corp ltd Financials 217 128 642 0.18% 0.18%<br />
Pacific andes resources Development ltd Consumer Goods 7 003 036 0.25% 0.25%<br />
Parkway life real est<strong>at</strong>e investment trust Financials 20 835 517 0.42% 0.42%<br />
People’s Food <strong>Holding</strong>s ltd Consumer Goods 13 061 694 0.39% 0.39%<br />
raffles educ<strong>at</strong>ion Corp ltd Consumer services 9 603 399 0.56% 0.56%<br />
raffles medical Group ltd Health Care 12 169 214 0.23% 0.23%<br />
sakari resources ltd basic m<strong>at</strong>erials 32 242 293 0.34% 0.34%<br />
s<strong>at</strong>s ltd industrials 53 455 876 0.49% 0.49%<br />
sembCorp industries ltd oil & Gas 185 574 979 0.56% 0.56%<br />
sembCorp marine ltd oil & Gas 27 269 525 0.07% 0.07%<br />
sia engineering Co ltd industrials 21 675 397 0.13% 0.13%<br />
singapore airlines ltd Consumer services 179 500 000 0.33% 0.33%<br />
singapore exchange ltd Financials 207 682 405 0.69% 0.69%<br />
singapore Post ltd industrials 40 112 204 0.49% 0.49%<br />
singapore Press <strong>Holding</strong>s ltd Consumer services 11 654 596 0.04% 0.04%<br />
singapore telecommunic<strong>at</strong>ions ltd telecommunic<strong>at</strong>ions 49 967 401 0.02% 0.02%<br />
smrt Corp ltd Consumer services 34 680 019 0.28% 0.28%<br />
sound <strong>Global</strong> ltd industrials 184 391 <strong>31</strong>4 6.21% 6.21%<br />
starhill <strong>Global</strong> reit Financials 5 395 963 0.11% 0.11%<br />
starHub ltd telecommunic<strong>at</strong>ions 8 467 142 0.04% 0.04%<br />
st<strong>at</strong>s ChipPaC ltd technology 3 046 685 0.07% 0.07%<br />
suntec real est<strong>at</strong>e investment trust Financials 73 722 006 0.67% 0.67%<br />
super Group ltd/singapore Consumer Goods 16 492 811 0.49% 0.49%<br />
swiber <strong>Holding</strong>s ltd oil & Gas 4 392 897 0.35% 0.35%<br />
synear Food <strong>Holding</strong>s ltd Consumer Goods 4 104 485 0.50% 0.50%<br />
t<strong>at</strong> Hong <strong>Holding</strong>s ltd industrials 7 278 354 0.36% 0.36%<br />
tiger airways <strong>Holding</strong>s ltd Consumer services 8 2<strong>31</strong> 6<strong>31</strong> 0.34% 0.34%<br />
united engineers ltd industrials 4 733 121 0.19% 0.19%<br />
united overseas bank ltd Financials 308 564 060 0.28% 0.28%<br />
uob-Kay Hian <strong>Holding</strong>s ltd Financials 240 209 0.00% 0.00%<br />
uol Group ltd Financials 68 862 130 0.49% 0.49%<br />
venture Corp ltd industrials 50 598 811 0.65% 0.65%<br />
Wheelock Properties singapore ltd Financials 15 247 122 0.18% 0.18%<br />
Wilmar intern<strong>at</strong>ional ltd Consumer Goods 382 084 116 0.26% 0.26%<br />
Wing tai <strong>Holding</strong>s ltd Financials 15 882 456 0.46% 0.46%<br />
Yangzijiang shipbuilding <strong>Holding</strong>s ltd industrials 52 915 716 0.33% 0.33%<br />
Yanlord land Group ltd Financials 19 977 432 0.23% 0.23%<br />
Ying li intern<strong>at</strong>ional real est<strong>at</strong>e ltd Financials 4 518 594 0.18% 0.18%<br />
sOUTH AFRiCA<br />
absa Group ltd Financials 206 741 511 0.28% 0.28%<br />
adcock ingram <strong>Holding</strong>s ltd Health Care 5 693 921 0.07% 0.07%<br />
aeci ltd basic m<strong>at</strong>erials 36 982 451 0.51% 0.51%<br />
african bank investments ltd Financials 90 132 9<strong>31</strong> 0.44% 0.44%<br />
african rainbow minerals ltd basic m<strong>at</strong>erials 30 179 865 0.11% 0.11%<br />
allied electronics Corp ltd industrials 59 329 732 0.00% 1.02%<br />
anglo american Pl<strong>at</strong>inum ltd basic m<strong>at</strong>erials 169 543 651 0.16% 0.16%<br />
angloGold ashanti ltd basic m<strong>at</strong>erials 1 344 267 225 1.37% 1.37%<br />
arcelormittal south africa ltd basic m<strong>at</strong>erials 44 173 297 0.20% 0.20%<br />
aspen Pharmacare <strong>Holding</strong>s ltd Health Care 276 966 512 0.89% 0.89%<br />
aveng ltd industrials 102 891 608 1.05% 1.05%<br />
avi ltd Consumer Goods 142 503 067 1.42% 1.42%<br />
bell equipment ltd industrials 10 234 292 0.92% 0.92%<br />
bidvest Group ltd industrials 142 725 601 0.38% 0.38%<br />
Cadiz <strong>Holding</strong>s ltd Financials 12 191 504 2.58% 2.58%<br />
Clientele ltd Financials 59 869 353 2.17% 2.17%<br />
Coron<strong>at</strong>ion <strong>Fund</strong> managers ltd Financials 37 463 253 0.71% 0.71%<br />
Discovery <strong>Holding</strong>s ltd Financials 34 075 491 0.18% 0.18%<br />
eqstra <strong>Holding</strong>s ltd industrials 16 796 746 0.71% 0.71%<br />
Firstrand ltd Financials 116 139 954 0.13% 0.13%<br />
Foschini Group ltd/the Consumer services 106 882 450 0.57% 0.57%<br />
Gold Fields ltd basic m<strong>at</strong>erials 143 892 854 0.22% 0.22%<br />
Hudaco industries ltd industrials 57 187 125 2.71% 2.71%<br />
impala Pl<strong>at</strong>inum <strong>Holding</strong>s ltd basic m<strong>at</strong>erials 194 616 413 0.25% 0.25%<br />
imperial <strong>Holding</strong>s ltd industrials 183 339 588 0.86% 0.86%<br />
italtile ltd Consumer services 48 <strong>31</strong>0 372 1.26% 1.26%<br />
Kumba iron ore ltd basic m<strong>at</strong>erials 154 755 403 0.13% 0.13%<br />
lewis Group ltd Consumer services 33 159 217 0.57% 0.57%<br />
mediclinic intern<strong>at</strong>ional ltd Health Care 94 033 158 0.58% 0.58%<br />
mobile industries ltd industrials 32 133 0.41% 0.41%<br />
mr Price Group ltd Consumer services 40 549 091 0.15% 0.26%<br />
mtn Group ltd telecommunic<strong>at</strong>ions 1 175 394 637 0.59% 0.59%<br />
mustek ltd technology 13 437 919 2.96% 2.96%<br />
nampak ltd industrials 79 713 102 0.68% 0.68%<br />
naspers ltd Consumer services 920 692 464 0.32% 0.87%<br />
nedbank Group ltd Financials 62 037 134 0.11% 0.11%<br />
netcare ltd Health Care 107 605 233 0.75% 0.75%<br />
nu-World <strong>Holding</strong>s ltd Consumer Goods 7 998 638 2.96% 2.96%<br />
oceana Group ltd Consumer Goods 35 853 011 0.85% 0.85%<br />
omnia <strong>Holding</strong>s ltd basic m<strong>at</strong>erials 51 038 105 1.18% 1.18%<br />
Peregrine <strong>Holding</strong>s ltd Financials 30 502 260 1.86% 1.86%<br />
Pick n Pay stores ltd Consumer services 34 207 364 0.21% 0.21%<br />
remgro ltd industrials 164 298 514 0.22% 0.36%<br />
Country associ<strong>at</strong>ion according to Ftse (the benchmark provider for <strong>equities</strong>). if a company is not in the benchmark, the country <strong>of</strong> incorpor<strong>at</strong>ion is listed. sector classific<strong>at</strong>ion according to iCb (the industry Classific<strong>at</strong>ion<br />
benchmark company).<br />
voting<br />
ownership<br />
HOLdiNgs<br />
27<br />
<strong>Government</strong> <strong>Pension</strong> FunD <strong>Global</strong> ANNUAL REPORT 2011
<strong>Government</strong> <strong>Pension</strong> <strong>Fund</strong> <strong>Global</strong> <strong>Holding</strong> <strong>of</strong> <strong>equities</strong> <strong>at</strong> <strong>31</strong> December 2011<br />
sector<br />
market value<br />
(noK)<br />
reunert ltd industrials 101 416 892 1.09% 1.09%<br />
royal bafokeng Pl<strong>at</strong>inum ltd basic m<strong>at</strong>erials 17 144 902 0.26% 0.26%<br />
sanlam ltd Financials 22 443 619 0.05% 0.05%<br />
sasol ltd oil & Gas 816 735 717 0.44% 0.44%<br />
sentula mining ltd basic m<strong>at</strong>erials 19 657 277 2.32% 2.32%<br />
sovereign Food investments Consumer Goods 9 622 803 2.93% 2.93%<br />
standard bank Group ltd/south africa Financials 505 964 087 0.44% 0.44%<br />
steinh<strong>of</strong>f intern<strong>at</strong>ional <strong>Holding</strong>s ltd Consumer Goods 138 176 458 0.47% 0.47%<br />
tiger Wheels ltd Consumer Goods 0 0.00% 0.00%<br />
trencor ltd industrials 201 628 006 4.05% 4.05%<br />
vodacom Group ltd telecommunic<strong>at</strong>ions 108 980 840 0.11% 0.11%<br />
Wilson bayly Holmes-ovcon ltd industrials 55 349 610 1.08% 1.08%<br />
Woolworths <strong>Holding</strong>s ltd/south africa Consumer services 47 568 259 0.20% 0.20%<br />
Zurich insurance Co south africa ltd Financials 57 841 865 2.92% 2.92%<br />
sOUTH kOREA<br />
amorepacific Corp Consumer Goods 369 737 483 1.16% 1.16%<br />
asiana airlines inc Consumer services 154 623 620 2.53% 2.53%<br />
binggrae Co ltd Consumer Goods 66 333 373 2.18% 2.18%<br />
Cheil industries inc basic m<strong>at</strong>erials 627 616 457 2.29% 2.29%<br />
Cheil Worldwide inc Consumer services 348 116 953 3.08% 3.08%<br />
CJ CGv Co ltd Consumer services 96 306 967 3.38% 3.38%<br />
CJ Corp Consumer Goods 562 015 399 4.86% 4.86%<br />
CJ e&m Corp Consumer Goods 80 862 376 1.36% 1.36%<br />
CJ o shopping Co ltd Consumer services 338 683 369 4.08% 4.09%<br />
Daekyo Co ltd Consumer services 55 344 083 2.02% 2.02%<br />
Danal Co ltd technology 20 129 916 2.79% 2.79%<br />
Daum Communic<strong>at</strong>ions Corp technology 397 883 227 4.76% 4.76%<br />
Doosan Heavy industries &<br />
Construction Co ltd oil & Gas 369 133 397 1.03% 1.03%<br />
Duzonbizon Co ltd technology 25 337 885 2.46% 2.46%<br />
e-mart Co ltd Consumer services 167 555 138 0.42% 0.42%<br />
Forhuman Co ltd technology 0 0.02% 0.02%<br />
<strong>Global</strong> & Yuasa b<strong>at</strong>tery Co ltd Consumer Goods 26 798 349 0.84% 0.84%<br />
Gs <strong>Holding</strong>s oil & Gas 241 665 023 0.99% 0.99%<br />
Hana Financial Group inc Financials 554 273 <strong>31</strong>0 1.24% 1.24%<br />
Hana tour service inc Consumer services 93 522 635 4.54% 4.54%<br />
Hanmi <strong>Holding</strong>s Co ltd Health Care 2 828 083 0.26% 0.26%<br />
Hanmi Pharm Co ltd Health Care 50 414 821 1.88% 1.88%<br />
Hite Jinro Co ltd Consumer Goods 89 196 973 0.99% 0.99%<br />
Honam Petrochemical Corp basic m<strong>at</strong>erials 658 640 596 1.34% 1.34%<br />
Hotel shilla Co ltd Consumer services 365 336 037 4.67% 4.67%<br />
Huchems Fine Chemical Corp basic m<strong>at</strong>erials 159 441 990 3.77% 3.77%<br />
Hwa shin Co ltd Consumer Goods 108 605 021 4.78% 4.78%<br />
Hynix semiconductor inc technology 712 755 268 1.06% 1.06%<br />
Hyundai Glovis Co ltd industrials 965 658 075 2.59% 2.59%<br />
Hyundai Heavy industries Co ltd industrials 160 086 529 0.16% 0.16%<br />
Hyundai Home shopping network Corp Consumer services 360 514 540 4.36% 4.36%<br />
Hyundai Hysco Co ltd basic m<strong>at</strong>erials 340 397 471 2.33% 2.33%<br />
Hyundai mobis Consumer Goods 758 637 453 0.52% 0.52%<br />
Hyundai motor Co Consumer Goods 1 379 889 090 0.52% 1.46%<br />
Hyundai steel Co basic m<strong>at</strong>erials 571 990 506 1.35% 1.35%<br />
Jeonbuk bank Financials 261 142 0.02% 0.02%<br />
Kb Financial Group inc Financials 665 916 604 0.92% 0.92%<br />
KCC Corp industrials 41 475 134 0.27% 0.27%<br />
KePCo Plant service & engineering Co ltd industrials 140 847 356 1.47% 1.47%<br />
Kia motors Corp Consumer Goods 817 126 461 0.59% 0.59%<br />
Kolon industries inc basic m<strong>at</strong>erials 397 585 533 4.84% 4.84%<br />
Korea electric Power Corp utilities 247 379 840 0.29% 0.29%<br />
Korea electric terminal Co ltd industrials 13 263 396 1.12% 1.12%<br />
Korea investment <strong>Holding</strong>s Co ltd Financials 48 526 021 0.46% 0.46%<br />
Korea Kumho Petrochemical basic m<strong>at</strong>erials 424 <strong>31</strong>4 122 1.92% 1.92%<br />
Korea Petrochemical ind Co ltd basic m<strong>at</strong>erials 121 469 947 4.03% 4.03%<br />
Korea Zinc Co ltd basic m<strong>at</strong>erials 394 802 438 1.33% 1.33%<br />
Korean reinsurance Co Financials 83 412 436 0.93% 0.93%<br />
Kt Corp telecommunic<strong>at</strong>ions 126 811 916 0.26% 0.26%<br />
lG Chem ltd basic m<strong>at</strong>erials 289 954 470 0.18% 2.45%<br />
lG Corp industrials 80 776 019 0.15% 0.15%<br />
lG electronics inc Consumer Goods 210 773 223 0.33% 0.33%<br />
lG Household & Health Care ltd Consumer Goods 659 567 071 1.67% 1.67%<br />
lG innotek Co ltd industrials 384 202 829 5.43% 5.43%<br />
lG intern<strong>at</strong>ional Corp industrials 389 757 499 4.12% 4.12%<br />
lG uplus Corp telecommunic<strong>at</strong>ions 67 150 925 0.34% 0.34%<br />
liG insurance Co ltd Financials 79 322 070 1.11% 1.11%<br />
lotte Chilsung beverage Co ltd Consumer Goods 206 448 227 2.20% 2.20%<br />
lotte Confectionery Co ltd Consumer Goods 122 433 194 0.97% 0.97%<br />
lotte midopa Co ltd Consumer services 103 990 700 1.93% 1.93%<br />
lotte shopping Co ltd Consumer services 356 969 811 0.70% 0.70%<br />
ls Corp industrials 33 703 127 0.27% 0.27%<br />
ls industrial systems Co ltd industrials 30 638 813 0.30% 0.30%<br />
nCs<strong>of</strong>t Corp Consumer Goods 507 457 <strong>31</strong>4 1.46% 1.46%<br />
neosemitech Corp technology 0 0.01% 0.01%<br />
neowiz Games Corp Consumer Goods 232 651 579 4.74% 4.74%<br />
nHn Corp technology 100 967 451 0.19% 0.19%<br />
oCi Co ltd basic m<strong>at</strong>erials 360 453 024 1.33% 1.33%<br />
oCi m<strong>at</strong>erials Co ltd basic m<strong>at</strong>erials 207 924 070 4.79% 4.79%<br />
orion Corp/republic <strong>of</strong> south Korea Consumer Goods 660 072 397 3.15% 3.15%<br />
Paradise Co ltd Consumer services 112 584 550 2.84% 2.84%<br />
PosCo basic m<strong>at</strong>erials 1 357 200 <strong>31</strong>3 0.79% 0.79%<br />
samsung C&t Corp industrials 75 287 058 0.14% 0.14%<br />
samsung electronics Co ltd technology 3 402 719 600 0.42% 0.42%<br />
samsung engineering Co ltd industrials 67 860 109 0.16% 0.16%<br />
voting<br />
ownership<br />
sector<br />
market value<br />
(noK)<br />
samsung Fire & marine insurance Co ltd Financials 282 965 521 0.55% 0.55%<br />
samsung life insurance Co ltd Financials 147 726 416 0.18% 0.18%<br />
samsung sDi Co ltd industrials 171 956 945 0.55% 0.55%<br />
samsung techwin Co ltd industrials 136 407 898 0.93% 0.93%<br />
sbs media <strong>Holding</strong>s Co ltd Consumer services 17 225 375 0.54% 0.54%<br />
seoul semiconductor Co ltd technology <strong>31</strong>6 324 895 4.99% 4.99%<br />
shinhan Financial Group Co ltd Financials 606 455 534 0.62% 0.62%<br />
shinsegae Co ltd Consumer services 51 412 516 0.41% 0.41%<br />
sK C&C Co ltd technology 912 865 092 3.01% 3.01%<br />
sK innov<strong>at</strong>ion Co ltd oil & Gas 224 578 372 0.33% 0.33%<br />
sK telecom Co ltd telecommunic<strong>at</strong>ions 136 249 138 0.23% 0.23%<br />
sKC Co ltd basic m<strong>at</strong>erials 93 535 230 1.<strong>31</strong>% 1.<strong>31</strong>%<br />
soulbrain Co ltd basic m<strong>at</strong>erials 130 902 501 4.46% 4.46%<br />
stX engine Co ltd industrials 94 707 730 4.70% 4.70%<br />
sungwoo Hitech Co ltd Consumer Goods 215 419 323 6.00% 6.00%<br />
Woongjin Coway Co ltd Consumer Goods 358 095 849 2.45% 2.45%<br />
Woori Finance <strong>Holding</strong>s Co ltd Financials 54 530 422 0.14% 0.14%<br />
sPAiN<br />
abengoa sa oil & Gas 115 912 721 1.01% 1.01%<br />
abertis infraestructuras sa industrials 626 042 182 0.84% 0.84%<br />
acciona sa industrials 237 075 806 0.72% 0.72%<br />
acerinox sa basic m<strong>at</strong>erials 382 720 808 2.00% 2.00%<br />
aCs actividades de Construccion y<br />
servicios sa industrials 701 542 607 1.26% 1.26%<br />
almirall sa Health Care 160 448 467 2.35% 2.35%<br />
amadeus it <strong>Holding</strong> sa industrials 741 881 226 1.71% 1.71%<br />
antena 3 de television sa Consumer services 95 785 611 1.26% 1.26%<br />
azkoyen sa industrials 7 425 597 3.37% 3.37%<br />
banco bilbao vizcaya argentaria sa Financials 5 016 275 346 1.98% 1.98%<br />
banco de sabadell sa Financials 688 807 272 2.18% 2.18%<br />
banco de valencia sa Financials 33 249 454 1.42% 1.42%<br />
banco espanol de Credito sa Financials 52 960 279 0.27% 0.27%<br />
banco Pastor sa Financials 52 474 129 0.75% 0.75%<br />
banco Popular espanol sa Financials 563 249 809 1.48% 1.48%<br />
banco santander sa Financials 7 995 685 800 2.05% 2.05%<br />
bankinter sa Financials 283 845 620 1.62% 1.62%<br />
baron de ley Consumer Goods 4 888 628 0.28% 0.28%<br />
bolsas y mercados espanoles sa Financials 243 099 001 1.80% 1.80%<br />
Caixabank Financials 561 347 948 0.50% 0.50%<br />
Caja de ahorros del mediterraneo Financials 272 085 0.05% 0.05%<br />
Cementos Portland valderrivas sa industrials 7 446 891 0.37% 0.37%<br />
Codere sa/spain Consumer services 210 064 0.01% 0.01%<br />
Construcciones y auxiliar de Ferrocarriles sa industrials 257 014 009 2.51% 2.51%<br />
Corp Financiera alba Financials 329 957 881 2.42% 2.42%<br />
Deoleo sa Consumer Goods 48 213 278 1.41% 1.41%<br />
Dinamia Capital Privado sociedad de<br />
Capital riesgo sa Financials 6 739 070 1.35% 1.35%<br />
Distribuidora internacional de<br />
alimentacion sa Consumer services 404 502 250 2.20% 2.20%<br />
Duro Felguera sa industrials 45 832 446 0.73% 0.73%<br />
ebro Foods sa Consumer Goods 211 383 065 1.24% 1.24%<br />
elecnor sa utilities 9 861 292 0.15% 0.15%<br />
enagas sa utilities 427 430 429 1.62% 1.62%<br />
endesa sa utilities 91 575 557 0.07% 0.07%<br />
Faes Farma sa Health Care 34 564 504 1.82% 1.82%<br />
Ferrovial sa industrials 1 <strong>31</strong>8 058 374 2.49% 2.49%<br />
Fersa energias renovables sa utilities 478 737 0.06% 0.06%<br />
Fomento de Construcciones y Contr<strong>at</strong>as sa industrials 174 604 839 0.88% 0.88%<br />
Gamesa Corp tecnologica sa oil & Gas 20 063 886 0.33% 0.33%<br />
Gas n<strong>at</strong>ural sDG sa utilities 519 430 174 0.51% 0.51%<br />
Grifols sa Health Care 488 382 945 1.42% 1.51%<br />
Grupo C<strong>at</strong>alana occidente sa Financials 121 678 567 1.07% 1.07%<br />
Grupo empresarial ence sa basic m<strong>at</strong>erials 63 940 665 1.83% 1.83%<br />
Grupo tavex sa Consumer Goods 3 276 152 1.18% 1.18%<br />
iberdrola sa utilities 2 649 718 927 1.20% 1.20%<br />
iberpapel Gestion sa basic m<strong>at</strong>erials 32 137 562 2.82% 2.82%<br />
inditex sa Consumer services 3 140 563 608 1.03% 1.03%<br />
indra sistemas sa technology 338 351 808 2.70% 2.70%<br />
la seda de barcelona sa basic m<strong>at</strong>erials 8 699 882 0.61% 0.61%<br />
labor<strong>at</strong>orios Farmaceuticos rovi sa Health Care 53 889 857 2.73% 2.73%<br />
mapfre sa Financials 110 271 918 0.19% 0.19%<br />
mediaset espana Comunicacion sa Consumer services 69 609 919 0.50% 0.50%<br />
melia Hotels intern<strong>at</strong>ional sa Consumer services 67 262 536 1.21% 1.21%<br />
miquel y Costas & miquel sa basic m<strong>at</strong>erials 77 857 866 4.<strong>31</strong>% 4.<strong>31</strong>%<br />
n<strong>at</strong>raceutical sa Consumer Goods 1 350 400 0.34% 0.34%<br />
nH Hoteles sa Consumer services 93 500 988 2.24% 2.24%<br />
obrascon Huarte lain sa industrials 258 129 599 1.72% 1.72%<br />
Papeles y Cartones de europa sa basic m<strong>at</strong>erials <strong>31</strong> 782 761 1.90% 1.90%<br />
Pescanova sa Consumer Goods 86 882 080 2.24% 2.24%<br />
Promotora de informaciones sa Consumer services 54 088 371 1.75% 0.94%<br />
Prosegur Cia de seguridad sa industrials 198 161 729 1.23% 1.23%<br />
Quabit inmobiliaria sa Financials 6 115 729 0.76% 0.76%<br />
realia business sa Financials 4 388 743 0.19% 0.19%<br />
red electrica Corp sa utilities 297 724 892 0.86% 0.86%<br />
repsol YPF sa oil & Gas 4 449 213 276 1.98% 1.98%<br />
sacyr vallehermoso sa industrials 126 135 711 0.97% 0.97%<br />
solaria energia y medio ambiente sa oil & Gas 125 465 0.02% 0.02%<br />
tecnicas reunidas sa industrials 264 113 912 2.20% 2.20%<br />
telefonica sa telecommunic<strong>at</strong>ions 8 894 095 917 1.88% 1.88%<br />
tubacex sa basic m<strong>at</strong>erials 46 840 848 2.44% 2.44%<br />
tubos reunidos sa basic m<strong>at</strong>erials 18 834 560 0.91% 0.91%<br />
Country associ<strong>at</strong>ion according to Ftse (the benchmark provider for <strong>equities</strong>). if a company is not in the benchmark, the country <strong>of</strong> incorpor<strong>at</strong>ion is listed. sector classific<strong>at</strong>ion according to iCb (the industry Classific<strong>at</strong>ion<br />
benchmark company).<br />
voting<br />
ownership<br />
HOLdiNgs<br />
28<br />
<strong>Government</strong> <strong>Pension</strong> FunD <strong>Global</strong> ANNUAL REPORT 2011
<strong>Government</strong> <strong>Pension</strong> <strong>Fund</strong> <strong>Global</strong> <strong>Holding</strong> <strong>of</strong> <strong>equities</strong> <strong>at</strong> <strong>31</strong> December 2011<br />
sector<br />
market value<br />
(noK)<br />
vidrala sa industrials 24 975 211 0.74% 0.74%<br />
visc<strong>of</strong>an sa Consumer Goods 253 547 678 2.45% 2.45%<br />
vocento sa Consumer services 16 552 540 1.10% 1.10%<br />
Zardoya otis sa industrials 197 789 855 0.66% 0.66%<br />
Zeltia sa Health Care 54 570 850 1.84% 1.84%<br />
swEdEN<br />
aarhusKarlshamn ab Consumer Goods 139 057 393 1.96% 1.96%<br />
active biotech ab Health Care 18 475 188 1.39% 1.39%<br />
aF ab industrials 38 242 081 0.82% 1.16%<br />
alfa laval ab industrials 997 640 928 2.10% 2.10%<br />
assa abloy ab industrials 1 133 871 508 1.40% 2.05%<br />
<strong>at</strong>las Copco ab industrials 2 645 406 954 1.54% 1.75%<br />
avanza bank <strong>Holding</strong> ab Financials 123 474 182 3.02% 3.02%<br />
axfood ab Consumer services 135 833 863 1.17% 1.17%<br />
axis Communic<strong>at</strong>ions ab technology 138 086 810 1.65% 1.65%<br />
be Group ab basic m<strong>at</strong>erials 18 287 227 2.10% 2.10%<br />
betsson ab Consumer services 106 554 989 0.90% 1.95%<br />
billerud ab basic m<strong>at</strong>erials 121 223 399 2.27% 2.27%<br />
boliden ab basic m<strong>at</strong>erials 759 730 971 3.17% 3.17%<br />
bure equity ab Financials 11 506 129 0.97% 0.97%<br />
byggmax Group ab Consumer services 40 192 275 2.87% 2.87%<br />
Castellum ab Financials 296 405 508 2.32% 2.32%<br />
CDon Group ab Consumer services 27 408 907 1.26% 1.26%<br />
Clas ohlson ab Consumer services 38 130 081 0.46% 0.83%<br />
Concentric ab Consumer Goods 26 361 139 1.72% 1.72%<br />
D Carnegie & Co ab Financials 99 1.46% 1.46%<br />
electrolux ab Consumer Goods 609 968 902 1.66% 2.07%<br />
elekta ab Health Care 407 425 929 1.24% 1.66%<br />
eniro ab Consumer services 24 137 498 2.42% 2.42%<br />
Fabege ab Financials 189 225 201 2.44% 2.44%<br />
Getinge ab Health Care 7<strong>31</strong> 300 653 1.32% 2.03%<br />
Gunnebo ab industrials 14 759 251 0.93% 0.93%<br />
Hakon invest ab Consumer services 78 195 125 0.58% 0.58%<br />
Haldex ab Consumer Goods 27 362 332 2.82% 2.82%<br />
Hennes & mauritz ab Consumer services 2 202 519 963 0.34% 0.69%<br />
Hexagon ab industrials 495 292 975 1.12% 1.56%<br />
Hexpol ab basic m<strong>at</strong>erials 75 021 403 0.89% 1.24%<br />
HiQ intern<strong>at</strong>ional ab technology 17 941 544 1.35% 1.35%<br />
Hoganas ab basic m<strong>at</strong>erials 139 801 447 1.72% 2.15%<br />
Holmen ab basic m<strong>at</strong>erials 322 422 419 0.65% 2.21%<br />
Hufvudstaden ab Financials 220 564 649 0.35% 1.71%<br />
Husqvarna ab Consumer Goods 246 758 233 1.18% 1.55%<br />
industrivarden ab Financials 612 788 401 1.39% 2.17%<br />
indutrade ab industrials 54 320 299 0.85% 0.85%<br />
intrum Justitia ab Financials 133 426 567 1.78% 1.78%<br />
investor ab Financials 1 414 647 897 0.37% 1.65%<br />
Jm ab Financials 155 132 874 1.90% 1.90%<br />
Kappahl ab Consumer services 20 300 051 1.73% 1.73%<br />
Kinnevik investment ab Financials 584 078 804 0.70% 1.80%<br />
Klovern ab Financials 76 763 339 2.04% 2.04%<br />
Kungsleden ab Financials 137 717 730 2.52% 2.52%<br />
lindab intern<strong>at</strong>ional ab industrials 99 354 855 3.88% 3.88%<br />
loomis ab industrials 140 354 196 2.23% 2.23%<br />
lundbergforetagen ab Financials 116 128 842 0.12% 0.53%<br />
lundin Petroleum ab oil & Gas 753 061 044 1.61% 1.61%<br />
meda ab Health Care <strong>31</strong>3 555 128 1.66% 1.66%<br />
mekonomen ab Consumer Goods 105 638 082 1.64% 1.64%<br />
modern times Group ab Consumer services 356 724 758 1.04% 1.87%<br />
nCC ab industrials 229 885 653 0.56% 2.01%<br />
nibe industrier ab industrials 162 <strong>31</strong>0 117 0.80% 1.67%<br />
nobia ab Consumer Goods 41 430 122 1.11% 1.11%<br />
nordea bank ab Financials 2 481 266 805 1.32% 1.32%<br />
nordnet ab Financials 7 329 062 0.<strong>31</strong>% 0.<strong>31</strong>%<br />
orc Group ab technology 23 254 799 1.32% 1.32%<br />
oresund investment ab Financials 56 867 618 3.10% 3.10%<br />
Pa resources ab oil & Gas 32 189 545 2.74% 2.74%<br />
Peab ab industrials 184 423 782 1.02% 2.09%<br />
r<strong>at</strong>os ab Financials 368 146 561 0.48% 1.62%<br />
rezidor Hotel Group ab Consumer services 45 264 480 1.57% 1.57%<br />
saab ab industrials 111 542 830 0.71% 0.82%<br />
sandvik ab industrials 1 894 612 805 2.17% 2.17%<br />
sas ab Consumer services 34 769 749 1.52% 1.52%<br />
scania ab industrials 817 759 765 0.21% 1.15%<br />
securitas ab industrials 479 424 905 1.79% 2.54%<br />
skandinaviska enskilda banken ab Financials 2 168 717 390 2.86% 2.83%<br />
skanska ab industrials 629 843 591 0.35% 1.50%<br />
sKF ab industrials 1 125 487 115 1.05% 1.95%<br />
skistar ab Consumer services 44 634 824 1.13% 1.60%<br />
ssab ab basic m<strong>at</strong>erials 352 163 554 2.16% 2.13%<br />
svenska Cellulosa ab Consumer Goods 4 450 546 285 7.80% 7.12%<br />
svenska Handelsbanken ab Financials 1 792 641 786 1.85% 1.82%<br />
swedbank ab Financials 1 627 227 423 1.81% 1.81%<br />
tele2 ab telecommunic<strong>at</strong>ions 1 837 601 023 2.49% 3.55%<br />
telefonaktiebolaget lm ericsson technology 3 983 569 186 1.15% 1.99%<br />
teliasonera ab telecommunic<strong>at</strong>ions 1 138 402 902 0.65%<br />
0.65% tradeDoubler ab Consumer services 27 066 855 2.66% 2.66%<br />
trelleborg ab industrials 287 174 187 1.05% 2.04%<br />
volvo ab industrials 4 198 423 724 2.33% 3.00%<br />
vostok Gas ltd oil & Gas 2 0.06% 0.06%<br />
Wallenstam ab Financials 147 812 258 0.82% 1.55%<br />
Wihlborgs Fastigheter ab Financials 239 959 022 3.94% 3.94%<br />
voting<br />
ownership<br />
sector<br />
market value<br />
(noK)<br />
swiTzERLANd<br />
abb ltd industrials 6 504 256 584 2.49% 2.49%<br />
acino <strong>Holding</strong> aG Health Care 37 997 475 1.85% 1.85%<br />
actelion ltd Health Care 470 528 347 1.75% 1.75%<br />
adecco sa industrials 774 522 378 1.63% 1.63%<br />
aFG arbonia-Forster Hldg industrials 46 299 937 2.26% 2.26%<br />
allreal <strong>Holding</strong> aG Financials 156 498 460 1.<strong>31</strong>% 1.<strong>31</strong>%<br />
aryzta aG Consumer Goods 419 828 573 0.81% 1.74%<br />
ascom <strong>Holding</strong> aG technology 33 651 <strong>31</strong>1 1.74% 1.74%<br />
autoneum <strong>Holding</strong> aG Consumer Goods 28 896 648 1.98% 1.98%<br />
bachem <strong>Holding</strong> aG Health Care 7 680 553 0.27% 0.27%<br />
baloise <strong>Holding</strong> aG Financials 297 581 925 1.45% 1.45%<br />
bank sarasin & Cie aG Financials 158 717 992 0.84% 0.84%<br />
banque Cantonale vaudoise Financials 211 322 175 0.84% 0.84%<br />
barry Callebaut aG Consumer Goods 280 909 951 0.92% 0.92%<br />
basilea Pharmaceutica Health Care 41 460 557 1.90% 1.90%<br />
basler Kantonalbank Financials 78 056 587 0.38% 0.<strong>31</strong>%<br />
belimo <strong>Holding</strong> aG industrials 57 150 158 0.86% 0.86%<br />
bellevue Group aG Financials 154 953 0.02% 0.02%<br />
bKW sa utilities 66 635 536 0.55% 0.00%<br />
bobst Group aG industrials 3 774 260 0.14% 0.14%<br />
bucher industries aG industrials 251 378 934 2.27% 2.27%<br />
burckhardt Compression <strong>Holding</strong> aG industrials 122 591 113 2.40% 2.40%<br />
Charles voegele <strong>Holding</strong> aG Consumer services 23 149 759 2.24% 2.24%<br />
Cie Financiere richemont sa Consumer Goods 3 751 976 696 0.28% 1.19%<br />
Cie Financiere tradition sa Financials 10 006 320 0.36% 0.36%<br />
Clariant aG basic m<strong>at</strong>erials 446 642 906 2.55% 2.55%<br />
Coltene <strong>Holding</strong> aG Health Care 10 308 509 1.20% 1.20%<br />
Credit suisse Group aG Financials 3 307 284 381 1.95% 1.95%<br />
Daetwyler <strong>Holding</strong> aG industrials 11 194 960 0.09% 0.09%<br />
Dufry aG Consumer services 244 449 841 1.64% 1.64%<br />
eFG intern<strong>at</strong>ional aG Financials 202 585 238 3.04% 3.04%<br />
emmi aG Consumer Goods 20 642 846 0.<strong>31</strong>% 0.<strong>31</strong>%<br />
ems-Chemie <strong>Holding</strong> aG basic m<strong>at</strong>erials 380 812 692 1.60% 1.60%<br />
Flughafen Zuerich aG industrials 149 410 714 1.17% 1.17%<br />
Forbo <strong>Holding</strong> aG industrials 195 079 993 2.48% 2.48%<br />
Galenica aG Consumer services 377 741 651 1.66% 1.66%<br />
Gam <strong>Holding</strong> aG Financials <strong>31</strong>6 344 384 2.48% 2.48%<br />
G<strong>at</strong>egroup <strong>Holding</strong> aG Consumer services 70 825 464 1.84% 1.84%<br />
Geberit aG industrials 1 061 043 930 2.<strong>31</strong>% 2.<strong>31</strong>%<br />
Georg Fischer aG industrials 216 718 628 2.58% 2.58%<br />
Givaudan sa basic m<strong>at</strong>erials 835 823 587 1.58% 1.58%<br />
Gottex <strong>Fund</strong> management <strong>Holding</strong>s ltd Financials 1 232 755 0.24% 0.24%<br />
Gurit <strong>Holding</strong> aG basic m<strong>at</strong>erials 17 951 987 1.04% 1.04%<br />
Helvetia <strong>Holding</strong> aG Financials 61 051 439 0.37% 0.37%<br />
Holcim ltd industrials 1 702 165 804 1.62% 1.62%<br />
Huber & suhner aG technology 70 639 789 1.39% 1.39%<br />
Julius baer Group ltd Financials 1 154 874 092 2.38% 2.38%<br />
Kaba <strong>Holding</strong> aG industrials 180 466 621 2.27% 2.27%<br />
Kudelski sa technology 57 940 536 1.12% 1.12%<br />
Kuehne + nagel intern<strong>at</strong>ional aG industrials 929 746 410 1.15% 1.15%<br />
Kuoni reisen <strong>Holding</strong> aG Consumer services 93 687 912 1.<strong>31</strong>% 1.<strong>31</strong>%<br />
liechtensteinische landesbank aG Financials 36 222 422 0.44% 0.44%<br />
lindt & spruengli aG Consumer Goods 830 016 665 1.67% 2.15%<br />
logitech intern<strong>at</strong>ional sa technology 211 500 897 2.36% 2.36%<br />
lonza Group aG Health Care 413 360 972 2.21% 2.21%<br />
meyer burger technology aG industrials 14 941 677 0.34% 0.34%<br />
mobimo <strong>Holding</strong> aG Financials 208 886 802 2.55% 2.55%<br />
nestle sa Consumer Goods 25 346 429 094 2.23% 2.23%<br />
nobel biocare <strong>Holding</strong> aG Health Care 209 063 537 2.42% 2.42%<br />
novartis aG Health Care 19 280 980 288 2.05% 2.05%<br />
oC oerlikon Corp aG industrials 187 007 967 1.80% 1.80%<br />
orascom Development <strong>Holding</strong> aG Financials 20 200 014 0.77% 0.77%<br />
Panalpina Welttransport <strong>Holding</strong> aG industrials 259 548 555 1.69% 1.69%<br />
Pargesa <strong>Holding</strong> sa Financials 336 263 023 0.55% 0.55%<br />
Partners Group <strong>Holding</strong> aG Financials 251 987 656 0.90% 0.90%<br />
Petroplus <strong>Holding</strong>s aG oil & Gas 27 333 5<strong>31</strong> 2.58% 2.58%<br />
Phoenix mecano aG industrials 18 597 781 0.61% 0.61%<br />
PsP swiss Property aG Financials 561 800 465 2.44% 2.44%<br />
rieter <strong>Holding</strong> aG industrials 99 640 914 2.37% 2.37%<br />
roche <strong>Holding</strong> aG Health Care 16 278 519 345 0.19% 1.86%<br />
schindler <strong>Holding</strong> aG industrials 736 179 134 0.88% 0.88%<br />
schmolz + bickenbach aG basic m<strong>at</strong>erials 69 751 441 1.73% 1.73%<br />
schweiter technologies aG industrials 1 325 241 0.03% 0.03%<br />
sGs sa industrials 1 218 062 233 1.57% 1.57%<br />
siegfried <strong>Holding</strong> aG Health Care 4 304 578 0.20% 0.20%<br />
sika aG industrials 269 927 679 0.53% 0.53%<br />
sonova <strong>Holding</strong> aG Health Care 682 670 4<strong>31</strong> 1.64% 1.64%<br />
st Galler Kantonalbank aG Financials 92 664 438 0.74% 0.74%<br />
straumann <strong>Holding</strong> aG Health Care 180 119 767 1.11% 1.11%<br />
sulzer aG industrials 482 853 949 2.20% 2.20%<br />
sw<strong>at</strong>ch Group aG/the Consumer Goods 1 965 640 792 1.74% 1.74%<br />
swiss life <strong>Holding</strong> aG Financials 185 972 304 1.05% 1.05%<br />
swiss Prime site aG Financials 457 471 275 1.87% 1.87%<br />
swiss re aG Financials 2 070 922 709 1.83% 1.83%<br />
swisscom aG telecommunic<strong>at</strong>ions 218 336 800 0.19% 0.19%<br />
swissquote Group <strong>Holding</strong> sa Financials 43 743 906 1.42% 1.42%<br />
syngenta aG basic m<strong>at</strong>erials 2 914 777 <strong>31</strong>9 1.77% 1.77%<br />
synthes inc Health Care 1 045 686 938 0.88% 0.88%<br />
tecan Group aG Health Care 145 859 918 3.14% 3.14%<br />
temenos Group aG technology 121 179 380 1.71% 1.71%<br />
Country associ<strong>at</strong>ion according to Ftse (the benchmark provider for <strong>equities</strong>). if a company is not in the benchmark, the country <strong>of</strong> incorpor<strong>at</strong>ion is listed. sector classific<strong>at</strong>ion according to iCb (the industry Classific<strong>at</strong>ion<br />
benchmark company).<br />
voting<br />
ownership<br />
HOLdiNgs<br />
29<br />
<strong>Government</strong> <strong>Pension</strong> FunD <strong>Global</strong> ANNUAL REPORT 2011
<strong>Government</strong> <strong>Pension</strong> <strong>Fund</strong> <strong>Global</strong> <strong>Holding</strong> <strong>of</strong> <strong>equities</strong> <strong>at</strong> <strong>31</strong> December 2011<br />
sector<br />
market value<br />
(noK)<br />
toumaz ltd technology 12 729 651 2.86% 2.86%<br />
transocean ltd/switzerland oil & Gas 1 568 051 690 1.87% 1.87%<br />
ubs aG Financials 10 035 999 434 3.67% 3.67%<br />
valiant <strong>Holding</strong> Financials 265 114 414 2.21% 2.21%<br />
valora <strong>Holding</strong> aG Consumer services 86 635 239 2.47% 2.47%<br />
verwaltungs- und Priv<strong>at</strong>-bank aG Financials 93 324 2<strong>31</strong> 1.58% 1.58%<br />
vetropack <strong>Holding</strong> aG industrials 32 509 659 0.28% 0.28%<br />
von roll <strong>Holding</strong> aG industrials 20 535 783 0.68% 0.68%<br />
vontobel <strong>Holding</strong> aG Financials 88 613 029 1.02% 1.02%<br />
Ypsomed <strong>Holding</strong> aG Health Care 507 222 0.01% 0.01%<br />
Zehnder Group aG industrials 57 495 809 0.89% 0.89%<br />
Zueblin immobilien <strong>Holding</strong> aG Financials 4 837 972 0.53% 0.53%<br />
Zurich Financial services aG Financials 6 093 600 445 3.05% 3.05%<br />
TAiwAN<br />
ability enterprise Co ltd Consumer Goods 12 849 298 0.56% 0.56%<br />
acbel Polytech inc industrials 9 627 329 0.59% 0.59%<br />
accton technology Corp technology 7 065 039 0.50% 0.50%<br />
acer inc technology 96 221 534 0.51% 0.51%<br />
aCes electronic Co ltd technology 6 984 038 0.58% 0.58%<br />
a-D<strong>at</strong>a technology Co ltd technology 6 402 092 0.45% 0.45%<br />
advanced intern<strong>at</strong>ional multitech Co ltd Consumer Goods 5 148 562 0.67% 0.67%<br />
advanced semiconductor engineering inc technology 203 064 042 0.59% 0.59%<br />
advantech Co ltd technology 42 007 562 0.46% 0.46%<br />
aGv Products Corp Consumer Goods 3 406 804 0.34% 0.34%<br />
ali Corp technology 11 850 347 0.66% 0.66%<br />
alpha networks inc technology 12 308 608 0.61% 0.61%<br />
altek Corp Consumer Goods 11 795 307 0.63% 0.63%<br />
ambassador Hotel/the Consumer services 13 196 779 0.58% 0.58%<br />
amtran technology Co ltd Consumer Goods 15 879 266 0.62% 0.62%<br />
ardentec Corp technology 13 759 834 0.81% 0.81%<br />
asia Cement Corp industrials 111 638 300 0.53% 0.53%<br />
asia optical Co inc industrials 7 936 699 0.60% 0.60%<br />
asia Polymer Corp basic m<strong>at</strong>erials 13 162 506 0.55% 0.55%<br />
asia vital Components Co ltd industrials 5 501 796 0.43% 0.43%<br />
asustek Computer inc technology 167 061 339 0.52% 0.52%<br />
<strong>at</strong>en intern<strong>at</strong>ional Co ltd technology 5 384 305 0.45% 0.45%<br />
au optronics Corp technology 150 692 891 0.67% 0.67%<br />
av tech Corp/taiwan industrials 10 949 057 0.62% 0.62%<br />
avermedia technologies technology 4 874 186 0.49% 0.49%<br />
bank <strong>of</strong> Kaohsiung Financials 4 111 269 0.33% 0.33%<br />
basso industry Corp Consumer Goods 2 556 054 0.40% 0.40%<br />
bes engineering Corp industrials 17 807 482 0.75% 0.75%<br />
bright led electronics Corp industrials 3 083 777 0.34% 0.34%<br />
Capital securities Corp Financials 27 781 655 0.57% 0.57%<br />
Career technology mFG. Co ltd industrials 14 877 432 0.60% 0.60%<br />
C<strong>at</strong>cher technology Co ltd industrials 129 580 750 0.65% 0.65%<br />
C<strong>at</strong>hay Financial <strong>Holding</strong> Co ltd Financials 325 979 886 0.49% 0.49%<br />
C<strong>at</strong>hay real est<strong>at</strong>e Development Co ltd Financials 14 522 556 0.43% 0.43%<br />
Central reinsurance Co ltd Financials 4 645 369 0.34% 0.34%<br />
Champion building m<strong>at</strong>erials Co ltd industrials 123 679 0.01% 0.01%<br />
Chang Hwa Commercial bank Financials 82 682 074 0.38% 0.38%<br />
Cheng loong Corp basic m<strong>at</strong>erials 14 232 413 0.63% 0.63%<br />
Cheng shin rubber industry Co ltd Consumer Goods 154 729 762 0.48% 0.48%<br />
Cheng uei Precision industry Co ltd industrials 26 504 034 0.48% 0.48%<br />
Chia Hsin Cement Corp industrials 4 478 500 0.25% 0.25%<br />
Chicony electronics Co ltd technology 40 641 179 0.64% 0.64%<br />
Chimei innolux Corp technology 95 647 065 0.54% 0.54%<br />
China airlines ltd Consumer services 30 497 246 0.25% 0.25%<br />
China bills Finance Corp Financials 12 669 564 0.46% 0.46%<br />
China Chemical & Pharmaceutical Co ltd Health Care 1 495 437 0.15% 0.15%<br />
China Development Financial <strong>Holding</strong> Corp Financials 122 465 322 0.64% 0.64%<br />
China electric manufacturing Corp industrials 7 443 854 0.52% 0.52%<br />
China General Plastics Corp basic m<strong>at</strong>erials 2 558 514 0.34% 0.34%<br />
China life insurance Co ltd/taiwan Financials 65 656 417 0.62% 0.62%<br />
China manmade Fibers Corp basic m<strong>at</strong>erials 17 826 895 0.71% 0.71%<br />
China metal Products industrials 8 862 216 0.65% 0.65%<br />
China motor Corp Consumer Goods 23 877 100 0.32% 0.32%<br />
China Petrochemical Development Corp basic m<strong>at</strong>erials 65 623 677 0.63% 0.63%<br />
China steel Chemical Corp basic m<strong>at</strong>erials 28 163 634 0.52% 0.52%<br />
China steel Corp basic m<strong>at</strong>erials 414 112 948 0.48% 0.48%<br />
China synthetic rubber Corp basic m<strong>at</strong>erials 18 251 184 0.59% 0.59%<br />
Chin<strong>at</strong>rust Financial <strong>Holding</strong> Co ltd Financials 257 935 477 0.65% 0.65%<br />
Chinese Gamer intern<strong>at</strong>ional Corp Consumer Goods 4 338 062 0.35% 0.35%<br />
Chinese maritime transport ltd industrials 2 916 272 0.14% 0.14%<br />
Chin-Poon industrial Co industrials 12 <strong>31</strong>4 427 0.80% 0.80%<br />
Chipbond technology Corp technology 22 377 269 0.65% 0.65%<br />
Chong Hong Construction Co industrials 12 601 615 0.52% 0.52%<br />
Chroma <strong>at</strong>e inc industrials 21 277 782 0.48% 0.48%<br />
Chun Yuan steel basic m<strong>at</strong>erials 4 869 862 0.33% 0.33%<br />
Chung Hsin electric & machinery<br />
manufacturing Corp industrials 10 144 382 0.70% 0.70%<br />
Chung Hung steel Corp basic m<strong>at</strong>erials 8 472 322 0.34% 0.34%<br />
Chung Hwa Pulp Corp basic m<strong>at</strong>erials 3 325 026 0.30% 0.30%<br />
Chunghwa Picture tubes technology 4 000 059 0.25% 0.25%<br />
Chunghwa telecom Co ltd telecommunic<strong>at</strong>ions 484 419 166 0.32% 0.32%<br />
Clevo Co technology 38 818 881 0.64% 0.64%<br />
CmC magnetics Corp technology 16 877 558 0.60% 0.60%<br />
Compal Communic<strong>at</strong>ions inc technology 17 860 207 0.33% 0.33%<br />
Compal electronics inc technology 170 188 623 0.65% 0.65%<br />
Compeq manufacturing Co industrials 17 458 058 0.80% 0.80%<br />
Concord securities Corp Financials 7 126 026 0.84% 0.84%<br />
voting<br />
ownership<br />
sector<br />
market value<br />
(noK)<br />
Continental <strong>Holding</strong>s Corp industrials 11 384 664 0.63% 0.63%<br />
Coretronic Corp industrials 20 784 952 0.71% 0.71%<br />
CsbC Corp taiwan industrials 15 946 474 0.48% 0.48%<br />
CtCi Corp industrials 26 193 094 0.46% 0.46%<br />
Cyberlink Corp technology 6 661 509 0.57% 0.57%<br />
Cybertan technology inc technology 12 499 215 0.74% 0.74%<br />
Darfon electronics Corp industrials 5 493 376 0.53% 0.53%<br />
Delta electronics inc industrials 218 661 123 0.64% 0.64%<br />
Depo auto Parts ind Co ltd Consumer Goods 10 837 272 0.57% 0.57%<br />
D-link Corp technology 17 178 527 0.66% 0.66%<br />
Dynamic electronics Co ltd industrials 4 795 187 0.79% 0.79%<br />
Dynapack intern<strong>at</strong>ional technology Corp industrials 17 166 415 0.58% 0.58%<br />
e ink <strong>Holding</strong>s inc industrials 149 436 773 1.78% 1.78%<br />
e.sun Financial <strong>Holding</strong> Co ltd Financials 58 140 012 0.49% 0.49%<br />
eastern media intern<strong>at</strong>ional Corp industrials 2 616 482 0.24% 0.24%<br />
elan microelectronics Corp technology 13 128 991 0.65% 0.65%<br />
elite m<strong>at</strong>erial Co ltd industrials 9 404 480 0.86% 0.86%<br />
elite semiconductor memory technology inc technology 7 614 328 0.61% 0.61%<br />
elitegroup Computer systems Co ltd technology 5 928 904 0.40% 0.40%<br />
enG electric Co ltd industrials 7 124 387 0.60% 0.60%<br />
entire technology Co ltd industrials 5 334 <strong>31</strong>5 0.49% 0.49%<br />
epistar Corp technology 102 336 254 0.94% 0.94%<br />
eternal Chemical Co ltd basic m<strong>at</strong>erials 17 443 626 0.38% 0.38%<br />
e-ton solar tech Co ltd oil & Gas 3 088 473 0.26% 0.26%<br />
etron technology inc technology 5 668 052 0.66% 0.66%<br />
eva airways Corp Consumer services 39 869 612 0.32% 0.32%<br />
evergreen intern<strong>at</strong>ional storage &<br />
transport Corp industrials 9 <strong>31</strong>7 868 0.<strong>31</strong>% 0.<strong>31</strong>%<br />
evergreen marine Corp taiwan ltd industrials 32 881 260 0.<strong>31</strong>% 0.<strong>31</strong>%<br />
everlight Chemical industrial Corp basic m<strong>at</strong>erials 6 770 952 0.50% 0.50%<br />
everlight electronics Co ltd industrials 29 973 199 0.69% 0.69%<br />
everskill technology Co ltd industrials 32 0.35% 0.35%<br />
Far eastern Department stores Co ltd Consumer services 60 615 079 0.65% 0.65%<br />
Far eastern intern<strong>at</strong>ional bank Financials 24 766 412 0.53% 0.53%<br />
Far eastern new Century Corp Consumer Goods 180 569 826 0.53% 0.53%<br />
Far eastone telecommunic<strong>at</strong>ions Co ltd telecommunic<strong>at</strong>ions 119 749 545 0.33% 0.33%<br />
Faraday technology Corp technology 13 741 657 0.61% 0.61%<br />
Farglory land Development Co ltd Financials 17 853 688 0.25% 0.25%<br />
Federal Corp Consumer Goods 8 569 122 0.83% 0.83%<br />
Feng Hsin iron & steel Co basic m<strong>at</strong>erials <strong>31</strong> 773 862 0.57% 0.57%<br />
Feng taY enterprise Co ltd Consumer Goods 15 089 679 0.56% 0.56%<br />
Firich enterprises Co ltd technology 6 305 304 0.76% 0.76%<br />
First Financial <strong>Holding</strong> Co ltd Financials 129 756 195 0.48% 0.48%<br />
First Hotel Consumer services 812 937 0.07% 0.07%<br />
First steamship Co ltd industrials 11 188 495 0.58% 0.58%<br />
Forhouse Corp industrials 7 618 809 0.50% 0.50%<br />
Formosa Chemicals & Fibre Corp basic m<strong>at</strong>erials 434 523 950 0.48% 0.48%<br />
Formosa epitaxy inc technology 8 776 615 0.51% 0.51%<br />
Formosa intern<strong>at</strong>ional Hotels Corp Consumer services 21 948 007 0.32% 0.32%<br />
Formosa Petrochemical Corp oil & Gas 226 733 850 0.13% 0.13%<br />
Formosa Plastics Corp basic m<strong>at</strong>erials 630 379 769 0.65% 0.65%<br />
Formosa taffeta Co ltd Consumer Goods 45 830 069 0.49% 0.49%<br />
Formosan rubber Group inc basic m<strong>at</strong>erials 10 800 967 0.60% 0.60%<br />
Foxconn technology Co ltd industrials 144 367 283 0.65% 0.65%<br />
FsP technology inc industrials 3 705 169 0.33% 0.33%<br />
Fubon Financial <strong>Holding</strong> Co ltd Financials 274 354 470 0.48% 0.48%<br />
Gemtek technology Corp technology 8 228 713 0.66% 0.66%<br />
Genesis Photonics inc technology 8 480 662 0.42% 0.42%<br />
Genius electronic optical Co ltd industrials 19 089 478 0.53% 0.53%<br />
Geovision inc industrials 3 768 547 0.33% 0.33%<br />
Getac technology Corp technology 8 478 395 0.53% 0.53%<br />
Giant manufacturing Co ltd Consumer Goods <strong>31</strong> 383 668 0.36% 0.36%<br />
Giantplus technology Co ltd industrials 1 938 386 0.29% 0.29%<br />
Gigabyte technology Co ltd technology 16 894 <strong>31</strong>7 0.63% 0.63%<br />
Gigastorage Corp industrials 5 163 143 0.55% 0.55%<br />
Gintech energy Corp oil & Gas 12 386 114 0.57% 0.57%<br />
<strong>Global</strong> brands manufacture ltd industrials 2 695 422 0.21% 0.21%<br />
<strong>Global</strong> mixed mode technology inc technology 8 727 124 0.73% 0.73%<br />
<strong>Global</strong> unichip Corp technology 12 737 765 0.49% 0.49%<br />
Globe union industrial Corp industrials 7 120 661 0.62% 0.62%<br />
Gloria m<strong>at</strong>erial technology Corp basic m<strong>at</strong>erials 12 747 602 0.69% 0.69%<br />
Gold Circuit electronics ltd industrials 2 692 854 0.35% 0.35%<br />
Goldsun Development & Construction Co ltd industrials 21 201 037 0.68% 0.68%<br />
Grand Pacific Petrochemical basic m<strong>at</strong>erials 16 380 672 0.69% 0.69%<br />
Gre<strong>at</strong> China metal industry industrials 5 720 236 0.32% 0.32%<br />
Gre<strong>at</strong> taipei Gas Co ltd utilities 4 262 041 0.23% 0.23%<br />
Gre<strong>at</strong> Wall enterprise Co ltd Consumer Goods 20 134 170 0.71% 0.71%<br />
Gre<strong>at</strong>ek electronics inc technology 15 539 854 0.59% 0.59%<br />
Green energy technology inc oil & Gas 7 700 652 0.42% 0.42%<br />
Hannstar Display Corp technology 8 153 158 0.45% 0.45%<br />
Hannstouch solution inc industrials 15 006 142 0.71% 0.71%<br />
Harv<strong>at</strong>ek Corp industrials 2 335 411 0.35% 0.35%<br />
Hey song Corp Consumer Goods 6 794 700 0.26% 0.26%<br />
Highwealth Construction Corp Financials 40 524 873 0.65% 0.65%<br />
Hiwin technologies Corp industrials 73 672 944 0.65% 0.65%<br />
Ho tung Chemical Corp basic m<strong>at</strong>erials 13 586 866 0.58% 0.58%<br />
Holtek semiconductor inc technology 6 330 002 0.54% 0.54%<br />
Holy stone enterprise Co ltd industrials 12 557 922 0.77% 0.77%<br />
Hon Hai Precision industry Co ltd industrials 1 158 625 508 0.66% 0.66%<br />
Hsin Kuang steel Co ltd basic m<strong>at</strong>erials 7 017 999 0.72% 0.72%<br />
Hsing ta Cement Co industrials 1 596 972 0.18% 0.18%<br />
Country associ<strong>at</strong>ion according to Ftse (the benchmark provider for <strong>equities</strong>). if a company is not in the benchmark, the country <strong>of</strong> incorpor<strong>at</strong>ion is listed. sector classific<strong>at</strong>ion according to iCb (the industry Classific<strong>at</strong>ion<br />
benchmark company).<br />
voting<br />
ownership<br />
HOLdiNgs<br />
30<br />
<strong>Government</strong> <strong>Pension</strong> FunD <strong>Global</strong> ANNUAL REPORT 2011
<strong>Government</strong> <strong>Pension</strong> <strong>Fund</strong> <strong>Global</strong> <strong>Holding</strong> <strong>of</strong> <strong>equities</strong> <strong>at</strong> <strong>31</strong> December 2011<br />
sector<br />
market value<br />
(noK)<br />
HtC Corp technology 545 964 665 0.65% 0.65%<br />
Hua enG Wire & Cable industrials 4 348 873 0.48% 0.48%<br />
Hua nan Financial <strong>Holding</strong>s Co ltd Financials 136 542 250 0.52% 0.52%<br />
Huaku Development Co ltd Financials 20 778 708 0.63% 0.63%<br />
Huang Hsiang Construction Co industrials 13 489 363 0.45% 0.45%<br />
Hung Poo real est<strong>at</strong>e Development Corp Financials 2 913 701 0.23% 0.23%<br />
Hung sheng Construction Co ltd industrials 9 691 622 0.60% 0.60%<br />
iCP electronics inc technology 10 328 212 0.60% 0.60%<br />
infortrend technology inc technology 8 932 748 0.66% 0.66%<br />
inotera memories inc technology 16 125 875 0.35% 0.35%<br />
intern<strong>at</strong>ional Games system Co ltd Consumer Goods 12 771 079 0.45% 0.45%<br />
inventec Corp technology 52 004 813 0.69% 0.69%<br />
ite technology inc technology 5 761 982 0.61% 0.61%<br />
iteQ Corp industrials 8 660 294 0.53% 0.53%<br />
J touch Corp industrials 3 028 150 0.39% 0.39%<br />
Jenn Feng new energy Co ltd Consumer Goods 2 165 353 0.34% 0.34%<br />
Jentech Precision industrial Co ltd industrials 4 381 887 0.32% 0.32%<br />
Jess-link Products Co ltd technology 5 892 818 0.62% 0.62%<br />
Jih sun Financial <strong>Holding</strong>s Co ltd Financials 24 384 3<strong>31</strong> 0.59% 0.59%<br />
Johnson Health tech Co ltd Consumer Goods 4 527 590 0.19% 0.19%<br />
Kee tai Properties Co ltd industrials 4 395 251 0.45% 0.45%<br />
Kenda rubber industrial Co ltd Consumer Goods 18 564 697 0.45% 0.45%<br />
Kerry tJ logistics Co ltd industrials 19 259 7<strong>31</strong> 0.65% 0.65%<br />
KGi securities Co ltd Financials 44 739 547 0.64% 0.64%<br />
Kindom Construction Co Financials 8 856 726 0.63% 0.63%<br />
King slide Works Co ltd industrials 11 650 555 0.45% 0.45%<br />
King Yuan electronics Co ltd technology 16 877 199 0.67% 0.67%<br />
King’s town bank Financials 23 564 050 0.67% 0.67%<br />
King’s town Construction Co ltd Financials 9 948 481 0.79% 0.79%<br />
Kinik Co industrials 7 263 662 0.79% 0.79%<br />
Kinpo electronics Consumer Goods 10 903 142 0.60% 0.60%<br />
Kinsus interconnect technology Corp technology 23 525 598 0.33% 0.33%<br />
Kuoyang Construction Co ltd Financials 6 109 644 0.65% 0.65%<br />
KYe systems Corp technology 1 922 324 0.28% 0.28%<br />
l&K engineering Co ltd industrials 4 871 894 0.49% 0.49%<br />
largan Precision Co ltd Consumer Goods 77 481 491 0.52% 0.52%<br />
lCY Chemical Corp basic m<strong>at</strong>erials 34 446 465 0.50% 0.50%<br />
lealea enterprise Co ltd Consumer Goods 11 196 203 0.66% 0.66%<br />
les enphants Co ltd Consumer Goods 6 404 189 0.52% 0.52%<br />
li Peng enterprise Co ltd Consumer Goods 6 941 341 0.61% 0.61%<br />
lien Hwa industrial Corp Consumer Goods 15 949 066 0.54% 0.54%<br />
lingsen Precision industries ltd technology 2 220 513 0.23% 0.23%<br />
lite-on it Corp technology 12 805 686 0.29% 0.29%<br />
lite-on semiconductor Corp technology 7 551 008 0.71% 0.71%<br />
lite-on technology Corp industrials 102 873 546 0.66% 0.66%<br />
long bon intern<strong>at</strong>ional Co ltd Financials 9 046 891 0.84% 0.84%<br />
long Chen Paper Co ltd basic m<strong>at</strong>erials 6 034 125 0.52% 0.52%<br />
lotes Co ltd industrials 4 238 843 0.<strong>31</strong>% 0.<strong>31</strong>%<br />
lung Yen life service Corp Financials 23 199 221 0.33% 0.33%<br />
macronix intern<strong>at</strong>ional technology 47 941 244 0.59% 0.59%<br />
makalot industrial Co ltd Consumer Goods 11 924 416 0.54% 0.54%<br />
masterlink securities Corp Financials 16 846 568 0.60% 0.60%<br />
medi<strong>at</strong>ek inc technology 677 0<strong>31</strong> 050 1.08% 1.08%<br />
mega Financial <strong>Holding</strong> Co ltd Financials 219 922 443 0.49% 0.49%<br />
mercuries & associ<strong>at</strong>es ltd Consumer services 18 288 137 0.53% 0.53%<br />
merida industry Co ltd Consumer Goods 12 558 779 0.41% 0.41%<br />
merry electronics Co ltd technology 3 653 618 0.35% 0.35%<br />
microbio Co ltd Consumer Goods 9 914 091 0.50% 0.50%<br />
microelectronics technology inc technology 2 117 624 0.37% 0.37%<br />
microlife Corp Health Care 2 403 906 0.22% 0.22%<br />
micro-star intern<strong>at</strong>ional Co ltd technology 9 336 916 0.38% 0.38%<br />
min aiK technology Co ltd technology 10 343 666 0.59% 0.59%<br />
mitac intern<strong>at</strong>ional Corp technology 15 172 776 0.54% 0.54%<br />
mosel vitelic inc technology 3 987 604 0.73% 0.73%<br />
motech industries inc oil & Gas 20 873 152 0.46% 0.46%<br />
mstar semiconductor inc technology 102 095 356 0.61% 0.61%<br />
namchow Chemical industrial ltd Consumer Goods 7 280 430 0.55% 0.55%<br />
nan Kang rubber tire Co ltd Consumer Goods 41 841 212 0.65% 0.65%<br />
nan Ya Plastics Corp basic m<strong>at</strong>erials 601 343 762 0.65% 0.65%<br />
nan Ya Printed Circuit board Corp industrials 21 <strong>31</strong>2 769 0.27% 0.27%<br />
nanya technology Corp technology 4 626 639 0.26% 0.26%<br />
n<strong>at</strong>ional Petroleum Co ltd Consumer services 12 085 695 0.64% 0.64%<br />
neo solar Power Corp oil & Gas 11 703 585 0.73% 0.73%<br />
newmax technology Co ltd Consumer Goods 2 099 396 0.<strong>31</strong>% 0.<strong>31</strong>%<br />
nien Hsing textile Co ltd Consumer Goods 10 377 836 0.55% 0.55%<br />
nov<strong>at</strong>ek microelectronics Corp technology 43 208 848 0.48% 0.48%<br />
opto technology Corp technology 8 530 248 0.70% 0.70%<br />
oriental union Chemical Corp basic m<strong>at</strong>erials 32 422 867 0.54% 0.54%<br />
o-ta Precision industry Co ltd Consumer Goods 1 503 867 0.35% 0.35%<br />
Pacific electric Wire & Cable Co ltd industrials 5 0.01% 0.01%<br />
Pan Jit intern<strong>at</strong>ional inc technology 6 538 551 0.61% 0.61%<br />
Pan-intern<strong>at</strong>ional industrial industrials 12 615 855 0.54% 0.54%<br />
Peg<strong>at</strong>ron Corp technology 70 540 243 0.48% 0.48%<br />
Phihong technology Co ltd industrials 11 332 585 0.60% 0.60%<br />
Phison electronics Corp technology 41 240 326 0.64% 0.64%<br />
Pihsiang machinery manufacturing Co ltd Health Care 8 377 067 0.58% 0.58%<br />
Pixart imaging inc technology 10 620 495 0.60% 0.60%<br />
Pou Chen Corp Consumer Goods 96 550 450 0.68% 0.68%<br />
Powerchip technology Corp technology 4 587 356 0.49% 0.49%<br />
Powercom Co ltd industrials 3 605 122 0.65% 0.65%<br />
Powertech technology inc technology 67 057 480 0.66% 0.66%<br />
voting<br />
ownership<br />
sector<br />
market value<br />
(noK)<br />
President Chain store Corp Consumer services 164 093 681 0.49% 0.49%<br />
President securities Corp Financials 16 175 385 0.44% 0.44%<br />
Prince Housing & Development Corp Financials 18 339 799 0.53% 0.53%<br />
Promos technologies inc technology 512 580 0.60% 0.60%<br />
Qisda Corp technology 13 263 266 0.55% 0.55%<br />
Quanta Computer inc technology 194 530 435 0.40% 0.40%<br />
Quanta storage inc technology 5 325 395 0.50% 0.50%<br />
radiant opto-electronics Corp industrials 48 224 554 0.64% 0.64%<br />
radium life tech Co ltd Financials 12 767 197 0.44% 0.44%<br />
realtek semiconductor Corp technology 28 285 267 0.66% 0.66%<br />
richtek technology Corp technology 25 938 415 0.70% 0.70%<br />
ritek Corp industrials 14 636 741 0.61% 0.61%<br />
ruentex Development Co ltd Consumer services 40 529 459 0.65% 0.65%<br />
ruentex industries ltd Consumer Goods 42 469 828 0.52% 0.52%<br />
sampo Corp Consumer Goods 4 570 650 0.47% 0.47%<br />
san Fang Chemical industry Co ltd basic m<strong>at</strong>erials 912 500 0.06% 0.06%<br />
san shing Fastech Corp industrials 6 011 046 0.33% 0.33%<br />
sanyang industry Co ltd Consumer Goods 17 838 200 0.61% 0.61%<br />
sanyo electric taiwan Co ltd Consumer Goods 4 003 665 0.23% 0.23%<br />
senao intern<strong>at</strong>ional Co ltd technology 24 726 503 0.53% 0.53%<br />
sheng Yu steel Co ltd basic m<strong>at</strong>erials 2 152 869 0.18% 0.18%<br />
shih Wei navig<strong>at</strong>ion Co ltd industrials 7 857 514 0.44% 0.44%<br />
shihlin electric & engineering Corp industrials 14 973 190 0.46% 0.46%<br />
shihlin Paper Corp basic m<strong>at</strong>erials 10 478 060 0.49% 0.49%<br />
shin Kong Financial <strong>Holding</strong> Co ltd Financials 63 454 336 0.44% 0.44%<br />
shin Zu shing Co ltd industrials 10 250 503 0.56% 0.56%<br />
shining building business Co ltd Financials 12 469 709 0.60% 0.60%<br />
shinkong synthetic Fibers Corp Consumer Goods 18 583 470 0.64% 0.64%<br />
shinkong textile Co ltd Consumer Goods 11 345 325 0.59% 0.59%<br />
silicon integr<strong>at</strong>ed systems Corp technology 11 230 033 0.68% 0.68%<br />
siliconware Precision industries Co technology 107 728 178 0.65% 0.65%<br />
silitech technology Corp industrials 10 265 957 0.42% 0.42%<br />
simplo technology Co ltd industrials 65 721 173 0.67% 0.67%<br />
sincere navig<strong>at</strong>ion Corp industrials 11 114 875 0.39% 0.39%<br />
sino-american silicon Products inc technology 27 528 343 0.68% 0.68%<br />
sinoPac Financial <strong>Holding</strong>s Co ltd Financials 85 875 903 0.65% 0.65%<br />
sinyi realty Co Financials 12 028 614 0.37% 0.37%<br />
sitronix technology Corp technology 3 129 407 0.41% 0.41%<br />
s<strong>of</strong>t-World intern<strong>at</strong>ional Corp Consumer Goods 8 066 048 0.60% 0.60%<br />
solar applied m<strong>at</strong>erials technology Co basic m<strong>at</strong>erials 13 462 840 0.59% 0.59%<br />
solartech energy Corp oil & Gas 7 069 741 0.51% 0.51%<br />
sonix technology Co ltd technology 6 829 697 0.56% 0.56%<br />
southeast Cement Co ltd industrials 3 961 486 0.35% 0.35%<br />
springs<strong>of</strong>t inc technology 10 362 779 0.78% 0.78%<br />
st shine optical Co ltd Health Care 18 703 369 0.59% 0.59%<br />
standard Foods Corp Consumer Goods 32 145 682 0.38% 0.38%<br />
sunplus technology Co ltd technology 6 510 471 0.56% 0.56%<br />
sunrex technology Corp technology 2 812 996 0.23% 0.23%<br />
syncmold enterprise Corp industrials 4 406 337 0.51% 0.51%<br />
synnex technology intern<strong>at</strong>ional Corp technology 146 <strong>31</strong>0 898 0.66% 0.66%<br />
systex Corp technology 9 368 387 0.58% 0.58%<br />
ta Chen stainless Pipe basic m<strong>at</strong>erials 13 954 974 0.67% 0.67%<br />
ta Chong bank ltd Financials 16 672 872 0.55% 0.55%<br />
ta Ya electric Wire & Cable industrials 4 190 822 0.48% 0.48%<br />
taichung Commercial bank Financials 22 237 305 0.58% 0.58%<br />
taiflex scientific Co ltd industrials 6 870 420 0.52% 0.52%<br />
tainan spinning Co ltd Consumer Goods 13 178 617 0.42% 0.42%<br />
taishin Financial <strong>Holding</strong> Co ltd Financials 85 960 147 0.66% 0.66%<br />
taiwan acceptance Corp Financials 4 218 226 0.18% 0.18%<br />
taiwan business bank Financials 40 879 574 0.47% 0.47%<br />
taiwan Cement Corp industrials 164 644 019 0.65% 0.65%<br />
taiwan Cogener<strong>at</strong>ion Corp utilities 3 987 250 0.18% 0.18%<br />
taiwan Cooper<strong>at</strong>ive Financial <strong>Holding</strong> Financials 114 844 660 0.49% 0.49%<br />
taiwan Fertilizer Co ltd basic m<strong>at</strong>erials 68 643 547 0.50% 0.50%<br />
taiwan Fire & marine insurance Co Financials 5 982 449 0.40% 0.40%<br />
taiwan Glass industry Corp industrials 69 272 374 0.50% 0.50%<br />
taiwan Hon Chuan enterprise Co ltd industrials 19 287 651 0.67% 0.67%<br />
taiwan life insurance Co ltd Financials 8 355 757 0.<strong>31</strong>% 0.<strong>31</strong>%<br />
taiwan mask Corp technology 3 007 484 0.48% 0.48%<br />
taiwan mobile Co ltd telecommunic<strong>at</strong>ions 174 074 900 0.27% 0.27%<br />
taiwan navig<strong>at</strong>ion Co ltd industrials 10 630 861 0.41% 0.41%<br />
taiwan Paiho ltd Consumer Goods 9 882 021 0.73% 0.73%<br />
taiwan PCb techvest Co ltd industrials 2 818 539 0.26% 0.26%<br />
taiwan secom Co ltd industrials 24 <strong>31</strong>3 756 0.51% 0.51%<br />
taiwan semiconductor Co ltd technology 4 569 8<strong>31</strong> 0.66% 0.66%<br />
taiwan semiconductor manufacturing Co ltd technology 2 748 168 057 0.64% 0.71%<br />
taiwan sogo shin Kong seC industrials 713 103 0.04% 0.04%<br />
taiwan styrene monomer basic m<strong>at</strong>erials 6 5<strong>31</strong> 193 0.82% 0.82%<br />
taiwan surface mounting technology Co ltd industrials 19 215 873 0.68% 0.68%<br />
taiwan tea Corp Consumer Goods 8 597 558 0.53% 0.53%<br />
taiyen biotech Co ltd Consumer Goods 3 862 739 0.34% 0.34%<br />
t<strong>at</strong>ung Co ltd technology 20 893 932 0.59% 0.60%<br />
teco electric and machinery Co ltd Consumer Goods 42 271 983 0.66% 0.66%<br />
tecom Co ltd technology 475 500 0.32% 0.32%<br />
test research inc technology 5 612 078 0.47% 0.47%<br />
test-rite intern<strong>at</strong>ional Co ltd Consumer Goods 14 754 717 0.71% 0.71%<br />
ton Yi industrial Corp basic m<strong>at</strong>erials 23 963 379 0.55% 0.55%<br />
tong Hsing electronic industries ltd technology 12 323 771 0.53% 0.53%<br />
tong Yang industry Co ltd Consumer Goods 21 405 436 0.60% 0.60%<br />
tong-tai machine & tool Co ltd industrials 8 381 035 0.80% 0.80%<br />
topco scientific Co ltd technology 10 308 197 0.82% 0.82%<br />
Country associ<strong>at</strong>ion according to Ftse (the benchmark provider for <strong>equities</strong>). if a company is not in the benchmark, the country <strong>of</strong> incorpor<strong>at</strong>ion is listed. sector classific<strong>at</strong>ion according to iCb (the industry Classific<strong>at</strong>ion<br />
benchmark company).<br />
voting<br />
ownership<br />
HOLdiNgs<br />
<strong>31</strong><br />
<strong>Government</strong> <strong>Pension</strong> FunD <strong>Global</strong> ANNUAL REPORT 2011
<strong>Government</strong> <strong>Pension</strong> <strong>Fund</strong> <strong>Global</strong> <strong>Holding</strong> <strong>of</strong> <strong>equities</strong> <strong>at</strong> <strong>31</strong> December 2011<br />
sector<br />
market value<br />
(noK)<br />
tPK <strong>Holding</strong> Co ltd industrials 52 251 640 0.29% 0.29%<br />
transcend inform<strong>at</strong>ion inc technology 21 341 674 0.32% 0.32%<br />
tripod technology Corp industrials 55 409 151 0.73% 0.73%<br />
tsann Kuen enterprise Co ltd Consumer Goods 6 043 630 0.28% 0.28%<br />
tsrC Corp basic m<strong>at</strong>erials 70 501 213 0.67% 0.67%<br />
ttY biopharm Co ltd Health Care 13 228 344 0.46% 0.46%<br />
tung Ho steel enterprise Corp basic m<strong>at</strong>erials 23 152 164 0.45% 0.45%<br />
tXC Corp industrials 14 875 747 0.72% 0.72%<br />
tYC brother industrial Co ltd Consumer Goods 1 725 891 0.23% 0.23%<br />
tyntek Corp technology 3 129 700 0.42% 0.42%<br />
u-ming marine transport Corp industrials 24 347 <strong>31</strong>3 0.32% 0.32%<br />
unimicron technology Corp industrials 78 751 666 0.73% 0.73%<br />
uni-President enterprises Corp Consumer Goods 256 340 491 0.65% 0.65%<br />
unitech Printed Circuit board Corp industrials 11 474 937 0.88% 0.88%<br />
united integr<strong>at</strong>ed services Co ltd industrials 9 336 504 0.78% 0.78%<br />
united microelectronics Corp technology 210 235 077 0.64% 0.64%<br />
unity opto technology Co ltd industrials 8 847 119 0.53% 0.53%<br />
universal Cement Corp industrials 10 870 996 0.69% 0.69%<br />
unizyx <strong>Holding</strong> Corp technology 8 759 775 0.54% 0.54%<br />
uPC technology Corp basic m<strong>at</strong>erials 12 974 837 0.40% 0.40%<br />
usi Corp basic m<strong>at</strong>erials 20 934 975 0.44% 0.44%<br />
vanguard intern<strong>at</strong>ional semiconductor Corp technology 10 385 424 0.30% 0.30%<br />
via technologies inc technology 13 375 644 0.42% 0.42%<br />
visual Photonics epitaxy Co ltd technology 9 974 146 0.69% 0.69%<br />
Wafer Works Corp technology 7 202 828 0.70% 0.70%<br />
Wah lee industrial Corp industrials 12 882 364 0.78% 0.78%<br />
Walsin lihwa Corp industrials 43 554 201 0.70% 0.70%<br />
Walsin technology Corp industrials 6 813 522 0.62% 0.62%<br />
Wan Hai lines ltd industrials 19 015 591 0.30% 0.30%<br />
W<strong>at</strong>erland Financial <strong>Holding</strong>s Co ltd Financials 25 951 880 0.53% 0.53%<br />
Wei Chuan Food Corp Consumer Goods 20 391 432 0.63% 0.63%<br />
Wellypower optronics Corp industrials 1 665 397 0.34% 0.34%<br />
Weltrend semiconductor technology 3 100 726 0.47% 0.47%<br />
Winbond electronics Corp technology 15 443 361 0.51% 0.51%<br />
Wintek Corp industrials 47 083 723 0.67% 0.67%<br />
Wistron Corp technology 94 241 038 0.60% 0.60%<br />
Wistron neWeb Corp technology 13 241 822 0.47% 0.47%<br />
WPG <strong>Holding</strong>s ltd technology 69 536 868 0.64% 0.64%<br />
Wt microelectronics Co ltd technology 13 134 116 0.59% 0.59%<br />
Ya Hsin industrial Co ltd industrials 7 0.04% 0.04%<br />
Yageo Corp industrials 21 152 260 0.62% 0.62%<br />
Yang ming marine transport Corp industrials 23 549 783 0.35% 0.35%<br />
Yeun Chyang industrial Co ltd basic m<strong>at</strong>erials 8 946 640 0.76% 0.76%<br />
Yieh Phui enterprise Co ltd basic m<strong>at</strong>erials 14 8<strong>31</strong> 432 0.47% 0.47%<br />
Young Fast optoelectronics Co ltd industrials 8 456 003 0.46% 0.46%<br />
Young optics inc industrials 6 676 398 0.46% 0.46%<br />
Yuanta Financial <strong>Holding</strong> Co ltd Financials 199 457 633 0.65% 0.65%<br />
Yuen Foong Yu Paper manufacturing Co ltd basic m<strong>at</strong>erials 26 830 407 0.68% 0.68%<br />
Yulon motor Co ltd Consumer Goods 77 2<strong>31</strong> 467 0.48% 0.48%<br />
Yung Chi Paint & varnish<br />
manufacturing Co ltd industrials 4 455 230 0.33% 0.33%<br />
Yungshin <strong>Global</strong> <strong>Holding</strong> Corp Health Care 15 353 945 0.75% 0.75%<br />
Yungtay engineering Co ltd industrials 21 714 279 0.59% 0.59%<br />
Zinwell Corp technology 10 888 778 0.53% 0.53%<br />
THAiLANd<br />
airports <strong>of</strong> thailand PCl industrials 2 345 044 0.02% 0.02%<br />
bangchak Petroleum PCl oil & Gas 162 908 330 0.77% 3.<strong>31</strong>%<br />
bangkok bank PCl Financials 526 798 145 0.48% 0.92%<br />
bank <strong>of</strong> ayudhya PCl Financials 44 761 688 0.18% 0.18%<br />
banpu PCl basic m<strong>at</strong>erials 58 949 099 0.06% 0.21%<br />
big C supercenter PCl Consumer services 22 696 538 0.12% 0.12%<br />
bumrungrad Hospital PCl Health Care 8 815 995 0.14% 0.14%<br />
Charoen Pokphand Foods PCl Consumer Goods 4 662 767 0.00% 0.01%<br />
CP all PCl Consumer services 367 568 705 0.79% 0.84%<br />
electricity Gener<strong>at</strong>ing PCl utilities 10 988 180 0.11% 0.11%<br />
GFPt PCl Consumer Goods 84 230 577 0.56% 3.45%<br />
Glow energy PCl utilities 230 154 573 0.52% 1.46%<br />
Home Product Center PCl Consumer services 40 614 278 0.10% 0.33%<br />
Kasikornbank PCl Financials 5 841 <strong>31</strong>6 0.00% 0.01%<br />
Krung thai bank PCl Financials 208 411 036 0.19% 0.66%<br />
land and Houses PCl Consumer Goods 119 879 305 0.33% 1.03%<br />
lPn Development PCl Financials 48 049 969 0.51% 1.35%<br />
mbK PCl Financials 16 361 253 0.00% 0.52%<br />
Precious shipping PCl industrials 90 920 041 0.00% 2.86%<br />
Ptt explor<strong>at</strong>ion & Production PCl oil & Gas 554 666 885 0.49% 0.52%<br />
Ptt PCl oil & Gas 307 530 835 0.18% 0.18%<br />
r<strong>at</strong>chaburi electricity Gener<strong>at</strong>ing <strong>Holding</strong> PCl utilities 11 626 780 0.07% 0.10%<br />
robinson Department store PCl Consumer services 85 584 012 0.37% 0.96%<br />
se educ<strong>at</strong>ion PCl Consumer services 7 938 483 0.00% 1.25%<br />
siam Cement PCl industrials 94 837 499 0.02% 0.13%<br />
siam City Cement PCl industrials 6 025 353 0.05% 0.05%<br />
siam makro PCl Consumer services 39 179 757 0.36% 0.36%<br />
thai airways intern<strong>at</strong>ional PCl Consumer services 5 745 935 0.07% 0.07%<br />
thai union Frozen Products PCl Consumer Goods 127 495 <strong>31</strong>5 1.14% 1.21%<br />
thanachart Capital PCl Financials 176 108 323 1.<strong>31</strong>% 2.61%<br />
tisco Financial Group PCl Financials 10 464 933 0.20% 0.20%<br />
total access Communic<strong>at</strong>ion PCl telecommunic<strong>at</strong>ions 7 177 922 0.02% 0.02%<br />
true Corp PCl telecommunic<strong>at</strong>ions 5 916 253 0.07% 0.07%<br />
TURkEy<br />
adana Cimento sanayii tas industrials 4 592 405 0.13% 0.13%<br />
akbank tas Financials 44 456 226 0.06% 0.06%<br />
voting<br />
ownership<br />
sector<br />
market value<br />
(noK)<br />
akcansa Cimento as industrials 97 981 003 2.36% 2.36%<br />
akfen <strong>Holding</strong> as industrials 114 126 005 3.50% 3.50%<br />
alarko <strong>Holding</strong> as industrials 3 069 574 0.14% 0.14%<br />
albaraka turk K<strong>at</strong>ilim bankasi as Financials 26 283 3<strong>31</strong> 0.98% 0.98%<br />
anadolu Cam sanayii as industrials 59 323 391 2.05% 2.05%<br />
anadolu efes biracilik ve malt sanayii as Consumer Goods 267 281 785 0.82% 0.82%<br />
anadolu Hay<strong>at</strong> emeklilik as Financials 79 918 784 3.07% 3.07%<br />
anel elektrik Proje taahhut ve ticaret as industrials <strong>31</strong> 308 826 4.72% 4.72%<br />
arcelik as Consumer Goods 286 644 490 2.19% 2.19%<br />
asya K<strong>at</strong>ilim bankasi as Financials 52 913 <strong>31</strong>4 1.17% 1.17%<br />
aygaz as utilities 101 566 075 1.21% 1.21%<br />
banvit bandirma vitaminli Yem sanayii asa Consumer Goods 40 740 857 4.65% 4.65%<br />
bim birlesik magazalar as Consumer services 193 858 282 0.77% 0.77%<br />
bizim toptan s<strong>at</strong>is magazalari as Consumer services 118 976 180 5.01% 5.01%<br />
boyner buyuk magazacilik Consumer services 33 205 156 4.90% 4.90%<br />
Celebi Hava servisi as industrials 42 707 587 2.93% 2.93%<br />
Cimsa Cimento sanayi ve tica industrials 25 034 289 0.78% 0.78%<br />
Coca-Cola icecek as Consumer Goods 28 053 725 0.15% 0.15%<br />
Dogus otomotiv servis ve ticaret as Consumer services 16 641 590 0.81% 0.81%<br />
eis eczacibasi ilac ve sinai ve Finansal<br />
Y<strong>at</strong>irimlar sanayi ve ticaret as Health Care 25 025 612 0.80% 0.80%<br />
emlak Konut Gayrimenkul Y<strong>at</strong>irim<br />
ortakligi as Financials 108 <strong>31</strong>3 229 0.70% 0.70%<br />
enka insa<strong>at</strong> ve sanayi as industrials 57 242 235 0.18% 0.18%<br />
eregli Demir ve Celik Fabrikalari tas basic m<strong>at</strong>erials 251 424 398 1.13% 1.13%<br />
Ford otomotiv sanayi as Consumer Goods 194 297 098 1.15% 1.15%<br />
Gubre Fabrikalari tas basic m<strong>at</strong>erials 55 467 747 1.85% 1.85%<br />
Haci omer sabanci <strong>Holding</strong> as Financials 193 597 574 0.52% 0.52%<br />
ihlas <strong>Holding</strong> as industrials 36 341 384 1.89% 1.89%<br />
is Y<strong>at</strong>irim menkul Degerler as Financials 34 019 442 2.98% 2.98%<br />
KoC <strong>Holding</strong> as Financials 273 034 861 0.63% 0.63%<br />
Konya Cimento sanayii as industrials 57 850 889 1.22% 1.22%<br />
Koza altin isletmeleri as basic m<strong>at</strong>erials 10 328 009 0.09% 0.09%<br />
Koza anadolu metal madencilik<br />
isletmeleri as industrials 40 694 801 2.51% 2.51%<br />
Petkim Petrokimya <strong>Holding</strong> as basic m<strong>at</strong>erials 56 747 4<strong>31</strong> 0.91% 0.91%<br />
Pinar sut mamulleri sanayii as Consumer Goods 65 355 662 2.95% 2.95%<br />
reysas Gayrimenkul Y<strong>at</strong>irim ortakligi as Financials 16 485 522 3.99% 3.99%<br />
selcuk ecza Deposu ticaret ve sanayi a.s. Health Care 18 185 591 0.66% 0.66%<br />
tav Havalimanlari <strong>Holding</strong> as industrials 238 287 496 2.58% 2.58%<br />
tekfen <strong>Holding</strong> as Financials 286 067 723 4.58% 4.58%<br />
t<strong>of</strong>as turk otomobil Fabrikasi as Consumer Goods 236 250 797 2.53% 2.53%<br />
torunlar Gayrimenkul Y<strong>at</strong>irim ortakligi as Financials 1 038 261 0.04% 0.04%<br />
trakya Cam sanayi as industrials 114 435 909 2.46% 2.46%<br />
tupras turkiye Petrol rafinerileri as oil & Gas 545 262 324 1.72% 1.72%<br />
turk Hava Yollari Consumer services 393 515 752 4.90% 4.90%<br />
turk telekomunikasyon as telecommunic<strong>at</strong>ions 165 928 260 0.21% 0.21%<br />
turk traktor ve Zira<strong>at</strong> makineleri as industrials 73 976 287 1.30% 1.30%<br />
turkcell iletisim Hizmetleri as telecommunic<strong>at</strong>ions 255 547 582 0.41% 0.41%<br />
turkiye Garanti bankasi as Financials 135 951 232 0.17% 0.17%<br />
turkiye Halk bankasi as Financials 28 467 722 0.07% 0.07%<br />
turkiye is bankasi Financials 452 787 062 0.96% 0.96%<br />
turkiye sinai Kalkinma bankasi as Financials 111 998 822 2.42% 2.42%<br />
turkiye sise ve Cam Fabrikalari as Consumer Goods 220 863 875 1.89% 1.89%<br />
turkiye vakiflar bankasi tao Financials 21 711 408 0.11% 0.11%<br />
ulker biskuvi sanayi as Consumer Goods 88 071 135 1.92% 1.92%<br />
Yapi ve Kredi bankasi as Financials 376 506 152 1.02% 1.02%<br />
Yazicilar <strong>Holding</strong> as Consumer Goods 26 678 827 0.53% 0.53%<br />
UkRAiNE<br />
agroton Public ltd Consumer Goods 28 093 245 4.01% 4.01%<br />
mHP sa Consumer Goods 121 403 656 1.76% 1.76%<br />
Westa intern<strong>at</strong>ional scientific industrial Corp Consumer Goods 3 342 640 1.46% 1.46%<br />
UNiTEd ARAB EmiRATEs<br />
abu Dhabi Commercial bank PJsC Financials 17 090 426 0.07% 0.07%<br />
air arabia PJsC Consumer services 20 518 977 0.46% 0.46%<br />
aramex PJsC industrials 24 721 857 0.58% 0.58%<br />
Dana Gas PJsC utilities 23 899 112 0.50% 0.50%<br />
DP World ltd industrials 18 828 280 0.04% 0.04%<br />
emaar Properties PJsC Financials 65 026 250 0.26% 0.26%<br />
First Gulf bank PJsC Financials 38 969 368 0.10% 0.10%<br />
UNiTEd kiNgdOm<br />
3i Group PlC Financials 363 697 623 2.23% 2.23%<br />
888 <strong>Holding</strong>s PlC Consumer services 166 346 0.01% 0.01%<br />
aberdeen asset management PlC Financials 504 163 478 2.24% 2.24%<br />
admiral Group PlC Financials 298 293 569 1.39% 1.39%<br />
aegis Group PlC Consumer services 606 217 021 3.87% 3.87%<br />
afren PlC oil & Gas 250 872 910 2.94% 2.94%<br />
african barrick Gold PlC basic m<strong>at</strong>erials 179 043 086 1.03% 1.03%<br />
aga rangemaster Group PlC Consumer Goods 8 374 142 1.84% 1.84%<br />
aggreko PlC industrials 1 082 876 673 2.17% 2.17%<br />
albemarle & bond <strong>Holding</strong>s Financials 49 099 256 2.88% 2.88%<br />
alexon Group PlC Consumer services 6 482 4.78% 4.78%<br />
alloc<strong>at</strong>e s<strong>of</strong>tware PlC technology 5 670 848 1.25% 1.25%<br />
ameC PlC oil & Gas 527 911 320 1.89% 1.89%<br />
amlin PlC Financials 257 112 003 1.78% 1.78%<br />
anglesey mining basic m<strong>at</strong>erials 9 815 975 2.19% 2.19%<br />
anglo american PlC basic m<strong>at</strong>erials 7 338 780 922 2.52% 2.52%<br />
anglo Pacific Group PlC basic m<strong>at</strong>erials 434 423 0.02% 0.02%<br />
anite PlC technology <strong>31</strong> 267 289 1.21% 1.21%<br />
ant<strong>of</strong>agasta PlC basic m<strong>at</strong>erials 1 027 164 0<strong>31</strong> 0.92% 0.92%<br />
aquarius Pl<strong>at</strong>inum ltd basic m<strong>at</strong>erials 198 937 774 2.91% 2.91%<br />
Country associ<strong>at</strong>ion according to Ftse (the benchmark provider for <strong>equities</strong>). if a company is not in the benchmark, the country <strong>of</strong> incorpor<strong>at</strong>ion is listed. sector classific<strong>at</strong>ion according to iCb (the industry Classific<strong>at</strong>ion<br />
benchmark company).<br />
voting<br />
ownership<br />
HOLdiNgs<br />
32<br />
<strong>Government</strong> <strong>Pension</strong> FunD <strong>Global</strong> ANNUAL REPORT 2011
<strong>Government</strong> <strong>Pension</strong> <strong>Fund</strong> <strong>Global</strong> <strong>Holding</strong> <strong>of</strong> <strong>equities</strong> <strong>at</strong> <strong>31</strong> December 2011<br />
sector<br />
market value<br />
(noK)<br />
arm <strong>Holding</strong>s PlC technology 1 526 626 548 2.06% 2.06%<br />
ashmore Group PlC Financials 252 012 414 1.15% 1.15%<br />
ashtead Group PlC industrials 259 080 275 2.46% 2.46%<br />
associ<strong>at</strong>ed british Foods PlC Consumer Goods 1 186 970 761 1.46% 1.46%<br />
astraZeneca PlC Health Care 7 911 747 9<strong>31</strong> 2.22% 2.22%<br />
<strong>at</strong>kins Ws PlC industrials 308 780 519 5.14% 5.14%<br />
aurelian oil & Gas PlC oil & Gas 42 009 051 5.47% 5.47%<br />
aveva Group PlC technology 208 460 437 2.<strong>31</strong>% 2.<strong>31</strong>%<br />
aviva PlC Financials 1 412 767 402 1.74% 1.74%<br />
aZ electronic m<strong>at</strong>erials sa basic m<strong>at</strong>erials 76 255 433 0.90% 0.90%<br />
babcock intern<strong>at</strong>ional Group PlC industrials 534 437 308 2.18% 2.18%<br />
balfour be<strong>at</strong>ty PlC industrials 274 871 543 1.63% 1.63%<br />
barclays PlC Financials 5 015 322 749 2.52% 2.52%<br />
barr<strong>at</strong>t Developments PlC Consumer Goods 262 763 551 3.16% 3.16%<br />
bba avi<strong>at</strong>ion PlC industrials 184 573 968 2.34% 2.34%<br />
beazley PlC Financials 154 954 899 2.40% 2.40%<br />
bellway PlC Consumer Goods 186 583 378 2.34% 2.34%<br />
berendsen PlC industrials 155 621 811 2.24% 2.24%<br />
berkeley Group <strong>Holding</strong>s PlC Consumer Goods 338 790 761 2.18% 2.18%<br />
betfair Group PlC Consumer services 68 561 309 0.94% 0.94%<br />
bG Group PlC oil & Gas 9 977 287 595 2.30% 2.30%<br />
bHP billiton PlC basic m<strong>at</strong>erials 10 502 741 075 2.86% 1.13%<br />
big Yellow Group PlC Financials 76 593 340 2.59% 2.59%<br />
bloomsbury Publishing PlC Consumer services 19 198 070 2.85% 2.85%<br />
bodycote PlC industrials 197 770 789 4.24% 4.24%<br />
booker Group PlC Consumer services 342 180 994 3.18% 3.18%<br />
bovis Homes Group PlC Consumer Goods 278 197 862 5.11% 5.11%<br />
bowleven PlC oil & Gas 8 570 046 0.47% 0.47%<br />
bP PlC oil & Gas 17 276 722 970 2.12% 2.13%<br />
brewin Dolphin <strong>Holding</strong>s PlC Financials 113 214 656 3.60% 3.60%<br />
brightside Group PlC Financials 27 871 327 3.74% 3.74%<br />
british land Co PlC Financials 2 018 868 538 5.29% 5.29%<br />
british sky broadcasting Group PlC Consumer services 1 924 547 615 1.63% 1.63%<br />
britvic PlC Consumer Goods 169 402 120 2.35% 2.35%<br />
bt Group PlC telecommunic<strong>at</strong>ions 2 5<strong>31</strong> 257 499 1.84% 1.84%<br />
btG PlC Health Care 288 041 975 3.02% 3.02%<br />
bumi PlC basic m<strong>at</strong>erials 55 418 650 0.38% 0.28%<br />
bunzl PlC industrials 592 432 304 2.19% 2.19%<br />
burberry Group PlC Consumer Goods 1 061 675 598 2.20% 2.20%<br />
bwin.Party Digital entertainment PlC Consumer services 227 381 364 1.79% 1.79%<br />
Cable & Wireless Communic<strong>at</strong>ions PlC telecommunic<strong>at</strong>ions 90 686 414 1.01% 1.01%<br />
Cable & Wireless Worldwide PlC telecommunic<strong>at</strong>ions 103 220 404 2.54% 2.54%<br />
Cairn energy PlC oil & Gas 746 063 334 2.15% 2.15%<br />
Candover investments PlC/united Kingdom Financials 34 778 288 3.76% 3.76%<br />
Cape PlC oil & Gas 84 784 661 2.35% 2.35%<br />
Capita PlC industrials 780 105 412 2.18% 2.18%<br />
Capital & Counties Properties PlC Financials 630 175 734 5.38% 5.38%<br />
Capital shopping Centres Group PlC Financials 443 876 671 1.78% 1.78%<br />
Carillion PlC industrials 279 994 333 2.33% 2.33%<br />
Carnival PlC Consumer services 928 657 300 2.19% 0.57%<br />
Carpetright PlC Consumer services 35 368 607 1.18% 1.18%<br />
Carphone Warehouse Group PlC Consumer services 126 611 367 0.97% 0.97%<br />
C<strong>at</strong>lin Group ltd Financials 63 858 146 0.48% 0.48%<br />
Centamin PlC basic m<strong>at</strong>erials 243 938 864 2.90% 2.90%<br />
Centrica PlC utilities 2 273 949 274 1.64% 1.64%<br />
Ceres Power <strong>Holding</strong>s PlC industrials 1 078 686 1.93% 1.93%<br />
Charles taylor Consulting PlC Financials 14 148 694 2.97% 2.97%<br />
Charter intern<strong>at</strong>ional PlC industrials 337 693 386 2.<strong>31</strong>% 2.<strong>31</strong>%<br />
Chemring Group PlC industrials 171 306 146 2.39% 2.39%<br />
Chesnara PlC Financials 62 221 000 3.32% 3.32%<br />
Cineworld Group PlC Consumer services 23 979 795 0.89% 0.89%<br />
Close brothers Group PlC Financials 248 968 475 2.95% 2.95%<br />
Cls <strong>Holding</strong>s PlC Financials 2 810 539 0.11% 0.11%<br />
Cobham PlC industrials 401 285 003 2.19% 2.19%<br />
Collins stewart Hawkpoint PlC Financials 25 367 6<strong>31</strong> 1.27% 1.27%<br />
Colt Group sa telecommunic<strong>at</strong>ions 37 073 347 0.49% 0.49%<br />
Compass Group PlC Consumer services 2 324 180 198 2.16% 2.16%<br />
Computacenter PlC technology 60 294 923 1.26% 1.26%<br />
Connaught PlC industrials 1 691 1.30% 1.30%<br />
Consort medical PlC Health Care 1 013 597 0.07% 0.07%<br />
Cookson Group PlC industrials 300 869 930 2.<strong>31</strong>% 2.<strong>31</strong>%<br />
Cove energy PlC oil & Gas 48 414 410 0.92% 0.92%<br />
CPP Group PlC Consumer services 69 058 336 3.88% 3.88%<br />
Cranswick PlC Consumer Goods 47 153 368 1.44% 1.44%<br />
CrH PlC industrials 3 054 823 162 3.57% 3.57%<br />
Croda intern<strong>at</strong>ional PlC basic m<strong>at</strong>erials 5<strong>31</strong> 057 363 2.35% 2.35%<br />
Csr PlC technology 229 213 914 6.63% 6.71%<br />
Daejan <strong>Holding</strong>s PlC Financials 501 110 0.01% 0.01%<br />
Daily mail & General trust PlC Consumer services 111 091 890 0.00% 0.78%<br />
Dairy Crest Group PlC Consumer Goods 88 475 813 2.13% 2.13%<br />
Daisy Group PlC telecommunic<strong>at</strong>ions 93 575 113 3.96% 3.96%<br />
Dart Group PlC industrials 32 797 811 3.92% 3.92%<br />
De la rue PlC industrials 252 227 967 3.07% 3.07%<br />
Debenhams PlC Consumer services 188 491 037 2.70% 2.70%<br />
Dechra Pharmaceuticals PlC Health Care 150 632 <strong>31</strong>1 4.69% 4.69%<br />
Delphi automotive PlC Consumer Goods 51 754 086 0.12% 0.12%<br />
Derwent london PlC Financials 338 191 946 2.30% 2.30%<br />
Development securities PlC Financials 18 551 400 1.09% 1.09%<br />
Devro PlC Consumer Goods 61 479 191 1.56% 1.56%<br />
Diageo PlC Consumer Goods 6 624 082 378 2.03% 2.03%<br />
Dignity PlC Consumer services 91 969 029 2.21% 2.21%<br />
voting<br />
ownership<br />
sector<br />
market value<br />
(noK)<br />
Dixons retail PlC Consumer services 136 600 560 4.15% 4.15%<br />
Domino Printing sciences PlC industrials 209 292 710 3.97% 3.97%<br />
Domino’s Pizza uK & irl PlC Consumer services 108 500 598 1.79% 1.79%<br />
Drax Group PlC utilities 410 776 529 2.23% 2.23%<br />
Ds smith PlC industrials 194 272 109 2.43% 2.43%<br />
Dunelm Group PlC Consumer services 42 418 551 0.52% 0.52%<br />
earthport PlC technology 11 514 381 2.60% 2.60%<br />
easyJet PlC Consumer services 256 415 816 1.63% 1.63%<br />
eco animal Health Group PlC Health Care 33 329 174 3.18% 3.18%<br />
electrocomponents PlC industrials 178 035 391 2.33% 2.33%<br />
elementis PlC basic m<strong>at</strong>erials 304 767 850 5.32% 5.32%<br />
enQuest PlC oil & Gas 161 221 566 2.32% 2.32%<br />
enterprise inns PlC Consumer services 35 666 805 2.71% 2.71%<br />
essar energy PlC oil & Gas 136 449 843 0.66% 0.66%<br />
eurasian n<strong>at</strong>ural resources Corp PlC basic m<strong>at</strong>erials 1 297 920 671 1.71% 1.71%<br />
euromoney institutional investor PlC Consumer services 39 508 002 0.56% 0.56%<br />
evraz PlC basic m<strong>at</strong>erials 95 257 340 0.20% 0.20%<br />
experian PlC industrials 1 836 273 015 2.25% 2.25%<br />
F&C asset management PlC Financials 47 371 700 1.47% 1.47%<br />
Fenner PlC industrials 170 306 963 2.37% 2.37%<br />
Ferrexpo PlC basic m<strong>at</strong>erials 139 000 625 0.95% 0.95%<br />
Fidessa Group PlC technology 97 975 039 1.89% 1.89%<br />
Filtrona PlC industrials 179 852 522 2.44% 2.44%<br />
Findel PlC Consumer services 29 037 481 5.13% 5.13%<br />
Firstgroup PlC Consumer services 342 509 492 2.27% 2.27%<br />
Fresnillo PlC basic m<strong>at</strong>erials 443 915 838 0.44% 0.44%<br />
Future PlC Consumer services 3 668 017 1.36% 1.36%<br />
G4s PlC industrials 775 285 811 2.18% 2.18%<br />
Galliford try PlC industrials 61 373 996 1.70% 1.70%<br />
Game Group PlC Consumer services 8 815 119 3.65% 3.65%<br />
Gem Diamonds ltd basic m<strong>at</strong>erials 32 028 054 1.29% 1.29%<br />
Genus PlC Health Care 103 136 710 1.77% 1.77%<br />
GKn PlC Consumer Goods 572 425 714 2.17% 2.17%<br />
GlaxosmithKline PlC Health Care 15 775 105 140 2.25% 2.29%<br />
Glencore intern<strong>at</strong>ional PlC basic m<strong>at</strong>erials 943 799 118 0.37% 0.37%<br />
Go-ahead Group PlC Consumer services 129 391 843 2.35% 2.35%<br />
Grainger PlC Financials 202 865 838 4.91% 4.91%<br />
Gre<strong>at</strong> Portland est<strong>at</strong>es PlC Financials 710 920 582 7.59% 7.59%<br />
Greene King PlC Consumer services 221 677 723 2.26% 2.26%<br />
Greggs PlC Consumer services 97 562 994 2.06% 2.06%<br />
Gulfsands Petroleum PlC oil & Gas 82 469 718 4.08% 4.08%<br />
GW Pharmaceuticals PlC Health Care 21 439 120 1.98% 1.98%<br />
Halfords Group PlC Consumer services 126 743 888 2.49% 2.49%<br />
Halma PlC industrials 442 158 553 3.82% 3.82%<br />
Hammerson PlC Financials 1 104 796 358 4.65% 4.65%<br />
Hansteen <strong>Holding</strong>s PlC Financials 99 791 633 2.20% 2.20%<br />
Hargreaves lansdown PlC Financials 216 347 860 1.14% 1.14%<br />
Hargreaves services PlC industrials 46 221 852 1.70% 1.70%<br />
Hays PlC industrials 197 747 212 2.39% 2.39%<br />
Healthcare locums PlC industrials 9 429 901 3.90% 3.90%<br />
Helical bar PlC Financials 35 818 154 1.76% 1.76%<br />
Helphire PlC Financials 1 121 854 1.85% 1.85%<br />
Henderson Group PlC Financials 240 678 085 2.<strong>31</strong>% 2.<strong>31</strong>%<br />
Heritage oil PlC oil & Gas 84 086 910 1.80% 1.80%<br />
Highland Gold mining ltd basic m<strong>at</strong>erials 52 309 769 0.92% 0.92%<br />
Hikma Pharmaceuticals PlC Health Care 448 889 3<strong>31</strong> 3.97% 3.97%<br />
Hiscox ltd Financials 51 760 959 0.38% 0.38%<br />
Hochschild mining PlC basic m<strong>at</strong>erials 145 268 062 1.20% 1.20%<br />
Home retail Group PlC Consumer services 151 951 974 2.41% 2.41%<br />
Homeserve PlC industrials 232 143 226 2.65% 2.65%<br />
Howden Joinery Group PlC industrials 139 959 484 2.37% 2.37%<br />
HsbC <strong>Holding</strong>s PlC Financials 19 582 604 829 2.41% 2.41%<br />
Hunting PlC oil & Gas 383 105 796 3.76% 3.76%<br />
iCaP PlC Financials 465 857 888 2.24% 2.24%<br />
iG Group <strong>Holding</strong>s PlC Financials 393 547 459 2.45% 2.45%<br />
iGas energy PlC utilities 11 211 2<strong>31</strong> 1.36% 1.36%<br />
imagin<strong>at</strong>ion technologies Group PlC technology 405 211 924 3.05% 3.05%<br />
imi PlC industrials 498 819 708 2.20% 2.20%<br />
immunodiagnostic systems <strong>Holding</strong>s PlC Health Care 29 864 827 2.46% 2.46%<br />
inchcape PlC Consumer services <strong>31</strong>0 780 646 2.48% 2.48%<br />
informa PlC Consumer services 965 538 053 4.79% 4.79%<br />
inmars<strong>at</strong> PlC telecommunic<strong>at</strong>ions 156 058 775 0.93% 0.93%<br />
intercontinental Hotels Group PlC Consumer services 677 900 206 2.17% 2.17%<br />
intermedi<strong>at</strong>e Capital Group PlC Financials 210 262 723 2.48% 2.48%<br />
intern<strong>at</strong>ional Consolid<strong>at</strong>ed airlines Group sa Consumer services 275 047 012 1.09% 1.09%<br />
intern<strong>at</strong>ional Personal Finance PlC Financials 168 493 906 4.12% 4.12%<br />
intern<strong>at</strong>ional Power PlC utilities 916 143 616 0.58% 0.58%<br />
interserve PlC industrials 79 870 523 2.13% 2.13%<br />
intertek Group PlC industrials 652 282 533 2.16% 2.16%<br />
invensys PlC technology 367 517 162 2.<strong>31</strong>% 2.<strong>31</strong>%<br />
investec PlC Financials 678 201 009 3.61% 2.53%<br />
invista Found<strong>at</strong>ion Property trust ltd Financials 10 462 284 0.95% 0.95%<br />
ite Group PlC Consumer services 224 123 695 4.77% 4.77%<br />
itv PlC Consumer services 326 082 444 1.33% 1.33%<br />
J sainsbury PlC Consumer services 858 824 569 1.63% 1.63%<br />
James Fisher & sons PlC industrials 78 591 369 3.33% 3.33%<br />
Jardine lloyd thompson Group PlC Financials 238 396 047 1.71% 1.71%<br />
JD Wetherspoon PlC Consumer services 189 647 058 3.74% 3.74%<br />
JKX oil & Gas PlC oil & Gas 22 072 388 1.02% 1.02%<br />
John Wood Group PlC oil & Gas 552 034 590 2.50% 2.50%<br />
Johnson m<strong>at</strong>they PlC basic m<strong>at</strong>erials 526 819 898 1.44% 1.44%<br />
Country associ<strong>at</strong>ion according to Ftse (the benchmark provider for <strong>equities</strong>). if a company is not in the benchmark, the country <strong>of</strong> incorpor<strong>at</strong>ion is listed. sector classific<strong>at</strong>ion according to iCb (the industry Classific<strong>at</strong>ion<br />
benchmark company).<br />
voting<br />
ownership<br />
HOLdiNgs<br />
33<br />
<strong>Government</strong> <strong>Pension</strong> FunD <strong>Global</strong> ANNUAL REPORT 2011
<strong>Government</strong> <strong>Pension</strong> <strong>Fund</strong> <strong>Global</strong> <strong>Holding</strong> <strong>of</strong> <strong>equities</strong> <strong>at</strong> <strong>31</strong> December 2011<br />
sector<br />
market value<br />
(noK)<br />
Jupiter <strong>Fund</strong> management PlC Financials 63 167 785 0.69% 0.69%<br />
Kazakhmys PlC basic m<strong>at</strong>erials 732 691 787 1.61% 1.61%<br />
Kcom Group PlC telecommunic<strong>at</strong>ions 87 795 074 2.62% 2.62%<br />
Keller Group PlC industrials 41 020 985 2.58% 2.58%<br />
Kenmare resources PlC basic m<strong>at</strong>erials 268 996 382 2.62% 2.62%<br />
Kesa electricals PlC Consumer services 76 379 <strong>31</strong>8 2.<strong>31</strong>% 2.<strong>31</strong>%<br />
Kewill PlC technology 17 916 912 2.76% 2.76%<br />
Kier Group PlC industrials 191 281 073 3.91% 3.91%<br />
Kingfisher PlC Consumer services 1 186 775 530 2.16% 2.16%<br />
K<strong>of</strong>ax PlC technology 25 926 937 1.34% 1.34%<br />
ladbrokes PlC Consumer services 249 379 173 2.28% 2.28%<br />
laird PlC technology 150 607 320 3.95% 3.95%<br />
lamprell PlC oil & Gas 240 955 619 3.71% 3.71%<br />
lancashire <strong>Holding</strong>s ltd Financials 242 775 019 2.29% 2.29%<br />
land securities Group PlC Financials 2 363 349 103 5.16% 5.16%<br />
legal & General Group PlC Financials 529 875 518 0.95% 0.95%<br />
liontrust asset management PlC Financials 6 103 972 2.55% 2.55%<br />
lloyds banking Group PlC Financials 2 263 383 422 1.37% 1.37%<br />
lms Capital PlC/<strong>Fund</strong> Financials 30 627 580 2.18% 2.18%<br />
logica PlC technology 211 232 739 2.29% 2.29%<br />
london & stamford Property PlC Financials 54 326 166 0.99% 0.99%<br />
london Capital Group <strong>Holding</strong>s PlC Financials 8 458 609 2.26% 2.26%<br />
london mining PlC basic m<strong>at</strong>erials 112 748 998 3.60% 3.60%<br />
london stock exchange Group PlC Financials 339 604 559 1.70% 1.70%<br />
lonmin PlC basic m<strong>at</strong>erials 433 960 667 2.36% 2.36%<br />
lonrho PlC Financials 4 940 466 0.44% 0.44%<br />
low & bonar PlC industrials 25 969 415 2.43% 2.43%<br />
luminar Group <strong>Holding</strong>s PlC Consumer services 191 776 2.90% 2.90%<br />
man Group PlC Financials 455 778 416 2.07% 2.07%<br />
manganese bronze Hldgs PlC industrials 801 342 0.89% 0.89%<br />
mapeley ltd Financials 61 0.22% 0.22%<br />
marks & spencer Group PlC Consumer services 1 019 103 872 2.23% 2.23%<br />
marshalls PlC industrials 12 927 594 0.78% 0.78%<br />
marston’s PlC Consumer services 118 268 199 2.44% 2.44%<br />
mcbride PlC Consumer Goods 28 603 960 1.54% 1.54%<br />
mears Group PlC industrials 45 786 687 2.62% 2.62%<br />
mecom Group PlC Consumer services 64 979 162 3.03% 3.03%<br />
meggitt PlC industrials 552 260 320 2.17% 2.17%<br />
melrose PlC industrials 281 783 822 2.29% 2.29%<br />
melrose resources PlC oil & Gas 5 984 504 0.48% 0.48%<br />
michael Page intern<strong>at</strong>ional PlC industrials 284 006 955 2.89% 2.89%<br />
micro Focus intern<strong>at</strong>ional PlC technology 252 477 058 3.79% 3.79%<br />
microgen PlC technology 28 770 402 2.95% 2.95%<br />
millennium & Copthorne Hotels PlC Consumer services 327 423 168 2.73% 2.73%<br />
misys PlC technology 172 091 936 2.39% 2.39%<br />
mitchells & butlers PlC Consumer services 173 512 361 1.95% 1.95%<br />
mitie Group PlC industrials 186 037 051 2.29% 2.29%<br />
mondi PlC basic m<strong>at</strong>erials 429 273 969 2.77% 2.09%<br />
moneysupermarket.com Group PlC Consumer services 56 793 241 1.15% 1.15%<br />
monitise PlC telecommunic<strong>at</strong>ions 180 858 426 8.07% 8.07%<br />
morgan Crucible Co PlC industrials 197 815 508 2.97% 2.97%<br />
morgan sindall Group PlC industrials 22 768 024 0.96% 0.96%<br />
mothercare PlC Consumer services 44 033 179 3.22% 3.22%<br />
mouchel Group PlC industrials 1 641 165 2.90% 2.90%<br />
mucklow a & J Group PlC Financials 3 673 076 0.23% 0.23%<br />
n brown Group PlC Consumer services 79 143 408 1.29% 1.29%<br />
n<strong>at</strong>ional express Group PlC Consumer services 306 403 224 2.90% 2.90%<br />
n<strong>at</strong>ional Grid PlC utilities 4 220 335 147 2.05% 2.05%<br />
netplay tv PlC Consumer services 4 691 885 2.04% 2.04%<br />
new World resources PlC basic m<strong>at</strong>erials 84 438 848 0.78% 0.78%<br />
next PlC Consumer services 957 499 439 2.20% 2.20%<br />
northern rock asset management PlC Financials 3 280 0.84% 0.84%<br />
novae Group PlC Financials 49 972 574 2.47% 2.47%<br />
oakley Capital investments ltd Financials 32 959 275 2.09% 2.09%<br />
ocado Group PlC Consumer services 26 329 866 0.93% 0.93%<br />
old mutual PlC Financials 1 085 033 987 1.45% 1.45%<br />
oxford instruments PlC industrials 68 679 327 1.41% 1.41%<br />
Pace PlC technology 117 793 520 5.78% 5.78%<br />
Paragon Group <strong>of</strong> Cos PlC Financials 147 635 2<strong>31</strong> 2.91% 2.91%<br />
P<strong>at</strong>agonia Gold PlC Consumer services 24 165 045 0.83% 0.83%<br />
Pearson PlC Consumer services 1 566 105 660 1.71% 1.71%<br />
Pendragon PlC Consumer services 34 <strong>31</strong>0 273 3.43% 3.43%<br />
Pennon Group PlC utilities 664 793 604 2.78% 2.78%<br />
Persimmon PlC Consumer Goods 309 028 642 2.35% 2.35%<br />
Petr<strong>of</strong>ac ltd oil & Gas 546 391 543 1.18% 1.18%<br />
Petropavlovsk PlC basic m<strong>at</strong>erials 261 753 320 2.44% 2.44%<br />
Phoenix Group <strong>Holding</strong>s Financials 24 237 791 0.29% 0.29%<br />
Photo-me intern<strong>at</strong>ional PlC Consumer Goods 72 334 554 4.42% 4.42%<br />
Premier Farnell PlC industrials 243 386 349 3.94% 3.94%<br />
Premier Foods PlC Consumer Goods 51 633 496 4.00% 4.00%<br />
Premier oil PlC oil & Gas 484 465 374 3.07% 3.07%<br />
Produce investments PlC Consumer Goods 11 105 705 3.90% 3.90%<br />
Promethean World PlC technology 39 675 991 3.89% 3.89%<br />
Provident Financial PlC Financials 284 163 059 2.38% 2.38%<br />
Prudential PlC Financials 6 854 355 308 4.54% 4.54%<br />
Psion PlC technology 12 207 944 2.13% 2.13%<br />
Punch taverns PlC Consumer services 16 220 703 2.63% 2.63%<br />
Pursuit Dynamics PlC industrials 17 926 869 3.92% 3.92%<br />
Pv Crystalox solar PlC oil & Gas 6 203 115 3.67% 3.67%<br />
PZ Cussons PlC Consumer Goods 95 715 830 0.69% 0.69%<br />
QinetiQ Group PlC industrials 247 480 295 3.05% 3.05%<br />
voting<br />
ownership<br />
sector<br />
market value<br />
(noK)<br />
Quintain est<strong>at</strong>es & Development PlC Financials 42 014 804 2.30% 2.30%<br />
randgold resources ltd basic m<strong>at</strong>erials 704 577 411 1.26% 1.26%<br />
rank Group PlC Consumer services 904 604 0.02% 0.02%<br />
r<strong>at</strong>hbone brothers PlC Financials 104 188 449 2.44% 2.44%<br />
reckitt benckiser Group PlC Consumer Goods 5 199 0<strong>31</strong> 194 2.42% 2.42%<br />
record PlC Financials 6 086 890 2.28% 2.28%<br />
redrow PlC Consumer Goods 172 996 682 5.33% 5.33%<br />
reed elsevier PlC Consumer services 1 117 125 362 1.91% 1.91%<br />
regus PlC industrials 229 589 679 3.11% 3.11%<br />
reneuron Group PlC Health Care 10 055 033 3.95% 3.95%<br />
renishaw PlC industrials 89 398 082 1.32% 1.32%<br />
rentokil initial PlC industrials 248 <strong>31</strong>6 638 2.35% 2.35%<br />
resolution ltd Financials 321 153 3<strong>31</strong> 1.00% 1.00%<br />
restaurant Group PlC Consumer services 124 145 828 2.24% 2.24%<br />
rexam PlC industrials 642 418 683 2.24% 2.24%<br />
rightmove PlC Consumer services 282 5<strong>31</strong> 360 2.27% 2.27%<br />
rm PlC technology 29 449 749 5.81% 5.81%<br />
robert Walters PlC industrials 1 722 695 0.15% 0.15%<br />
robert Wiseman Dairies PlC Consumer Goods 13 421 164 0.80% 0.80%<br />
rolls-royce <strong>Holding</strong>s PlC industrials 3 087 181 <strong>31</strong>4 2.36% 2.36%<br />
rotork PlC industrials 479 229 159 3.09% 3.09%<br />
royal bank <strong>of</strong> scotland Group PlC Financials 592 338 <strong>31</strong>1 0.53% 0.29%<br />
royal Dutch shell PlC oil & Gas 30 983 249 392 2.20% 2.20%<br />
rPC Group PlC industrials 37 182 026 0.69% 0.69%<br />
rPs Group PlC industrials 59 926 438 1.65% 1.65%<br />
rsa insurance Group PlC Financials 237 225 287 0.69% 0.69%<br />
sable mining africa ltd oil & Gas 12 466 620 1.30% 1.30%<br />
sabmiller PlC Consumer Goods 5 008 963 885 1.50% 1.50%<br />
safestore <strong>Holding</strong>s PlC Financials 51 273 197 2.94% 2.94%<br />
sage Group PlC/the technology 787 994 053 2.20% 2.20%<br />
salamander energy PlC oil & Gas 56 958 519 1.96% 1.96%<br />
savills PlC Financials 60 204 561 1.49% 1.49%<br />
schroders PlC Financials 594 204 263 1.68% 1.82%<br />
sDl PlC technology 113 861 712 2.33% 2.33%<br />
segro PlC Financials 332 321 561 2.32% 2.32%<br />
senior PlC industrials 187 659 628 2.94% 2.94%<br />
severfield-rowen PlC industrials 18 790 019 1.36% 1.36%<br />
severn trent PlC utilities 792 869 535 2.41% 2.41%<br />
shaftesbury PlC Financials 744 210 991 6.84% 6.84%<br />
shanks Group PlC industrials 145 442 178 4.35% 4.35%<br />
shire PlC Health Care 2 545 420 827 2.09% 2.18%<br />
siG PlC industrials 175 537 685 3.81% 3.81%<br />
sinclair is Pharma PlC Health Care 43 324 635 5.51% 5.51%<br />
smith & nephew PlC Health Care 1 127 <strong>31</strong>5 409 2.18% 2.18%<br />
smiths Group PlC industrials 736 596 235 2.21% 2.21%<br />
smiths news PlC industrials 5 375 781 0.39% 0.39%<br />
soco intern<strong>at</strong>ional PlC oil & Gas 208 486 761 2.27% 2.27%<br />
spectris PlC industrials <strong>31</strong>9 171 355 2.29% 2.29%<br />
speedy Hire PlC industrials 40 409 591 4.21% 4.21%<br />
spirax-sarco engineering PlC industrials 372 180 159 2.76% 2.76%<br />
spirent Communic<strong>at</strong>ions PlC technology 140 873 920 1.94% 1.94%<br />
spirit Pub Co PlC Consumer services 125 189 <strong>31</strong>8 4.79% 4.79%<br />
sportingbet PlC Consumer services 56 867 747 2.95% 2.95%<br />
sports Direct intern<strong>at</strong>ional PlC Consumer services 294 349 765 2.58% 2.58%<br />
sse PlC utilities 1 719 550 999 1.53% 1.53%<br />
st James’s Place PlC Financials 140 670 758 0.95% 0.95%<br />
st modwen Properties PlC Financials 43 916 770 2.09% 2.09%<br />
stagecoach Group PlC Consumer services 329 916 179 2.27% 2.27%<br />
standard Chartered PlC Financials 6 259 333 788 2.01% 2.01%<br />
standard life PlC Financials 272 346 356 0.60% 0.60%<br />
sthree PlC industrials 34 <strong>31</strong>5 404 1.37% 1.37%<br />
stobart Group ltd industrials 51 743 156 1.33% 1.33%<br />
superGroup PlC Consumer Goods 48 556 728 1.29% 1.29%<br />
svG Capital PlC Financials 57 039 965 0.98% 0.98%<br />
synergy Health PlC Health Care 75 275 428 1.73% 1.73%<br />
talktalk telecom Group PlC telecommunic<strong>at</strong>ions 292 946 651 2.55% 2.55%<br />
talvivaara mining Co PlC basic m<strong>at</strong>erials 84 051 626 1.84% 1.84%<br />
t<strong>at</strong>e & lyle PlC Consumer Goods 526 890 095 1.73% 1.73%<br />
taylor Wimpey PlC Consumer Goods 255 841 568 2.30% 2.30%<br />
ted baker PlC Consumer services 60 678 234 2.43% 2.43%<br />
telecity Group PlC technology 1 025 016 575 8.59% 8.59%<br />
telecom Plus PlC telecommunic<strong>at</strong>ions 143 388 270 2.86% 2.86%<br />
tesCo PlC Consumer services 6 423 430 357 2.14% 2.14%<br />
third advance value realis<strong>at</strong>ion Co ltd Financials 108 0.16% 0.16%<br />
thomas Cook Group PlC Consumer services 39 180 793 3.27% 3.27%<br />
travis Perkins PlC industrials 443 052 249 2.46% 2.46%<br />
tt electronics PlC industrials 49 073 618 2.53% 2.53%<br />
tui travel PlC Consumer services 187 049 280 1.09% 1.09%<br />
tullett Prebon PlC Financials 147 000 672 2.73% 2.73%<br />
tullow oil PlC oil & Gas 2 560 907 098 2.18% 2.18%<br />
ubm PlC Consumer services 157 443 233 1.45% 1.45%<br />
uK mail Group PlC industrials 19 174 906 1.78% 1.78%<br />
ultra electronics <strong>Holding</strong>s PlC industrials 356 865 275 3.78% 3.78%<br />
unilever PlC Consumer Goods 5 566 015 740 2.12% 0.92%<br />
unite Group PlC Financials 64 086 434 2.57% 2.57%<br />
united utilities Group PlC utilities 1 088 228 992 2.84% 2.84%<br />
victrex PlC basic m<strong>at</strong>erials 332 508 437 3.89% 3.89%<br />
vodafone Group PlC telecommunic<strong>at</strong>ions 18 857 644 027 2.27% 2.27%<br />
W<strong>at</strong>erlogic PlC industrials 29 753 750 2.39% 2.39%<br />
Weir Group PlC/the industrials 865 411 051 2.17% 2.17%<br />
WH smith PlC Consumer services 156 799 222 2.<strong>31</strong>% 2.<strong>31</strong>%<br />
Country associ<strong>at</strong>ion according to Ftse (the benchmark provider for <strong>equities</strong>). if a company is not in the benchmark, the country <strong>of</strong> incorpor<strong>at</strong>ion is listed. sector classific<strong>at</strong>ion according to iCb (the industry Classific<strong>at</strong>ion<br />
benchmark company).<br />
voting<br />
ownership<br />
HOLdiNgs<br />
34<br />
<strong>Government</strong> <strong>Pension</strong> FunD <strong>Global</strong> ANNUAL REPORT 2011
<strong>Government</strong> <strong>Pension</strong> <strong>Fund</strong> <strong>Global</strong> <strong>Holding</strong> <strong>of</strong> <strong>equities</strong> <strong>at</strong> <strong>31</strong> December 2011<br />
sector<br />
market value<br />
(noK)<br />
Whitbread PlC Consumer services 553 742 083 2.15% 2.15%<br />
William Hill PlC Consumer services 424 823 155 3.22% 3.22%<br />
Wincanton PlC industrials 25 023 885 3.55% 3.55%<br />
Wm morrison supermarkets PlC Consumer services 2 002 132 940 2.60% 2.60%<br />
Wolfson microelectronics PlC technology 65 195 740 4.61% 4.61%<br />
Wolseley PlC industrials 1 217 546 821 2.16% 2.16%<br />
Workspace Group PlC Financials 68 624 046 2.27% 2.27%<br />
WPP PlC Consumer services 1 656 453 236 2.10% 2.10%<br />
WsP Group PlC industrials 15 068 195 1.24% 1.24%<br />
Xchanging PlC industrials 18 086 047 1.26% 1.26%<br />
Xstr<strong>at</strong>a PlC basic m<strong>at</strong>erials 4 402 512 998 1.64% 1.64%<br />
Yell Group PlC Consumer services 54 105 377 4.66% 4.66%<br />
Yule C<strong>at</strong>to & Co PlC basic m<strong>at</strong>erials 104 <strong>31</strong>9 035 2.01% 2.01%<br />
UNiTEd sTATEs<br />
1st source Corp Financials 21 085 995 0.58% 0.58%<br />
3m Co industrials 2 <strong>31</strong>5 414 956 0.68% 0.68%<br />
99 Cents only stores Consumer services 47 545 705 0.51% 0.51%<br />
a schulman inc basic m<strong>at</strong>erials 25 062 068 0.67% 0.67%<br />
a123 systems inc industrials 8 830 100 0.73% 0.73%<br />
aaon inc industrials 14 820 491 0.49% 0.49%<br />
aar Corp industrials 30 411 297 0.66% 0.66%<br />
aaron’s inc Consumer services 84 756 691 0.70% 0.70%<br />
abaxis inc Health Care 23 771 086 0.66% 0.66%<br />
abbott labor<strong>at</strong>ories Health Care 3 515 7<strong>31</strong> 793 0.67% 0.67%<br />
abercrombie & Fitch Co Consumer services 174 365 690 0.70% 0.70%<br />
abiomeD inc Health Care 32 635 876 0.77% 0.77%<br />
abitibibow<strong>at</strong>er inc basic m<strong>at</strong>erials 40 973 076 0.49% 0.49%<br />
abm industries inc industrials 43 714 664 0.67% 0.67%<br />
abovenet inc telecommunic<strong>at</strong>ions 66 541 449 0.66% 0.66%<br />
acacia research - acacia technologies industrials 57 463 656 0.61% 0.61%<br />
acadia realty trust Financials 32 379 320 0.63% 0.63%<br />
accenture PlC industrials 1 506 402 064 0.74% 0.67%<br />
aCCo brands Corp Consumer Goods 23 824 762 0.75% 0.75%<br />
accretive Health inc Health Care 33 741 550 0.25% 0.25%<br />
accuray inc Health Care 13 181 404 0.74% 0.74%<br />
aCe ltd Financials 235 151 920 0.17% 0.17%<br />
aCi Worldwide inc technology 38 724 279 0.68% 0.68%<br />
acme Packet inc technology 83 325 352 0.67% 0.67%<br />
acorda therapeutics inc Health Care 39 427 790 0.70% 0.70%<br />
active Power inc industrials 892 586 0.28% 0.28%<br />
activision blizzard inc Consumer Goods 288 395 613 0.34% 0.34%<br />
actuant Corp industrials 64 320 125 0.69% 0.69%<br />
acuity brands inc industrials 126 620 175 0.95% 0.95%<br />
acxiom Corp Consumer services 38 876 382 0.68% 0.68%<br />
aDa-es inc industrials 7 466 691 0.55% 0.55%<br />
adecoagro sa Consumer Goods 14 540 362 0.25% 0.25%<br />
adobe systems inc technology 623 666 625 0.75% 0.75%<br />
aDtran inc technology 77 715 918 0.68% 0.68%<br />
advance america Cash advance Centers inc Financials 19 596 645 0.59% 0.59%<br />
advance auto Parts inc Consumer services 207 482 049 0.69% 0.69%<br />
advanced energy industries inc technology 16 365 579 0.59% 0.59%<br />
advanced micro Devices inc technology 151 848 428 0.68% 0.68%<br />
advent s<strong>of</strong>tware inc technology 49 596 135 0.67% 0.67%<br />
advisory board Co/the industrials 49 937 111 0.69% 0.69%<br />
aeCom technology Corp industrials 125 551 328 0.89% 0.89%<br />
aegean marine Petroleum network inc industrials 5 379 866 0.46% 0.46%<br />
aegion Corp industrials 25 419 682 0.70% 0.70%<br />
aerCap <strong>Holding</strong>s nv industrials 48 119 996 0.51% 0.51%<br />
aeropostale inc Consumer services 52 399 083 0.71% 0.71%<br />
aerovironment inc industrials 34 566 <strong>31</strong>0 0.83% 0.83%<br />
aes Corp/the utilities 173 651 710 0.32% 0.32%<br />
aetna inc Health Care 618 868 504 0.68% 0.68%<br />
affili<strong>at</strong>ed managers Group inc Financials 216 651 449 0.74% 0.74%<br />
affymetrix inc Health Care 12 199 356 0.71% 0.71%<br />
aflac inc Financials 4 492 600 518 3.73% 3.73%<br />
aGCo Corp industrials 193 884 357 0.78% 0.78%<br />
agilent technologies inc industrials 488 878 214 0.67% 0.67%<br />
aGl resources inc utilities 202 289 041 0.69% 0.69%<br />
air lease Corp industrials 45 794 666 0.33% 0.32%<br />
air methods Corp Health Care 40 124 929 0.63% 0.63%<br />
air Products & Chemicals inc basic m<strong>at</strong>erials 845 570 678 0.79% 0.79%<br />
aircastle ltd industrials 28 069 417 0.51% 0.51%<br />
airgas inc basic m<strong>at</strong>erials 179 223 814 0.51% 0.51%<br />
aK steel <strong>Holding</strong> Corp basic m<strong>at</strong>erials 68 207 643 1.25% 1.25%<br />
akamai technologies inc technology 247 667 657 0.72% 0.72%<br />
akorn inc Health Care <strong>31</strong> 814 380 0.51% 0.51%<br />
alaska air Group inc Consumer services 106 972 571 0.67% 0.67%<br />
alaska Communic<strong>at</strong>ions systems Group inc telecommunic<strong>at</strong>ions 4 922 115 0.61% 0.61%<br />
albany intern<strong>at</strong>ional Corp industrials 25 991 105 0.<strong>31</strong>% 0.60%<br />
albemarle Corp basic m<strong>at</strong>erials 183 719 977 0.67% 0.67%<br />
alcoa inc basic m<strong>at</strong>erials 416 191 940 0.76% 0.76%<br />
alere inc Health Care 81 247 411 0.69% 0.69%<br />
alexander & baldwin inc industrials 76 546 700 0.75% 0.75%<br />
alexander’s inc Financials 29 938 202 0.27% 0.27%<br />
alexandria real est<strong>at</strong>e <strong>equities</strong> inc Financials 171 053 388 0.67% 0.67%<br />
alexion Pharmaceuticals inc Health Care 546 994 116 0.69% 0.69%<br />
align technology inc Health Care 334 379 448 3.01% 3.01%<br />
alkermes Plc Health Care 65 595 487 0.49% 0.49%<br />
alleghany Corp Financials 76 952 252 0.53% 0.53%<br />
allegheny technologies inc basic m<strong>at</strong>erials 246 159 192 0.81% 0.81%<br />
allegiant travel Co Consumer services 32 006 217 0.53% 0.53%<br />
voting<br />
ownership<br />
sector<br />
market value<br />
(noK)<br />
allergan inc/united st<strong>at</strong>es Health Care 1 093 625 738 0.68% 0.68%<br />
allete inc utilities 60 586 267 0.66% 0.66%<br />
alliance D<strong>at</strong>a systems Corp industrials 212 <strong>31</strong>2 687 0.69% 0.69%<br />
alliant energy Corp utilities 197 864 850 0.68% 0.68%<br />
allied nevada Gold Corp basic m<strong>at</strong>erials 109 373 356 0.68% 0.68%<br />
allied World assurance Co <strong>Holding</strong>s aG Financials 99 197 104 0.69% 0.69%<br />
allos therapeutics inc Health Care 156 600 0.02% 0.02%<br />
allscripts Healthcare solutions inc technology 165 213 628 0.77% 0.77%<br />
allst<strong>at</strong>e Corp/the Financials 267 225 936 0.32% 0.32%<br />
alnylam Pharmaceuticals inc Health Care 13 671 830 0.66% 0.66%<br />
alpha n<strong>at</strong>ural resources inc basic m<strong>at</strong>erials 249 521 057 0.93% 0.93%<br />
altera Corp technology 512 834 024 0.72% 0.72%<br />
alterra Capital <strong>Holding</strong>s ltd Financials 98 229 756 0.67% 0.67%<br />
altisource Portfolio solutions sa Financials 52 834 001 0.74% 0.74%<br />
am Castle & Co industrials 6 155 994 0.47% 0.47%<br />
amaG Pharmaceuticals inc Health Care 16 235 393 0.68% 0.68%<br />
amazon.com inc Consumer services 2 472 989 439 0.53% 0.53%<br />
ambac Financial Group inc Financials 3 824 0.01% 0.01%<br />
amC networks inc Consumer services 49 758 000 0.11% 0.<strong>31</strong>%<br />
amCol intern<strong>at</strong>ional Corp basic m<strong>at</strong>erials 27 195 040 0.54% 0.54%<br />
amdocs ltd technology 223 699 390 0.75% 0.75%<br />
amedisys inc Health Care 12 744 567 0.66% 0.66%<br />
amerco inc Consumer services 35 006 166 0.34% 0.34%<br />
ameren Corp utilities 133 098 345 0.28% 0.28%<br />
ameresco inc industrials 34 841 449 0.37% 0.98%<br />
american axle & manufacturing <strong>Holding</strong>s inc Consumer Goods 29 147 046 0.66% 0.66%<br />
american Campus Communities inc Financials 117 299 730 0.66% 0.66%<br />
american Capital agency Corp Financials 249 643 644 0.66% 0.66%<br />
american eagle outfitters inc Consumer services 118 568 732 0.67% 0.67%<br />
american electric Power Co inc utilities 708 722 751 0.60% 0.60%<br />
american equity investment life <strong>Holding</strong> Co Financials 22 291 248 0.60% 0.60%<br />
american express Co Financials 1 802 357 949 0.55% 0.55%<br />
american Financial Group inc/oH Financials 79 053 558 0.36% 0.36%<br />
american Greetings Corp Consumer Goods 17 797 599 0.37% 0.60%<br />
american intern<strong>at</strong>ional Group inc Financials 321 145 974 0.12% 0.12%<br />
american n<strong>at</strong>ional insurance Co Financials 46 863 194 0.40% 0.40%<br />
american Public educ<strong>at</strong>ion inc Consumer services 30 833 712 0.67% 0.67%<br />
american railcar industries inc industrials 12 791 193 0.42% 0.42%<br />
american reprographics Co industrials 196 160 0.02% 0.02%<br />
american science & engineering inc industrials 27 133 564 0.75% 0.75%<br />
american st<strong>at</strong>es W<strong>at</strong>er Co utilities 64 584 955 1.66% 1.66%<br />
american superconductor Corp industrials 7 303 575 0.64% 0.64%<br />
american tower Corp telecommunic<strong>at</strong>ions 124 667 020 0.09% 0.09%<br />
american W<strong>at</strong>er Works Co inc utilities 63 842 744 0.19% 0.19%<br />
american Woodmark Corp industrials 3 168 197 0.27% 0.27%<br />
ameriGrouP Corp Health Care 114 071 601 0.68% 0.68%<br />
ameriprise Financial inc Financials 454 406 0<strong>31</strong> 0.68% 0.68%<br />
amerisourcebergen Corp Consumer services 154 856 047 0.27% 0.27%<br />
ameristar Casinos inc Consumer services 23 835 520 0.71% 0.71%<br />
ameteK inc industrials 249 021 348 0.62% 0.62%<br />
amgen inc Health Care 700 251 199 0.21% 0.21%<br />
amkor technology inc technology 27 908 162 0.59% 0.59%<br />
amphenol Corp industrials 287 506 769 0.64% 0.64%<br />
amr Corp Consumer services 4 808 373 0.69% 0.69%<br />
amsurg Corp Health Care 36 287 6<strong>31</strong> 0.75% 0.75%<br />
amtrust Financial services inc Financials <strong>31</strong> 010 468 0.36% 0.36%<br />
amylin Pharmaceuticals inc Health Care 71 709 154 0.72% 0.72%<br />
amyris inc oil & Gas 22 707 244 0.72% 0.72%<br />
anadarko Petroleum Corp oil & Gas 2 208 560 478 0.97% 0.97%<br />
analog Devices inc technology 423 <strong>31</strong>5 790 0.67% 0.67%<br />
analogic Corp Health Care 26 352 698 0.63% 0.63%<br />
ancestry.com inc Consumer services 32 748 082 0.54% 0.54%<br />
andersons inc/the Consumer Goods 33 535 725 0.70% 0.70%<br />
anixter intern<strong>at</strong>ional inc industrials 80 140 514 0.68% 0.68%<br />
ann inC Consumer services 50 972 686 0.66% 0.66%<br />
annaly Capital management inc Financials 626 215 812 0.68% 0.68%<br />
ansYs inc technology 213 811 909 0.68% 0.68%<br />
anworth mortgage asset Corp Financials 36 047 338 0.72% 0.72%<br />
ao smith Corp industrials 153 517 278 0.58% 1.39%<br />
aol inc technology 59 800 737 0.68% 0.68%<br />
aon Corp Financials 720 891 051 0.80% 0.80%<br />
apache Corp oil & Gas 1 721 950 989 0.83% 0.83%<br />
apartment investment & management Co Financials 113 699 754 0.69% 0.69%<br />
apco oil and Gas intern<strong>at</strong>ional inc oil & Gas 12 648 522 0.09% 0.09%<br />
apogee enterprises inc industrials 11 825 774 0.57% 0.57%<br />
apollo Group inc Consumer services 283 533 125 0.00% 0.68%<br />
apple inc technology 16 027 369 145 0.71% 0.71%<br />
applied industrial technologies inc industrials 59 244 762 0.67% 0.67%<br />
applied m<strong>at</strong>erials inc technology 470 897 092 0.56% 0.56%<br />
applied micro Circuits Corp technology 18 515 262 0.76% 0.76%<br />
aptargroup inc industrials 144 694 290 0.70% 0.70%<br />
aqua america inc utilities 86 167 686 0.47% 0.47%<br />
arbitron inc Consumer services 36 526 878 0.65% 0.65%<br />
arch Capital Group ltd Financials 203 897 029 0.68% 0.68%<br />
arch Coal inc basic m<strong>at</strong>erials 322 632 710 1.76% 1.76%<br />
archer-Daniels-midland Co Consumer Goods 772 396 356 0.68% 0.68%<br />
arcos Dorados <strong>Holding</strong>s inc Consumer services 107 425 709 0.17% 0.42%<br />
argo Group intern<strong>at</strong>ional <strong>Holding</strong>s ltd Financials 37 960 956 0.70% 0.70%<br />
ariad Pharmaceuticals inc Health Care 244 451 730 2.12% 2.12%<br />
ariba inc technology 111 636 793 0.67% 0.67%<br />
arkansas best Corp industrials 18 096 892 0.62% 0.62%<br />
Country associ<strong>at</strong>ion according to Ftse (the benchmark provider for <strong>equities</strong>). if a company is not in the benchmark, the country <strong>of</strong> incorpor<strong>at</strong>ion is listed. sector classific<strong>at</strong>ion according to iCb (the industry Classific<strong>at</strong>ion<br />
benchmark company).<br />
voting<br />
ownership<br />
HOLdiNgs<br />
35<br />
<strong>Government</strong> <strong>Pension</strong> FunD <strong>Global</strong> ANNUAL REPORT 2011
<strong>Government</strong> <strong>Pension</strong> <strong>Fund</strong> <strong>Global</strong> <strong>Holding</strong> <strong>of</strong> <strong>equities</strong> <strong>at</strong> <strong>31</strong> December 2011<br />
sector<br />
market value<br />
(noK)<br />
armstrong World industries inc industrials 42 082 668 0.28% 0.28%<br />
arris Group inc technology 51 934 690 0.68% 0.68%<br />
arrow electronics inc industrials 172 730 122 0.69% 0.69%<br />
arrow Financial Corp Financials 14 225 706 0.86% 0.86%<br />
arthrocare Corp Health Care 34 158 122 0.66% 0.66%<br />
arthur J Gallagher & Co Financials 150 794 766 0.67% 0.67%<br />
artio <strong>Global</strong> investors inc Financials 88 826 968 5.15% 5.15%<br />
aruba networks inc technology 77 811 273 0.66% 0.66%<br />
asbury automotive Group inc Consumer services 32 661 339 0.80% 0.80%<br />
ascena retail Group inc Consumer services 95 788 546 0.70% 0.70%<br />
ascent Capital Group inc Consumer services 28 603 715 0.70% 0.66%<br />
ashford Hospitality trust inc Financials 23 514 773 0.72% 0.72%<br />
ashland inc basic m<strong>at</strong>erials 178 785 537 0.67% 0.67%<br />
asiainfo-linkage inc technology 36 712 772 1.10% 1.10%<br />
aspen insurance <strong>Holding</strong>s ltd Financials 549 461 941 4.92% 4.92%<br />
aspen technology inc technology 41 426 685 0.43% 0.43%<br />
associ<strong>at</strong>ed banc-Corp Financials 76 254 130 0.66% 0.66%<br />
assurant inc Financials 152 612 440 0.68% 0.68%<br />
assured Guaranty ltd Financials 96 683 479 0.68% 0.68%<br />
astec industries inc industrials 27 <strong>31</strong>9 396 0.63% 0.63%<br />
astoria Financial Corp Financials 34 278 503 0.69% 0.69%<br />
<strong>at</strong>&t inc telecommunic<strong>at</strong>ions 6 724 184 033 0.63% 0.63%<br />
<strong>at</strong>henahealth inc technology 67 183 719 0.65% 0.65%<br />
<strong>at</strong>lantic tele-network inc telecommunic<strong>at</strong>ions 7 767 039 0.22% 0.22%<br />
<strong>at</strong>las air Worldwide <strong>Holding</strong>s inc industrials 40 485 483 0.67% 0.67%<br />
<strong>at</strong>mel Corp technology 176 769 126 0.79% 0.79%<br />
<strong>at</strong>mi inc technology 28 478 862 0.75% 0.75%<br />
<strong>at</strong>mos energy Corp utilities 120 252 023 0.67% 0.67%<br />
<strong>at</strong>P oil & Gas Corp/united st<strong>at</strong>es oil & Gas 12 192 543 0.54% 0.54%<br />
<strong>at</strong>wood oceanics inc oil & Gas 142 878 491 0.93% 0.93%<br />
autodesk inc technology 303 938 7<strong>31</strong> 0.74% 0.74%<br />
autoliv inc Consumer Goods <strong>31</strong>2 210 418 0.67% 1.09%<br />
autom<strong>at</strong>ic D<strong>at</strong>a Processing inc industrials 1 067 262 839 0.68% 0.68%<br />
auton<strong>at</strong>ion inc Consumer services 156 560 563 0.51% 0.51%<br />
autoZone inc Consumer services 178 078 080 0.23% 0.23%<br />
auxilium Pharmaceuticals inc Health Care 39 984 478 0.70% 0.70%<br />
avago technologies ltd technology 361 803 464 0.86% 0.86%<br />
avalonbay Communities inc Financials 520 008 833 0.70% 0.70%<br />
avery Dennison Corp basic m<strong>at</strong>erials 126 845 391 0.70% 0.70%<br />
avid technology inc Consumer services 13 263 056 0.67% 0.67%<br />
avis budget Group inc Consumer services 44 193 122 0.66% 0.66%<br />
avista Corp utilities 57 934 291 0.65% 0.65%<br />
avnet inc industrials 185 789 967 0.67% 0.67%<br />
avon Products inc Consumer Goods 299 490 643 0.67% 0.67%<br />
avX Corp industrials 35 991 419 0.28% 0.28%<br />
axis Capital <strong>Holding</strong>s ltd Financials 171 013 040 0.69% 0.69%<br />
aZZ inc industrials 21 <strong>31</strong>3 408 0.63% 0.63%<br />
b&G Foods inc Consumer Goods 37 700 564 0.55% 0.55%<br />
babcock & Wilcox Co/the industrials 187 565 263 1.10% 1.10%<br />
badger meter inc industrials 24 102 634 0.91% 0.91%<br />
baker Hughes inc oil & Gas 1 196 480 589 0.94% 0.94%<br />
balchem Corp basic m<strong>at</strong>erials 46 677 134 0.67% 0.67%<br />
baldwin & lyons inc Financials 7 611 447 0.00% 0.39%<br />
ball Corp industrials 234 029 797 0.68% 0.68%<br />
bally technologies inc Consumer services 68 696 663 0.67% 0.67%<br />
bancfirst Corp Financials 7 303 825 0.22% 0.22%<br />
bancorpsouth inc Financials 38 198 612 0.70% 0.70%<br />
bank <strong>of</strong> america Corp Financials 1 940 280 787 0.58% 0.58%<br />
bank <strong>of</strong> Hawaii Corp Financials 84 126 814 0.68% 0.68%<br />
bank <strong>of</strong> new York mellon Corp/the Financials 636 537 390 0.44% 0.44%<br />
bank <strong>of</strong> the ozarks inc Financials 32 140 332 0.53% 0.53%<br />
bankunited inc Financials 17 780 404 0.14% 0.14%<br />
barnes & noble inc Consumer services 26 115 408 0.50% 0.50%<br />
barnes Group inc industrials 43 260 572 0.55% 0.55%<br />
basic energy services inc oil & Gas 32 623 997 0.65% 0.65%<br />
baxter intern<strong>at</strong>ional inc Health Care 1 260 585 104 0.76% 0.76%<br />
bb&t Corp Financials 515 597 243 0.49% 0.49%<br />
be aerospace inc industrials 157 216 057 0.66% 0.66%<br />
beacon ro<strong>of</strong>ing supply inc Consumer services 40 742 699 0.73% 0.73%<br />
beam inc industrials <strong>31</strong>7 867 320 0.67% 0.67%<br />
bebe stores inc Consumer services 15 564 551 0.37% 0.37%<br />
becton Dickinson and Co Health Care 649 214 507 0.68% 0.68%<br />
bed b<strong>at</strong>h & beyond inc Consumer services 298 817 811 0.35% 0.35%<br />
belden inc industrials 62 <strong>31</strong>2 961 0.67% 0.67%<br />
belo Corp Consumer services 25 <strong>31</strong>8 250 0.34% 0.65%<br />
bemis Co inc industrials 125 142 354 0.68% 0.68%<br />
benchmark electronics inc industrials 32 934 197 0.71% 0.71%<br />
beneficial mutual bancorp inc Financials 10 <strong>31</strong>0 644 0.26% 0.26%<br />
berkshire H<strong>at</strong>haway inc Financials 5 563 580 697 0.51% 0.46%<br />
berry Petroleum Co oil & Gas 88 523 713 0.66% 0.66%<br />
best buy Co inc Consumer services 209 891 848 0.42% 0.42%<br />
bGC Partners inc Financials 24 102 695 0.15% 0.26%<br />
big lots inc Consumer services 103 002 432 0.70% 0.70%<br />
biglari <strong>Holding</strong>s inc Consumer services 22 330 199 0.71% 0.71%<br />
bill barrett Corp oil & Gas 67 583 196 0.70% 0.70%<br />
biogen idec inc Health Care 1 511 975 934 0.95% 0.95%<br />
biomarin Pharmaceutical inc Health Care 288 666 945 1.23% 1.23%<br />
biomed realty trust inc Financials 111 990 830 0.67% 0.67%<br />
bio-rad labor<strong>at</strong>ories inc Health Care 65 711 868 0.15% 0.41%<br />
bio-reference labs inc Health Care 17 141 292 0.63% 0.63%<br />
bJ’s restaurants inc Consumer services 51 611 689 0.69% 0.69%<br />
voting<br />
ownership<br />
sector<br />
market value<br />
(noK)<br />
black box Corp industrials 18 141 640 0.61% 0.61%<br />
black Hills Corp utilities 56 454 341 0.71% 0.71%<br />
blackbaud inc technology 51 732 143 0.70% 0.70%<br />
blackrock inc Financials 10 920 927 6<strong>31</strong> 7.38% 5.74%<br />
blount intern<strong>at</strong>ional inc Consumer Goods 29 674 793 0.70% 0.70%<br />
blue Co<strong>at</strong> systems inc technology 41 786 568 0.64% 0.64%<br />
blue nile inc Consumer services 24 548 729 0.74% 0.74%<br />
blyth inc Consumer Goods 13 840 196 0.50% 0.50%<br />
bmC s<strong>of</strong>tware inc technology 225 581 240 0.68% 0.68%<br />
bob evans Farms inc/De Consumer services 38 675 689 0.66% 0.66%<br />
boise inc basic m<strong>at</strong>erials 61 783 083 1.37% 1.37%<br />
boK Financial Corp Financials 43 656 050 0.20% 0.20%<br />
bonanza Creek energy inc oil & Gas 7 459 938 0.25% 0.25%<br />
borgWarner inc Consumer Goods <strong>31</strong>5 854 010 0.76% 0.76%<br />
boston Priv<strong>at</strong>e Financial <strong>Holding</strong>s inc Financials 26 057 110 0.70% 0.70%<br />
boston Properties inc Financials 593 821 139 0.68% 0.68%<br />
boston scientific Corp Health Care 332 735 970 0.70% 0.70%<br />
bottomline technologies inc technology 30 212 921 0.61% 0.61%<br />
boyd Gaming Corp Consumer services 19 330 087 0.50% 0.50%<br />
bPZ resources inc oil & Gas 11 520 203 0.59% 0.59%<br />
brady Corp industrials 59 850 873 0.00% 0.60%<br />
brandywine realty trust Financials 50 592 479 0.66% 0.66%<br />
bre Properties inc Financials 152 212 082 0.67% 0.67%<br />
bridgepoint educ<strong>at</strong>ion inc Consumer services 20 765 536 0.29% 0.29%<br />
briggs & str<strong>at</strong>ton Corp Consumer Goods <strong>31</strong> 865 475 0.69% 0.69%<br />
brightpoint inc technology 28 205 024 0.64% 0.64%<br />
brinker intern<strong>at</strong>ional inc Consumer services 88 358 036 0.69% 0.69%<br />
brink’s Co/the industrials 52 012 810 0.69% 0.69%<br />
bristol-myers squibb Co Health Care 2 413 332 581 0.68% 0.68%<br />
bristow Group inc oil & Gas 87 852 451 0.86% 0.86%<br />
broadcom Corp technology 753 967 934 0.42% 0.80%<br />
broadridge Financial solutions inc industrials 115 330 838 0.69% 0.69%<br />
broads<strong>of</strong>t inc technology 32 <strong>31</strong>0 207 0.66% 0.66%<br />
broadwind energy inc industrials 1 421 866 0.25% 0.25%<br />
brocade Communic<strong>at</strong>ions systems inc technology 99 430 994 0.71% 0.71%<br />
brookdale senior living inc Health Care 64 033 792 0.51% 0.51%<br />
brookline bancorp inc Financials 20 716 572 0.69% 0.69%<br />
brooks autom<strong>at</strong>ion inc technology 27 108 635 0.67% 0.67%<br />
brown & brown inc Financials 128 442 430 0.66% 0.66%<br />
brown shoe Co inc Consumer services 13 379 341 0.60% 0.60%<br />
brown-Forman Corp Consumer Goods 285 835 905 0.00% 0.41%<br />
bruker Corp Health Care 33 274 154 0.27% 0.27%<br />
brunswick Corp/De Consumer Goods 67 895 351 0.71% 0.71%<br />
buckeye technologies inc basic m<strong>at</strong>erials 49 521 264 0.63% 0.63%<br />
buckle inc/the Consumer services 39 286 115 0.34% 0.34%<br />
buffalo Wild Wings inc Consumer services 38 693 355 0.52% 0.52%<br />
bunge ltd Consumer Goods 335 264 468 0.67% 0.67%<br />
Ca inc technology 870 047 246 1.46% 1.46%<br />
Cabela’s inc Consumer services 50 466 585 0.48% 0.48%<br />
Cablevision systems Corp Consumer services 78 447 409 0.12% 0.32%<br />
Cabot Corp basic m<strong>at</strong>erials 88 088 894 0.72% 0.72%<br />
Cabot microelectronics Corp technology 44 086 199 0.68% 0.68%<br />
Cabot oil & Gas Corp oil & Gas 374 113 480 0.79% 0.79%<br />
CaCi intern<strong>at</strong>ional inc technology 59 895 457 0.68% 0.68%<br />
Cadence Design systems inc technology 114 990 504 0.68% 0.68%<br />
Cadence Pharmaceuticals inc Health Care 7 637 830 0.39% 0.39%<br />
Cadiz inc utilities 44 366 854 5.03% 5.03%<br />
Cal Dive intern<strong>at</strong>ional inc oil & Gas 2 7<strong>31</strong> 971 0.21% 0.21%<br />
Calamos asset management inc Financials 7 756 777 0.52% 0.52%<br />
Calgon Carbon Corp basic m<strong>at</strong>erials 48 106 739 0.91% 0.91%<br />
California W<strong>at</strong>er service Group utilities 63 785 220 1.40% 1.40%<br />
Callaway Golf Co Consumer Goods 13 703 209 0.64% 0.64%<br />
Cal-maine Foods inc Consumer Goods 21 436 530 0.22% 0.41%<br />
Calpine Corp utilities 544 511 693 1.15% 1.15%<br />
Camden Property trust Financials 180 235 615 0.68% 0.68%<br />
Cameron intern<strong>at</strong>ional Corp oil & Gas 484 493 906 0.67% 0.67%<br />
Campbell soup Co Consumer Goods 324 387 795 0.51% 0.51%<br />
Canadian solar inc oil & Gas 145 444 0.02% 0.02%<br />
Capella educ<strong>at</strong>ion Co Consumer services 17 183 169 0.55% 0.55%<br />
CapGen Capital Group ii lP Financials 24 922 906 0.62% 0.62%<br />
Capital one Financial Corp Financials 736 553 175 0.63% 0.63%<br />
Capitalsource inc Financials 73 034 286 0.66% 0.66%<br />
Capitol Federal Financial inc Financials 76 490 418 0.66% 0.66%<br />
Capstead mortgage Corp Financials 41 300 434 0.65% 0.65%<br />
Carbo Ceramics inc oil & Gas 85 045 743 0.50% 0.50%<br />
Cardinal Health inc Consumer services 567 592 098 0.68% 0.68%<br />
Cardtronics inc industrials 41 197 925 0.58% 0.58%<br />
Career educ<strong>at</strong>ion Corp Consumer services 23 550 546 0.65% 0.65%<br />
CareFusion Corp Health Care 232 912 643 0.68% 0.68%<br />
Carlisle Cos inc industrials 111 685 294 0.69% 0.69%<br />
Carmax inc Consumer services 362 725 182 0.88% 0.88%<br />
Carnival Corp Consumer services 605 743 151 0.52% 0.38%<br />
Carpenter technology Corp basic m<strong>at</strong>erials 91 608 018 0.67% 0.67%<br />
Carrizo oil & Gas inc oil & Gas 156 869 735 2.53% 2.53%<br />
Carter’s inc Consumer Goods 91 839 <strong>31</strong>8 0.66% 0.66%<br />
Cascade Corp industrials 19 038 963 0.61% 0.61%<br />
Casey’s General stores inc Consumer services 76 803 705 0.66% 0.66%<br />
Cash america intern<strong>at</strong>ional inc Financials 57 746 469 0.71% 0.71%<br />
C<strong>at</strong>alyst Health solutions inc Health Care 109 364 593 0.70% 0.70%<br />
C<strong>at</strong>erpillar inc industrials 2 359 289 244 0.67% 0.67%<br />
C<strong>at</strong>hay General bancorp Financials 48 494 913 0.69% 0.69%<br />
Country associ<strong>at</strong>ion according to Ftse (the benchmark provider for <strong>equities</strong>). if a company is not in the benchmark, the country <strong>of</strong> incorpor<strong>at</strong>ion is listed. sector classific<strong>at</strong>ion according to iCb (the industry Classific<strong>at</strong>ion<br />
benchmark company).<br />
voting<br />
ownership<br />
HOLdiNgs<br />
36<br />
<strong>Government</strong> <strong>Pension</strong> FunD <strong>Global</strong> ANNUAL REPORT 2011
<strong>Government</strong> <strong>Pension</strong> <strong>Fund</strong> <strong>Global</strong> <strong>Holding</strong> <strong>of</strong> <strong>equities</strong> <strong>at</strong> <strong>31</strong> December 2011<br />
sector<br />
market value<br />
(noK)<br />
C<strong>at</strong>o Corp/the Consumer services 25 457 543 0.39% 0.60%<br />
Cavium inc technology 55 222 450 0.66% 0.66%<br />
Cbeyond inc telecommunic<strong>at</strong>ions 6 246 359 0.43% 0.43%<br />
CbiZ inc industrials 12 386 661 0.68% 0.68%<br />
Cbl & associ<strong>at</strong>es Properties inc Financials 94 691 219 0.68% 0.68%<br />
Cboe <strong>Holding</strong>s inc Financials 63 675 350 0.46% 0.46%<br />
Cbre Group inc Financials 200 906 382 0.67% 0.67%<br />
Cbs Corp Consumer services 444 608 259 0.00% 0.41%<br />
CDi Corp industrials 11 222 117 0.71% 0.71%<br />
CeC entertainment inc Consumer services 29 893 846 0.77% 0.77%<br />
Cedar realty trust inc Financials 11 605 088 0.66% 0.66%<br />
Celanese Corp basic m<strong>at</strong>erials 280 647 668 0.68% 0.68%<br />
Celgene Corp Health Care 1 290 608 927 0.72% 0.72%<br />
Cell therapeutics inc Health Care 12 594 129 0.94% 0.94%<br />
Centene Corp Health Care 82 903 290 0.70% 0.70%<br />
CenterPoint energy inc utilities 115 225 802 0.23% 0.23%<br />
Central european Distribution Corp Consumer Goods 13 802 022 0.73% 0.73%<br />
Central european media enterprises ltd Consumer services 11 270 620 0.22% 0.45%<br />
Central Garden and Pet Co Consumer Goods 17 353 198 0.16% 0.70%<br />
Central vermont Public service Corp utilities 20 0<strong>31</strong> 470 0.71% 0.71%<br />
Century aluminum Co basic m<strong>at</strong>erials 23 525 113 0.52% 0.52%<br />
Centurylink inc telecommunic<strong>at</strong>ions 36 112 445 0.03% 0.03%<br />
Cenveo inc industrials 3 099 435 0.24% 0.24%<br />
Cepheid inc Health Care 90 615 079 0.69% 0.69%<br />
Ceradyne inc industrials 28 309 378 0.73% 0.73%<br />
Cerner Corp technology 418 225 432 0.68% 0.68%<br />
CF industries <strong>Holding</strong>s inc basic m<strong>at</strong>erials 423 940 135 0.75% 0.75%<br />
CH energy Group inc utilities 38 307 909 0.74% 0.74%<br />
CH robinson Worldwide inc industrials 482 765 518 0.71% 0.71%<br />
Charles river labor<strong>at</strong>ories intern<strong>at</strong>ional inc Health Care 57 277 747 0.71% 0.71%<br />
Charles schwab Corp/the Financials 486 123 721 0.57% 0.57%<br />
Charming shoppes inc Consumer services 22 508 800 0.66% 0.66%<br />
Chart industries inc oil & Gas 55 141 087 0.58% 0.58%<br />
Charter Communic<strong>at</strong>ions inc Consumer services 196 109 <strong>31</strong>8 0.54% 0.54%<br />
Check Point s<strong>of</strong>tware technologies ltd technology 444 870 563 0.68% 0.68%<br />
Checkpoint systems inc industrials 18 138 759 0.69% 0.69%<br />
Cheesecake Factory inc/the Consumer services 70 902 921 0.73% 0.73%<br />
Chemed Corp Consumer services 41 047 039 0.68% 0.68%<br />
Chemical Financial Corp Financials 22 780 076 0.65% 0.65%<br />
Chemtura Corp basic m<strong>at</strong>erials 120 185 911 1.81% 1.81%<br />
Chesapeake energy Corp oil & Gas 481 039 213 0.55% 0.55%<br />
Chevron Corp oil & Gas 8 302 219 000 0.66% 0.66%<br />
Chico’s Fas inc Consumer services 78 423 835 0.70% 0.70%<br />
Childrens Place retail stores inc/the Consumer services 54 086 356 0.69% 0.69%<br />
Chimera investment Corp Financials 104 153 172 0.68% 0.68%<br />
China Yuchai intern<strong>at</strong>ional ltd industrials 18 973 646 0.62% 0.62%<br />
Chipotle mexican Grill inc Consumer services 453 279 661 0.72% 0.72%<br />
Chiquita brands intern<strong>at</strong>ional inc Consumer Goods 16 1<strong>31</strong> 433 0.71% 0.71%<br />
Choice Hotels intern<strong>at</strong>ional inc Consumer services 46 293 539 0.34% 0.34%<br />
Christopher & banks Corp Consumer services 101 190 0.02% 0.02%<br />
Chubb Corp/the Financials 194 674 908 0.17% 0.17%<br />
Church & Dwight Co inc Consumer Goods 265 040 414 0.68% 0.68%<br />
Churchill Downs inc Consumer services 27 353 968 0.51% 0.51%<br />
Ciber inc technology 11 581 793 0.70% 0.70%<br />
Ciena Corp technology 45 862 759 0.65% 0.65%<br />
Cigna Corp Health Care 496 440 853 0.69% 0.69%<br />
Cimarex energy Co oil & Gas 389 763 544 1.23% 1.23%<br />
Cincinn<strong>at</strong>i bell inc telecommunic<strong>at</strong>ions 23 218 067 0.66% 0.66%<br />
Cincinn<strong>at</strong>i Financial Corp Financials 200 878 868 0.68% 0.68%<br />
Cinemark <strong>Holding</strong>s inc Consumer services 96 861 289 0.71% 0.71%<br />
Cintas Corp industrials 183 302 595 0.68% 0.68%<br />
CirCor intern<strong>at</strong>ional inc industrials 20 327 485 0.56% 0.56%<br />
Cirrus logic inc technology 44 697 845 0.74% 0.74%<br />
Cisco systems inc technology 4 106 910 849 0.71% 0.71%<br />
Cit Group inc Financials 279 944 365 0.67% 0.67%<br />
Citigroup inc Financials 4 453 344 175 0.97% 0.97%<br />
Citizens inc/tX Financials 16 089 421 0.56% 0.56%<br />
Citrix systems inc technology 460 443 179 0.68% 0.68%<br />
City <strong>Holding</strong> Co Financials 18 145 404 0.61% 0.61%<br />
City n<strong>at</strong>ional Corp/Ca Financials 95 327 467 0.68% 0.68%<br />
ClarCor inc industrials 3 071 985 0.02% 0.02%<br />
Clayton Williams energy inc oil & Gas 20 870 861 0.38% 0.38%<br />
Clean energy Fuels Corp Consumer services 38 118 463 0.73% 0.73%<br />
Clear Channel outdoor <strong>Holding</strong>s inc Consumer services 19 875 397 0.00% 0.07%<br />
Clearw<strong>at</strong>er Paper Corp basic m<strong>at</strong>erials 36 249 102 0.75% 0.75%<br />
Clearwire Corp technology 23 579 383 0.03% 0.18%<br />
Cleco Corp utilities 91 334 919 0.66% 0.66%<br />
Cliffs n<strong>at</strong>ural resources inc basic m<strong>at</strong>erials 423 350 1<strong>31</strong> 0.80% 0.80%<br />
Clorox Co/the Consumer Goods 354 940 773 0.68% 0.68%<br />
Cloud Peak energy inc basic m<strong>at</strong>erials 47 189 387 0.67% 0.67%<br />
Cme Group inc Financials 862 441 277 0.89% 0.89%<br />
Cms energy Corp utilities 949 898 937 2.84% 2.84%<br />
Cna Financial Corp Financials 27 690 978 0.06% 0.06%<br />
CnH <strong>Global</strong> nv industrials 38 178 519 0.07% 0.07%<br />
Cno Financial Group inc Financials 62 844 746 0.69% 0.69%<br />
Coach inc Consumer Goods 715 971 135 0.67% 0.67%<br />
Cobalt intern<strong>at</strong>ional energy inc oil & Gas 98 737 064 0.27% 0.27%<br />
Coca-Cola Co/the Consumer Goods 6 473 781 890 0.68% 0.68%<br />
Coca-Cola enterprises inc Consumer Goods 325 068 667 0.68% 0.68%<br />
Codexis inc basic m<strong>at</strong>erials 16 254 094 1.43% 1.43%<br />
Coeur d’alene mines Corp basic m<strong>at</strong>erials 85 640 508 0.66% 0.66%<br />
voting<br />
ownership<br />
sector<br />
market value<br />
(noK)<br />
Cogent Communic<strong>at</strong>ions Group inc technology 28 213 146 0.61% 0.61%<br />
Cognex Corp industrials 60 <strong>31</strong>9 712 0.67% 0.67%<br />
Cognizant technology solutions Corp technology 786 857 907 0.68% 0.68%<br />
Cogo Group inc technology 61 876 0.02% 0.02%<br />
Cohen & steers inc Financials 16 812 052 0.23% 0.23%<br />
Coherent inc industrials 52 682 789 0.72% 0.72%<br />
Cohu inc technology 9 385 668 0.57% 0.57%<br />
Coinstar inc industrials 56 167 727 0.67% 0.67%<br />
Coldw<strong>at</strong>er Creek inc Consumer services 98 281 0.01% 0.01%<br />
Colfax Corp industrials 34 601 416 0.47% 0.47%<br />
Colg<strong>at</strong>e-Palmolive Co Consumer Goods 1 807 184 046 0.68% 0.68%<br />
Collective brands inc Consumer services 36 292 195 0.70% 0.70%<br />
Colonial Properties trust Financials 77 218 802 0.71% 0.71%<br />
Columbia banking system inc Financials 29 242 119 0.64% 0.64%<br />
Columbia sportswear Co Consumer Goods 24 881 324 0.27% 0.27%<br />
Comcast Corp Consumer services 3 547 185 389 0.66% 0.92%<br />
Comerica inc Financials 54 655 373 0.18% 0.18%<br />
Comfort systems usa inc industrials 15 <strong>31</strong>0 454 0.64% 0.64%<br />
Commerce bancshares inc/mo Financials 138 297 099 0.68% 0.68%<br />
Commercial metals Co basic m<strong>at</strong>erials 65 162 598 0.68% 0.68%<br />
CommonWealth reit Financials 56 045 020 0.67% 0.67%<br />
Community bank system inc Financials 44 210 935 0.72% 0.72%<br />
Community Health systems inc Health Care 68 162 085 0.71% 0.71%<br />
Community trust bancorp inc Financials 20 938 270 0.77% 0.77%<br />
Commvault systems inc technology 75 796 880 0.68% 0.68%<br />
Compass minerals intern<strong>at</strong>ional inc basic m<strong>at</strong>erials 90 430 232 0.67% 0.67%<br />
Complete Production services inc oil & Gas 96 755 592 0.61% 0.61%<br />
Computer Programs & systems inc technology 20 570 069 0.61% 0.61%<br />
Computer sciences Corp technology 148 002 967 0.67% 0.67%<br />
Compuware Corp technology 72 322 1<strong>31</strong> 0.67% 0.67%<br />
comscore inc Consumer services 24 127 087 0.58% 0.58%<br />
Comstock resources inc oil & Gas 47 927 606 1.10% 1.10%<br />
Comtech telecommunic<strong>at</strong>ions Corp technology 28 716 892 0.83% 0.83%<br />
Comverse technology inc technology 56 758 669 0.66% 0.66%<br />
Conagra Foods inc Consumer Goods 446 084 034 0.69% 0.69%<br />
Conceptus inc Health Care 17 635 017 0.75% 0.75%<br />
Concho resources inc oil & Gas 391 737 357 0.68% 0.68%<br />
Concur technologies inc technology 109 243 752 0.67% 0.67%<br />
ConmeD Corp Health Care 28 900 207 0.68% 0.68%<br />
ConocoPhillips oil & Gas 3 677 608 307 0.64% 0.64%<br />
Consol energy inc basic m<strong>at</strong>erials 391 533 891 0.79% 0.79%<br />
Consolid<strong>at</strong>ed Communic<strong>at</strong>ions <strong>Holding</strong>s inc telecommunic<strong>at</strong>ions 15 694 146 0.46% 0.46%<br />
Consolid<strong>at</strong>ed edison inc utilities 101 755 769 0.09% 0.09%<br />
Consolid<strong>at</strong>ed Graphics inc industrials 21 800 114 0.73% 0.73%<br />
Constant Contact inc Consumer services 24 487 988 0.59% 0.59%<br />
Constell<strong>at</strong>ion brands inc Consumer Goods 149 542 752 0.28% 0.57%<br />
Constell<strong>at</strong>ion energy Group inc utilities 927 694 562 1.94% 1.94%<br />
Contango oil & Gas Co oil & Gas 34 630 910 0.65% 0.65%<br />
Continental resources inc/oK oil & Gas 146 865 593 0.20% 0.20%<br />
Convergys Corp industrials 59 936 760 0.65% 0.65%<br />
Con-way inc industrials 63 478 7<strong>31</strong> 0.66% 0.66%<br />
Cooper Cos inc/the Health Care 132 944 571 0.66% 0.66%<br />
Cooper industries PlC industrials 371 754 536 0.73% 0.73%<br />
Cooper tire & rubber Co Consumer Goods 34 323 645 0.66% 0.66%<br />
Copa <strong>Holding</strong>s sa Consumer services 79 456 135 0.00% 0.52%<br />
Copano energy llC oil & Gas 1 391 580 0.01% 0.01%<br />
Copart inc Consumer services 128 159 020 0.69% 0.69%<br />
Core labor<strong>at</strong>ories nv oil & Gas 248 556 148 0.78% 0.78%<br />
Corelogic inc/united st<strong>at</strong>es industrials 56 874 746 0.69% 0.69%<br />
Corinthian Colleges inc Consumer services 2 265 047 0.21% 0.21%<br />
Corn Products intern<strong>at</strong>ional inc Consumer Goods 160 437 394 0.67% 0.67%<br />
Corning inc technology 704 085 010 0.58% 0.58%<br />
Corpor<strong>at</strong>e executive board Co/the industrials 53 184 833 0.70% 0.70%<br />
Corpor<strong>at</strong>e <strong>of</strong>fice Properties trust Financials 62 091 223 0.68% 0.68%<br />
Corrections Corp <strong>of</strong> america industrials 86 281 428 0.71% 0.71%<br />
Corvel Corp Health Care 18 402 287 0.52% 0.52%<br />
Costar Group inc industrials 69 467 620 0.69% 0.69%<br />
Costco Wholesale Corp Consumer services 1 248 974 126 0.58% 0.58%<br />
Cousins Properties inc Financials 26 832 284 0.68% 0.68%<br />
Covance inc Health Care 111 720 619 0.67% 0.67%<br />
Covanta <strong>Holding</strong> Corp utilities 81 042 233 0.73% 0.73%<br />
Coventry Health Care inc Health Care 179 503 774 0.69% 0.69%<br />
Covidien PlC Health Care 1 152 654 582 0.89% 0.89%<br />
Cr bard inc Health Care 299 385 709 0.68% 0.68%<br />
Cracker barrel old Country store inc Consumer services 48 919 700 0.71% 0.71%<br />
Crane Co industrials 108 404 776 0.67% 0.67%<br />
Credit acceptance Corp Financials 29 898 622 0.24% 0.24%<br />
Cree inc technology 278 0<strong>31</strong> 684 1.82% 1.82%<br />
Crocs inc Consumer Goods 53 320 156 0.67% 0.67%<br />
Crosstex energy inc oil & Gas 16 243 017 0.46% 0.46%<br />
Crown Castle intern<strong>at</strong>ional Corp telecommunic<strong>at</strong>ions 144 346 702 0.19% 0.19%<br />
Crown <strong>Holding</strong>s inc industrials 202 236 854 0.67% 0.67%<br />
CsG systems intern<strong>at</strong>ional inc technology 18 119 643 0.61% 0.61%<br />
CsX Corp industrials 1 140 140 914 0.86% 0.86%<br />
CtC media inc Consumer services 24 381 773 0.30% 0.30%<br />
Cts Corp industrials 10 349 619 0.55% 0.55%<br />
Cubesmart Financials 51 309 659 0.66% 0.66%<br />
Cubic Corp industrials 32 840 185 0.47% 0.47%<br />
Cubist Pharmaceuticals inc Health Care 97 525 295 0.67% 0.67%<br />
Cullen/Frost bankers inc Financials 133 917 191 0.69% 0.69%<br />
Cummins inc industrials 681 844 352 0.67% 0.67%<br />
Country associ<strong>at</strong>ion according to Ftse (the benchmark provider for <strong>equities</strong>). if a company is not in the benchmark, the country <strong>of</strong> incorpor<strong>at</strong>ion is listed. sector classific<strong>at</strong>ion according to iCb (the industry Classific<strong>at</strong>ion<br />
benchmark company).<br />
voting<br />
ownership<br />
HOLdiNgs<br />
37<br />
<strong>Government</strong> <strong>Pension</strong> FunD <strong>Global</strong> ANNUAL REPORT 2011
<strong>Government</strong> <strong>Pension</strong> <strong>Fund</strong> <strong>Global</strong> <strong>Holding</strong> <strong>of</strong> <strong>equities</strong> <strong>at</strong> <strong>31</strong> December 2011<br />
sector<br />
market value<br />
(noK)<br />
Curtiss-Wright Corp industrials 64 047 933 0.65% 0.65%<br />
Cvb Financial Corp Financials 40 485 263 0.65% 0.65%<br />
Cvr energy inc oil & Gas 64 941 101 0.67% 0.67%<br />
Cvs Caremark Corp Consumer services 2 267 421 800 0.72% 0.72%<br />
Cyberonics inc Health Care 37 897 834 0.69% 0.69%<br />
Cymer inc technology 65 323 730 0.72% 0.72%<br />
Cypress semiconductor Corp technology 105 378 665 0.68% 0.68%<br />
CYs investments inc Financials 43 713 419 0.67% 0.67%<br />
Cytec industries inc basic m<strong>at</strong>erials 251 349 252 1.90% 1.90%<br />
Daktronics inc industrials 13 509 975 0.57% 0.57%<br />
Dana <strong>Holding</strong> Corp Consumer Goods 71 821 379 0.67% 0.67%<br />
Danaher Corp industrials 1 376 780 0<strong>31</strong> 0.71% 0.71%<br />
Darden restaurants inc Consumer services 241 961 <strong>31</strong>6 0.67% 0.67%<br />
Darling intern<strong>at</strong>ional inc Consumer Goods 123 564 636 1.33% 1.33%<br />
Davita inc Health Care 288 845 070 0.68% 0.68%<br />
DCt industrial trust inc Financials 50 496 320 0.67% 0.67%<br />
DDr Corp Financials 136 375 880 0.68% 0.68%<br />
Dealertrack <strong>Holding</strong>s inc technology 33 071 851 0.49% 0.49%<br />
Dean Foods Co Consumer Goods 82 862 503 0.67% 0.67%<br />
Deckers outdoor Corp Consumer Goods 119 784 613 0.69% 0.69%<br />
Deere & Co industrials 1 241 132 042 0.67% 0.67%<br />
Delek us <strong>Holding</strong>s inc oil & Gas 6 643 894 0.17% 0.17%<br />
Dell inc technology 1 063 578 347 0.68% 0.68%<br />
Delphi Financial Group inc Financials 86 043 060 0.<strong>31</strong>% 0.60%<br />
Delta air lines inc Consumer services 277 835 626 0.68% 0.68%<br />
Deltek inc technology 7 199 657 0.18% 0.18%<br />
Deltic timber Corp basic m<strong>at</strong>erials 33 481 218 0.74% 0.74%<br />
Deluxe Corp industrials 48 265 481 0.70% 0.70%<br />
Denbury resources inc oil & Gas 449 773 957 1.27% 1.27%<br />
Dendreon Corp Health Care 129 072 579 1.91% 1.91%<br />
DentsPlY intern<strong>at</strong>ional inc Health Care 244 868 800 0.83% 0.83%<br />
Devon energy Corp oil & Gas 861 258 307 0.58% 0.58%<br />
Devry inc Consumer services 105 850 672 0.69% 0.69%<br />
DexCom inc Health Care 86 215 346 2.30% 2.30%<br />
DFC <strong>Global</strong> Corp Financials 32 003 896 0.68% 0.68%<br />
Diamond Foods inc Consumer Goods 29 059 648 0.68% 0.68%<br />
Diamond <strong>of</strong>fshore Drilling inc oil & Gas 156 503 969 0.34% 0.34%<br />
Diamondrock Hospitality Co Financials 64 183 697 0.67% 0.67%<br />
Diana shipping inc industrials 16 920 625 0.46% 0.46%<br />
Dick’s sporting Goods inc Consumer services 141 013 925 0.19% 0.53%<br />
Diebold inc technology 78 120 359 0.69% 0.69%<br />
Digital Gener<strong>at</strong>ion inc Consumer services 14 040 713 0.72% 0.72%<br />
Digital realty trust inc Financials 281 505 168 0.67% 0.67%<br />
Digital river inc technology 24 236 487 0.72% 0.72%<br />
DigitalGlobe inc industrials 21 998 520 0.47% 0.47%<br />
Dillard’s inc Consumer services 64 893 465 0.51% 0.47%<br />
Dime Community bancshares inc Financials 19 925 932 0.76% 0.76%<br />
Dineequity inc Consumer services 32 003 294 0.70% 0.70%<br />
Diodes inc technology 27 613 826 0.48% 0.48%<br />
DireCtv Consumer services 1 065 095 054 0.59% 0.59%<br />
Discover Financial services Financials 525 765 605 0.67% 0.67%<br />
Discovery Communic<strong>at</strong>ions inc Consumer services 327 510 297 0.18% 0.33%<br />
DisH network Corp Consumer services 107 484 888 0.02% 0.14%<br />
Dolby labor<strong>at</strong>ories inc Consumer services 64 913 563 0.06% 0.32%<br />
Dole Food Co inc Consumer Goods 12 779 577 0.28% 0.28%<br />
Dollar General Corp Consumer services 334 159 867 0.40% 0.40%<br />
Dollar thrifty automotive Group inc Consumer services 81 181 416 0.67% 0.67%<br />
Dollar tree inc Consumer services 400 076 091 0.68% 0.68%<br />
Dominion resources inc/va utilities 288 995 703 0.16% 0.16%<br />
Domino’s Pizza inc Consumer services 83 009 894 0.70% 0.70%<br />
Domtar Corp basic m<strong>at</strong>erials 123 207 089 0.71% 0.71%<br />
Donaldson Co inc industrials 8 661 462 0.03% 0.03%<br />
Douglas emmett inc Financials 68 867 918 0.49% 0.49%<br />
Dover Corp industrials 404 421 344 0.63% 0.63%<br />
Dow Chemical Co/the basic m<strong>at</strong>erials 1 023 429 062 0.50% 0.50%<br />
Dr Horton inc Consumer Goods 158 812 494 0.67% 0.67%<br />
Dr Pepper snapple Group inc Consumer Goods 342 328 554 0.68% 0.68%<br />
DreamWorks anim<strong>at</strong>ion sKG inc Consumer services 51 753 960 0.22% 0.63%<br />
Dresser-rand Group inc oil & Gas 164 171 112 0.73% 0.73%<br />
Drew industries inc Consumer Goods 16 424 800 0.51% 0.51%<br />
Dril-Quip inc oil & Gas 107 455 268 0.68% 0.68%<br />
Dryships inc industrials <strong>31</strong> 869 330 0.63% 0.63%<br />
Dst systems inc technology 85 515 921 0.71% 0.71%<br />
DsW inc Consumer services 53 273 610 0.17% 0.47%<br />
Dte energy Co utilities 132 933 516 0.24% 0.24%<br />
Dts inc/Ca Consumer Goods 17 181 214 0.63% 0.63%<br />
Duke energy Corp utilities 308 689 671 0.18% 0.18%<br />
Duke realty Corp Financials 121 251 121 0.67% 0.67%<br />
Dun & bradstreet Corp/the Consumer services 146 460 487 0.67% 0.67%<br />
Dunkin’ brands Group inc Consumer services 60 573 044 0.34% 0.34%<br />
DuPont Fabros technology inc Financials 64 856 202 0.72% 0.72%<br />
Dycom industries inc technology 28 761 208 0.68% 0.68%<br />
Dynegy inc utilities 13 545 898 0.67% 0.67%<br />
e*trade Financial Corp Financials 105 868 287 0.78% 0.78%<br />
eagle m<strong>at</strong>erials inc industrials 44 921 842 0.65% 0.65%<br />
earthlink inc technology 27 686 142 0.68% 0.68%<br />
east West bancorp inc Financials 115 046 808 0.65% 0.65%<br />
eastGroup Properties inc Financials 46 052 361 0.66% 0.66%<br />
eastman Chemical Co basic m<strong>at</strong>erials 700 302 270 2.18% 2.18%<br />
eastman Kodak Co Consumer Goods 6 525 865 0.62% 0.62%<br />
e<strong>at</strong>on Corp industrials 587 755 200 0.68% 0.68%<br />
voting<br />
ownership<br />
sector<br />
market value<br />
(noK)<br />
e<strong>at</strong>on vance Corp Financials 120 689 168 0.00% 0.74%<br />
ebay inc Consumer services 1 605 136 996 0.69% 0.69%<br />
ebix inc technology 25 327 294 0.53% 0.53%<br />
echelon Corp industrials 15 051 825 1.22% 1.22%<br />
echostar Corp technology <strong>31</strong> 827 198 0.05% 0.29%<br />
ecolab inc basic m<strong>at</strong>erials 772 449 362 0.75% 0.75%<br />
edison intern<strong>at</strong>ional utilities 302 462 726 0.38% 0.38%<br />
educ<strong>at</strong>ion management Corp Consumer services 44 992 008 0.21% 0.21%<br />
edwards lifesciences Corp Health Care 557 925 946 1.16% 1.16%<br />
eHealth inc Financials 13 051 686 0.74% 0.74%<br />
ei du Pont de nemours & Co basic m<strong>at</strong>erials 1 <strong>31</strong>3 736 136 0.52% 0.52%<br />
el Paso Corp oil & Gas 469 628 001 0.38% 0.38%<br />
el Paso electric Co utilities 61 655 712 0.74% 0.74%<br />
electro rent Corp industrials 10 571 050 0.43% 0.43%<br />
electro scientific industries inc industrials 15 193 474 0.61% 0.61%<br />
electronic arts inc Consumer Goods 303 288 970 0.74% 0.74%<br />
electronics for imaging inc technology 26 994 951 0.70% 0.70%<br />
eli lilly & Co Health Care 2 258 021 879 0.79% 0.79%<br />
elizabeth arden inc Consumer Goods 43 <strong>31</strong>4 204 0.67% 0.67%<br />
emC Corp/massachusetts technology 1 834 523 214 0.70% 0.70%<br />
emCor Group inc industrials 69 704 802 0.65% 0.65%<br />
emeritus Corp Health Care 21 167 487 0.46% 0.46%<br />
emerson electric Co industrials 1 449 106 468 0.71% 0.71%<br />
empire District electric Co/the utilities 34 612 115 0.66% 0.66%<br />
employers <strong>Holding</strong>s inc Financials 29 664 984 0.79% 0.79%<br />
emulex Corp technology 22 633 427 0.65% 0.65%<br />
enbridge energy management llC oil & Gas 55 361 306 0.72% 0.72%<br />
encore Capital Group inc Financials 14 555 515 0.47% 0.47%<br />
encore Wire Corp industrials 23 151 171 0.64% 0.64%<br />
endo Pharmaceuticals <strong>Holding</strong>s inc Health Care 164 257 329 0.68% 0.68%<br />
endurance specialty <strong>Holding</strong>s ltd Financials 62 511 946 0.68% 0.68%<br />
energen Corp oil & Gas 147 040 441 0.68% 0.68%<br />
energizer <strong>Holding</strong>s inc Consumer Goods 214 196 979 0.69% 0.69%<br />
energy XXi bermuda ltd oil & Gas 114 881 354 0.79% 0.79%<br />
energysolutions inc industrials 11 756 890 0.72% 0.72%<br />
enernoC inc industrials 48 218 813 2.77% 2.77%<br />
enersys industrials 151 839 862 2.05% 2.05%<br />
ennis inc industrials 12 445 236 0.60% 0.60%<br />
enPro industries inc industrials 27 257 819 0.67% 0.67%<br />
enstar Group ltd Financials 44 517 734 0.55% 0.55%<br />
entegris inc technology 51 080 923 0.73% 0.73%<br />
entergy Corp utilities 72 010 794 0.09% 0.09%<br />
entertainment Properties trust Financials 80 637 285 0.66% 0.66%<br />
entropic Communic<strong>at</strong>ions inc technology 12 580 150 0.48% 0.48%<br />
enzon Pharmaceuticals inc Health Care 15 105 274 0.78% 0.78%<br />
eoG resources inc oil & Gas 986 877 668 0.62% 0.62%<br />
ePiQ systems inc technology 15 641 621 0.61% 0.61%<br />
eQt Corp oil & Gas 338 517 359 0.69% 0.69%<br />
equifax inc Financials 195 247 497 0.70% 0.70%<br />
equinix inc technology 195 205 698 0.68% 0.68%<br />
equity lifestyle Properties inc Financials 109 966 124 0.68% 0.68%<br />
equity one inc Financials 36 443 999 0.<strong>31</strong>% 0.<strong>31</strong>%<br />
equity residential Financials 676 087 840 0.67% 0.67%<br />
eresearchtechnology inc Health Care 7 595 029 0.55% 0.55%<br />
erie indemnity Co Financials 115 006 339 0.00% 0.51%<br />
esCo technologies inc industrials 63 288 382 1.38% 1.38%<br />
essex Property trust inc Financials 192 664 261 0.67% 0.67%<br />
estee lauder Cos inc/the Consumer Goods 530 800 380 0.09% 0.41%<br />
esterline technologies Corp industrials 67 536 082 0.66% 0.66%<br />
ethan allen interiors inc Consumer Goods 29 111 239 0.71% 0.71%<br />
euronet Worldwide inc industrials 38 884 361 0.70% 0.70%<br />
everest re Group ltd Financials 183 100 125 0.68% 0.68%<br />
exar Corp technology 10 156 398 0.58% 0.58%<br />
excel maritime Carriers ltd industrials 1 773 168 0.08% 0.24%<br />
eXCo resources inc oil & Gas 66 034 327 0.49% 0.49%<br />
exelis inc industrials 66 845 195 0.67% 0.67%<br />
exelixis inc Health Care 23 798 499 0.65% 0.65%<br />
exelon Corp utilities 404 183 479 0.24% 0.24%<br />
exide technologies Consumer Goods 51 077 493 4.17% 4.17%<br />
exlservice <strong>Holding</strong>s inc industrials 17 399 184 0.42% 0.42%<br />
expedia inc Consumer services 147 176 785 0.23% 0.58%<br />
expeditors intern<strong>at</strong>ional <strong>of</strong> Washington inc industrials 355 440 942 0.69% 0.69%<br />
express inc Consumer services 58 946 393 0.46% 0.46%<br />
express scripts inc Health Care 1 011 256 328 0.78% 0.78%<br />
exterran <strong>Holding</strong>s inc oil & Gas 37 746 961 1.09% 1.09%<br />
extra space storage inc Financials 90 771 043 0.67% 0.67%<br />
extreme networks technology 8 984 449 0.55% 0.55%<br />
exxon mobil Corp oil & Gas 16 901 044 <strong>31</strong>1 0.70% 0.70%<br />
ezcorp inc Financials 49 783 643 0.63% 0.63%<br />
F5 networks inc technology 346 037 189 0.69% 0.69%<br />
Factset research systems inc Consumer services 158 401 984 0.67% 0.67%<br />
Fair isaac Corp technology 52 073 127 0.68% 0.68%<br />
Fairchild semiconductor intern<strong>at</strong>ional inc technology 46 147 158 0.51% 0.51%<br />
Family Dollar stores inc Consumer services 272 798 915 0.68% 0.68%<br />
Faro technologies inc industrials 28 473 257 0.62% 0.62%<br />
Fastenal Co industrials 543 845 923 0.71% 0.71%<br />
Fbl Financial Group inc Financials 19 723 519 0.30% 0.<strong>31</strong>%<br />
Federal n<strong>at</strong>ional mortgage associ<strong>at</strong>ion Financials 1 0.00% 0.00%<br />
Federal realty investment trust Financials 229 306 034 0.67% 0.67%<br />
Federal signal Corp industrials 10 679 007 0.69% 0.69%<br />
Federal-mogul Corp Consumer Goods 17 666 367 0.20% 0.20%<br />
Country associ<strong>at</strong>ion according to Ftse (the benchmark provider for <strong>equities</strong>). if a company is not in the benchmark, the country <strong>of</strong> incorpor<strong>at</strong>ion is listed. sector classific<strong>at</strong>ion according to iCb (the industry Classific<strong>at</strong>ion<br />
benchmark company).<br />
voting<br />
ownership<br />
HOLdiNgs<br />
38<br />
<strong>Government</strong> <strong>Pension</strong> FunD <strong>Global</strong> ANNUAL REPORT 2011
<strong>Government</strong> <strong>Pension</strong> <strong>Fund</strong> <strong>Global</strong> <strong>Holding</strong> <strong>of</strong> <strong>equities</strong> <strong>at</strong> <strong>31</strong> December 2011<br />
sector<br />
market value<br />
(noK)<br />
Feder<strong>at</strong>ed investors inc Financials 67 619 515 0.00% 0.72%<br />
Fedex Corp industrials 1 120 182 713 0.71% 0.71%<br />
Fei Co industrials 64 933 134 0.71% 0.71%<br />
FelCor lodging trust inc Financials 14 788 780 0.65% 0.65%<br />
Ferro Corp basic m<strong>at</strong>erials 17 053 335 0.68% 0.67%<br />
Fidelity n<strong>at</strong>ional Financial inc Financials 140 676 062 0.68% 0.68%<br />
Fidelity n<strong>at</strong>ional inform<strong>at</strong>ion services inc industrials 324 753 770 0.68% 0.68%<br />
Fifth third bancorp Financials 473 176 850 0.68% 0.68%<br />
Financial engines inc Financials 25 207 080 0.42% 0.42%<br />
Finisar Corp technology 59 480 114 0.66% 0.66%<br />
Finish line inc/the Consumer services 42 497 345 0.59% 0.71%<br />
First american Financial Corp Financials 53 046 572 0.67% 0.67%<br />
First Cash Financial services inc Financials 44 732 797 0.71% 0.71%<br />
First Citizens bancshares inc/nC Financials 45 448 266 0.12% 0.42%<br />
First Commonwealth Financial Corp Financials 21 433 714 0.65% 0.65%<br />
First Community bancshares inc/va Financials 4 859 002 0.37% 0.37%<br />
First Financial bancorp Financials 38 012 <strong>31</strong>6 0.66% 0.66%<br />
First Financial bankshares inc Financials 41 742 579 0.67% 0.67%<br />
First Financial Corp/in Financials 11 478 860 0.44% 0.44%<br />
First Horizon n<strong>at</strong>ional Corp Financials 90 253 165 0.72% 0.72%<br />
First industrial realty trust inc Financials 37 405 174 0.67% 0.67%<br />
First midwest bancorp inc/il Financials 32 442 085 0.72% 0.72%<br />
First niagara Financial Group inc Financials 11 254 267 0.06% 0.06%<br />
First republic bank/san Francisco Ca Financials 95 607 403 0.41% 0.41%<br />
First solar inc oil & Gas 96 292 981 0.55% 0.55%<br />
Firstenergy Corp utilities 1 750 808 865 1.58% 1.58%<br />
Firstmerit Corp Financials 65 204 608 0.66% 0.66%<br />
Fiserv inc industrials 333 118 205 0.67% 0.67%<br />
Flagstone reinsurance <strong>Holding</strong>s sa Financials 18 928 127 0.55% 0.55%<br />
FleetCor technologies inc industrials 34 467 265 0.24% 0.24%<br />
Flextronics intern<strong>at</strong>ional ltd industrials 184 402 326 0.77% 0.77%<br />
Flir systems inc industrials 162 162 449 0.69% 0.69%<br />
Flowers Foods inc Consumer Goods 106 661 835 0.69% 0.69%<br />
Flowserve Corp industrials 273 <strong>31</strong>5 085 0.83% 0.83%<br />
Fluor Corp industrials 356 958 157 0.70% 0.70%<br />
Flushing Financial Corp Financials 16 215 092 0.69% 0.69%<br />
FmC technologies inc oil & Gas 385 069 159 0.52% 0.52%<br />
Fnb Corp/Pa Financials 58 307 120 0.68% 0.68%<br />
Foot locker inc Consumer services 146 675 100 0.68% 0.68%<br />
Ford motor Co Consumer Goods 1 592 550 548 0.48% 0.65%<br />
Forest City enterprises inc Financials 74 504 877 0.29% 0.62%<br />
Forest labor<strong>at</strong>ories inc Health Care 325 210 926 0.67% 0.67%<br />
Forest oil Corp oil & Gas 69 124 909 0.75% 0.75%<br />
Forestar Group inc Financials 23 246 650 0.73% 0.73%<br />
Formfactor inc technology 11 228 820 0.74% 0.74%<br />
Forrester research inc technology 26 061 787 0.57% 0.57%<br />
Fortinet inc technology 98 994 852 0.49% 0.49%<br />
Fortune brands Home & security inc industrials 105 501 979 0.67% 0.67%<br />
Forward air Corp industrials 40 424 549 0.74% 0.74%<br />
Fossil inc Consumer Goods 219 358 329 0.74% 0.74%<br />
Foster Wheeler aG industrials 93 232 635 0.70% 0.70%<br />
Franklin electric Co inc industrials 32 028 333 0.53% 0.53%<br />
Franklin resources inc Financials 716 739 757 0.58% 0.57%<br />
Franklin street Properties Corp Financials 33 583 339 0.68% 0.68%<br />
Fred’s inc Consumer services 21 232 668 0.66% 0.66%<br />
Freescale semiconductor <strong>Holding</strong>s i ltd technology 25 024 411 0.14% 0.14%<br />
FreightCar america inc industrials 4 837 855 0.32% 0.32%<br />
Fresh Del monte Produce inc Consumer Goods 48 183 755 0.56% 0.56%<br />
Fresh market inc/the Consumer services 53 855 159 0.47% 0.47%<br />
Frontier Communic<strong>at</strong>ions Corp telecommunic<strong>at</strong>ions 34 276 438 0.11% 0.11%<br />
Fti Consulting inc industrials 74 959 793 0.72% 0.72%<br />
Fuel systems solutions inc Consumer Goods 65 715 359 3.34% 3.34%<br />
Fuel tech inc industrials 9 272 380 0.99% 0.99%<br />
FuelCell energy inc oil & Gas 12 207 338 1.84% 1.84%<br />
Fulton Financial Corp Financials 77 709 493 0.66% 0.66%<br />
Furniture brands intern<strong>at</strong>ional inc Consumer Goods 73 068 0.02% 0.02%<br />
G&K services inc industrials 19 361 008 0.59% 0.59%<br />
GamCo investors inc Financials 7 787 423 0.01% 0.11%<br />
Gamestop Corp Consumer services 135 703 499 0.69% 0.69%<br />
Gannett Co inc Consumer services 126 881 797 0.67% 0.67%<br />
Gap inc/the Consumer services 120 596 785 0.22% 0.22%<br />
Gardner Denver inc industrials 128 971 155 0.55% 0.55%<br />
Garmin ltd technology 253 750 024 0.55% 0.55%<br />
Gartner inc technology 135 260 257 0.69% 0.69%<br />
G<strong>at</strong>X Corp industrials 85 921 714 0.71% 0.71%<br />
Gaylord entertainment Co Consumer services 45 940 586 0.66% 0.66%<br />
Genco shipping & trading ltd industrials 11 079 532 0.76% 0.76%<br />
Generac <strong>Holding</strong>s inc industrials 30 504 810 0.27% 0.27%<br />
General Cable Corp industrials 108 719 691 1.40% 1.40%<br />
General Communic<strong>at</strong>ion inc telecommunic<strong>at</strong>ions 9 987 614 0.24% 0.39%<br />
General electric Co industrials 7 692 345 842 0.68% 0.68%<br />
General Growth Properties inc Financials 281 096 011 0.34% 0.34%<br />
General mills inc Consumer Goods 1 051 4<strong>31</strong> 760 0.68% 0.68%<br />
General motors Co Consumer Goods 807 3<strong>31</strong> 778 0.43% 0.43%<br />
Genesco inc Consumer services 59 247 092 0.66% 0.66%<br />
Genesee & Wyoming inc industrials 98 852 555 0.42% 0.64%<br />
Genomic Health inc Health Care 24 422 395 0.55% 0.55%<br />
Genon energy inc utilities 82 578 157 0.69% 0.69%<br />
Genpact ltd industrials 99 112 858 0.50% 0.50%<br />
Gen-Probe inc Health Care 113 970 656 0.69% 0.69%<br />
Gentex Corp Consumer Goods 157 171 151 0.62% 0.62%<br />
voting<br />
ownership<br />
sector<br />
market value<br />
(noK)<br />
Gentiva Health services inc Health Care 236 103 0.02% 0.02%<br />
Genuine Parts Co Consumer Goods 374 853 079 0.66% 0.66%<br />
Genworth Financial inc Financials 304 579 799 1.59% 1.59%<br />
Geo Group inc/the industrials 44 170 923 0.71% 0.71%<br />
Geoeye inc industrials 19 216 469 0.65% 0.65%<br />
Geron Corp Health Care 7 512 142 0.65% 0.65%<br />
Getty realty Corp Financials 12 493 846 0.45% 0.45%<br />
Gevo inc utilities 5 541 982 0.57% 0.57%<br />
GFi Group inc Financials 13 417 646 0.46% 0.46%<br />
Gibraltar industries inc industrials 11 935 944 0.47% 0.47%<br />
Gilead sciences inc Health Care 1 288 556 002 0.70% 0.70%<br />
Glacier bancorp inc Financials 35 517 139 0.69% 0.69%<br />
Glimcher realty trust Financials 27 805 994 0.47% 0.47%<br />
<strong>Global</strong> indemnity Plc Financials 13 113 985 0.08% 0.36%<br />
<strong>Global</strong> Payments inc industrials 152 422 288 0.69% 0.69%<br />
Globe specialty metals inc basic m<strong>at</strong>erials 41 321 661 0.69% 0.69%<br />
GnC <strong>Holding</strong>s inc Consumer services 90 122 620 0.49% 0.49%<br />
Gold resource Corp basic m<strong>at</strong>erials <strong>31</strong> 610 508 0.47% 0.47%<br />
Goldman sachs Group inc/the Financials 2 379 652 601 0.90% 0.86%<br />
Goodrich Corp industrials 628 455 379 0.68% 0.68%<br />
Goodrich Petroleum Corp oil & Gas 17 409 536 0.59% 0.59%<br />
Goodyear tire & rubber Co/the Consumer Goods 138 640 555 0.67% 0.67%<br />
Google inc technology 6 885 879 936 0.19% 0.55%<br />
Gorman-rupp Co/the industrials 21 725 123 0.64% 0.64%<br />
<strong>Government</strong> Properties income trust Financials 29 413 478 0.46% 0.46%<br />
Graco inc industrials 98 950 536 0.68% 0.68%<br />
Graftech intern<strong>at</strong>ional ltd industrials 77 905 538 0.66% 0.66%<br />
Gran tierra energy inc oil & Gas 50 642 372 0.68% 0.68%<br />
Grand Canyon educ<strong>at</strong>ion inc Consumer services 21 441 386 0.51% 0.51%<br />
Granite Construction inc industrials 38 939 980 0.71% 0.71%<br />
Graphic Packaging <strong>Holding</strong> Co industrials 20 803 515 0.21% 0.21%<br />
Gre<strong>at</strong> <strong>at</strong>lantic & Pacific tea Co inc/the Consumer services 697 0.01% 0.01%<br />
Gre<strong>at</strong> Plains energy inc utilities 591 097 732 3.34% 3.34%<br />
Gre<strong>at</strong>b<strong>at</strong>ch inc industrials 19 707 917 0.64% 0.64%<br />
Green Dot Corp Financials <strong>31</strong> 255 266 0.09% 0.40%<br />
Green mountain C<strong>of</strong>fee roasters inc Consumer Goods 277 270 573 0.67% 0.67%<br />
Green Plains renewable energy inc oil & Gas 64 071 212 3.34% 3.34%<br />
Greenhill & Co inc Financials 38 427 084 0.61% 0.61%<br />
Greenlight Capital re ltd Financials 30 783 114 0.23% 0.60%<br />
Greif inc industrials 44 498 053 0.00% 0.35%<br />
Griffon Corp industrials 18 550 938 0.55% 0.55%<br />
Group 1 automotive inc Consumer services 47 8<strong>31</strong> 039 0.68% 0.68%<br />
Groupon inc Consumer services 51 843 976 0.04% 0.07%<br />
Gt advanced technologies inc oil & Gas 111 147 460 2.02% 2.02%<br />
Guess? inc Consumer services 83 573 089 0.51% 0.51%<br />
Gulf island Fabric<strong>at</strong>ion inc oil & Gas 15 798 793 0.63% 0.63%<br />
Gulfmark <strong>of</strong>fshore inc oil & Gas 46 339 391 0.70% 0.70%<br />
Gulfport energy Corp oil & Gas 65 041 191 0.67% 0.67%<br />
H&e equipment services inc industrials 19 998 205 0.71% 0.71%<br />
H&r block inc Consumer services 205 207 395 0.72% 0.72%<br />
Haemonetics Corp Health Care 62 383 400 0.68% 0.68%<br />
Hain Celestial Group inc/the Consumer Goods 62 678 853 0.65% 0.65%<br />
Halliburton Co oil & Gas 1 329 088 009 0.70% 0.70%<br />
Halozyme therapeutics inc Health Care 38 337 233 0.65% 0.65%<br />
Hancock <strong>Holding</strong> Co Financials 108 747 441 0.67% 0.67%<br />
Hanesbrands inc Consumer Goods 87 649 922 0.69% 0.69%<br />
Hanger orthopedic Group inc Health Care 17 256 617 0.46% 0.46%<br />
Hanover insurance Group inc/the Financials 62 091 302 0.66% 0.66%<br />
Harley-Davidson inc Consumer Goods 369 055 436 0.68% 0.68%<br />
Harleysville Group inc Financials 30 886 308 0.34% 0.34%<br />
Harman intern<strong>at</strong>ional industries inc Consumer Goods 105 203 944 0.66% 0.66%<br />
Harmonic inc technology 23 899 809 0.68% 0.68%<br />
Harris Corp technology 168 876 504 0.68% 0.68%<br />
Harsco Corp industrials 64 014 367 0.65% 0.65%<br />
Harte-Hanks inc Consumer services 15 515 932 0.46% 0.46%<br />
Hartford Financial services Group inc Financials 1 737 123 016 4.02% 4.02%<br />
Hasbro inc Consumer Goods 171 600 538 0.70% 0.70%<br />
H<strong>at</strong>teras Financial Corp Financials 82 693 869 0.69% 0.69%<br />
Hawaiian electric industries inc utilities 102 253 057 0.67% 0.67%<br />
Haynes intern<strong>at</strong>ional inc basic m<strong>at</strong>erials 25 804 067 0.65% 0.65%<br />
Hb Fuller Co basic m<strong>at</strong>erials 46 053 883 0.68% 0.68%<br />
HCa <strong>Holding</strong>s inc Health Care 154 913 375 0.27% 0.27%<br />
HCC insurance <strong>Holding</strong>s inc Financials 118 086 141 0.68% 0.68%<br />
HCP inc Financials 678 959 894 0.67% 0.67%<br />
Health Care reit inc Financials 421 677 618 0.68% 0.68%<br />
Health management associ<strong>at</strong>es inc Health Care 78 186 335 0.70% 0.70%<br />
Health net inc Health Care 102 005 800 0.68% 0.68%<br />
Healthcare realty trust inc Financials 60 440 398 0.70% 0.70%<br />
Healthcare services Group inc Health Care 50 119 848 0.71% 0.71%<br />
Healthsouth Corp Health Care 65 904 541 0.66% 0.66%<br />
Healthspring inc Health Care 151 911 019 0.69% 0.69%<br />
Healthways inc Health Care 8 353 426 0.61% 0.61%<br />
Heartland express inc industrials 41 235 044 0.55% 0.55%<br />
Heartland Payment systems inc industrials 42 0<strong>31</strong> 761 0.75% 0.75%<br />
HeartWare intern<strong>at</strong>ional inc Health Care 117 546 689 2.03% 2.03%<br />
Heckmann Corp Consumer Goods 119 442 747 2.41% 2.41%<br />
Hecla mining Co basic m<strong>at</strong>erials 58 265 364 0.67% 0.67%<br />
HeiCo Corp industrials 41 114 926 0.46% 0.32%<br />
Heidrick & struggles intern<strong>at</strong>ional inc industrials 14 294 078 0.62% 0.62%<br />
Helen <strong>of</strong> troy ltd Consumer Goods 26 077 143 0.45% 0.45%<br />
Helix energy solutions Group inc oil & Gas 89 010 245 0.89% 0.89%<br />
Country associ<strong>at</strong>ion according to Ftse (the benchmark provider for <strong>equities</strong>). if a company is not in the benchmark, the country <strong>of</strong> incorpor<strong>at</strong>ion is listed. sector classific<strong>at</strong>ion according to iCb (the industry Classific<strong>at</strong>ion<br />
benchmark company).<br />
voting<br />
ownership<br />
HOLdiNgs<br />
39<br />
<strong>Government</strong> <strong>Pension</strong> FunD <strong>Global</strong> ANNUAL REPORT 2011
<strong>Government</strong> <strong>Pension</strong> <strong>Fund</strong> <strong>Global</strong> <strong>Holding</strong> <strong>of</strong> <strong>equities</strong> <strong>at</strong> <strong>31</strong> December 2011<br />
sector<br />
market value<br />
(noK)<br />
Helmerich & Payne inc oil & Gas 266 169 501 0.71% 0.71%<br />
Henry schein inc Health Care 234 587 614 0.68% 0.68%<br />
Herbalife ltd Consumer Goods 246 550 259 0.69% 0.69%<br />
Hercules <strong>of</strong>fshore inc oil & Gas 25 167 143 0.69% 0.69%<br />
Herman miller inc Consumer Goods 41 649 158 0.65% 0.65%<br />
Hersha Hospitality trust Financials 34 334 419 0.69% 0.69%<br />
Hershey Co/the Consumer Goods 411 370 702 0.14% 0.49%<br />
Hertz <strong>Global</strong> <strong>Holding</strong>s inc Consumer services 197 534 593 0.68% 0.68%<br />
Hess Corp oil & Gas 836 <strong>31</strong>9 523 0.73% 0.73%<br />
Hewlett-Packard Co technology 2 178 986 689 0.71% 0.71%<br />
Hexcel Corp industrials 95 172 235 0.67% 0.67%<br />
hhgregg inc Consumer services 8 237 260 0.26% 0.26%<br />
Hibbett sports inc Consumer services 50 804 058 0.71% 0.71%<br />
Higher one <strong>Holding</strong>s inc industrials 26 174 054 0.42% 0.42%<br />
Highwoods Properties inc Financials 90 054 853 0.70% 0.70%<br />
Hillenbrand inc Consumer services 59 446 968 0.71% 0.71%<br />
Hill-rom <strong>Holding</strong>s inc Health Care 84 484 707 0.68% 0.68%<br />
Hilltop <strong>Holding</strong>s inc Financials 16 355 897 0.57% 0.57%<br />
Hittite microwave Corp technology 47 217 002 0.51% 0.51%<br />
HJ Heinz Co Consumer Goods 700 710 913 0.68% 0.68%<br />
Hms <strong>Holding</strong>s Corp Health Care 108 368 828 0.67% 0.67%<br />
Hni Corp Consumer Goods 46 376 244 0.66% 0.66%<br />
HollyFrontier Corp oil & Gas 201 082 218 0.69% 0.69%<br />
Hologic inc Health Care 265 006 878 0.96% 0.96%<br />
Home bancshares inc/ar Financials 23 469 060 0.54% 0.54%<br />
Home Depot inc/the Consumer services 4 033 193 170 1.04% 1.04%<br />
Home Properties inc Financials 112 179 604 0.68% 0.68%<br />
Horace mann educ<strong>at</strong>ors Corp Financials 20 760 503 0.64% 0.64%<br />
Hormel Foods Corp Consumer Goods 237 215 792 0.51% 0.51%<br />
Hornbeck <strong>of</strong>fshore services inc oil & Gas 45 709 599 0.71% 0.71%<br />
Hospira inc Health Care 203 740 618 0.68% 0.68%<br />
Hospitality Properties trust Financials 117 256 725 0.69% 0.69%<br />
Host Hotels & resorts inc Financials 420 219 714 0.68% 0.68%<br />
Hot topic inc Consumer services 13 255 1<strong>31</strong> 0.80% 0.80%<br />
Howard Hughes Corp/the Financials 42 543 897 0.43% 0.43%<br />
Hsn inc Consumer services 86 352 703 0.68% 0.68%<br />
Hub Group inc industrials 50 205 404 0.52% 0.69%<br />
Hubbell inc industrials 181 567 960 0.23% 0.76%<br />
Hudson City bancorp inc Financials 130 347 339 0.66% 0.66%<br />
Human Genome sciences inc Health Care 63 268 042 0.62% 0.62%<br />
Humana inc Health Care 579 882 715 0.68% 0.68%<br />
Huntington bancshares inc/oH Financials 51 289 066 0.18% 0.18%<br />
Huntington ingalls industries inc industrials 60 530 732 0.66% 0.66%<br />
Huntsman Corp basic m<strong>at</strong>erials 197 173 787 1.39% 1.39%<br />
Huron Consulting Group inc industrials 34 652 707 0.66% 0.66%<br />
Hy<strong>at</strong>t Hotels Corp Consumer services 64 303 625 0.02% 0.17%<br />
iaC/interactiveCorp technology 135 668 264 0.40% 0.65%<br />
iberiabank Corp Financials 61 611 420 0.71% 0.71%<br />
iconix brand Group inc Consumer Goods 47 694 716 0.67% 0.67%<br />
iCu medical inc Health Care 16 412 638 0.44% 0.44%<br />
iDaCorP inc utilities 88 550 085 0.70% 0.70%<br />
iDeX Corp industrials 115 528 601 0.63% 0.63%<br />
iDeXX labor<strong>at</strong>ories inc Health Care 175 442 283 0.68% 0.68%<br />
iG<strong>at</strong>e Corp technology 16 243 245 0.<strong>31</strong>% 0.<strong>31</strong>%<br />
iHs inc Consumer services 168 542 465 0.50% 0.50%<br />
ii-vi inc industrials 45 041 801 0.66% 0.66%<br />
illinois tool Works inc industrials 874 289 519 0.65% 0.65%<br />
illumina inc Health Care 151 836 532 0.67% 0.67%<br />
im<strong>at</strong>ion Corp technology 9 717 715 0.75% 0.75%<br />
immunogen inc Health Care 35 660 034 0.68% 0.68%<br />
impax labor<strong>at</strong>ories inc Health Care 53 719 105 0.67% 0.67%<br />
incyte Corp ltd Health Care 174 002 144 1.54% 1.54%<br />
independent bank Corp/rockland ma Financials 24 980 940 0.71% 0.71%<br />
infinera Corp technology 24 460 640 0.61% 0.61%<br />
infinity Property & Casualty Corp Financials 28 439 125 0.71% 0.71%<br />
inform<strong>at</strong>ica Corp technology 178 619 376 0.76% 0.76%<br />
infospace inc technology 19 624 582 0.76% 0.76%<br />
ingersoll-rand PlC industrials 447 385 043 0.79% 0.79%<br />
ingram micro inc technology 87 651 101 0.53% 0.53%<br />
inland real est<strong>at</strong>e Corp Financials 26 502 292 0.66% 0.66%<br />
innerWorkings inc industrials 16 267 996 0.63% 0.63%<br />
innophos <strong>Holding</strong>s inc basic m<strong>at</strong>erials 30 429 094 0.49% 0.49%<br />
innospec inc basic m<strong>at</strong>erials 25 338 292 0.65% 0.65%<br />
inPhonic inc Consumer services 0 0.00% 0.00%<br />
insight enterprises inc technology 28 602 846 0.71% 0.71%<br />
insperity inc industrials 28 508 623 0.73% 0.73%<br />
insulet Corp Health Care 34 037 156 0.64% 0.64%<br />
integra lifesciences <strong>Holding</strong>s Corp Health Care 24 671 290 0.50% 0.50%<br />
integr<strong>at</strong>ed Device technology inc technology <strong>31</strong> 938 651 0.69% 0.69%<br />
integrys energy Group inc utilities 168 719 361 0.67% 0.67%<br />
intel Corp technology 4 914 858 659 0.67% 0.67%<br />
interactive brokers Group inc Financials 25 093 253 0.62% 0.62%<br />
intercontinentalexchange inc Financials 356 751 2<strong>31</strong> 0.68% 0.68%<br />
interDigital inc/Pa technology 80 429 454 0.68% 0.68%<br />
interface inc Consumer Goods 28 043 234 0.62% 0.62%<br />
interline brands inc industrials 19 678 713 0.66% 0.66%<br />
intermec inc technology 13 568 749 0.55% 0.55%<br />
intermune inc Health Care 165 496 919 3.36% 3.36%<br />
intern<strong>at</strong>ional bancshares Corp Financials 38 362 167 0.52% 0.52%<br />
intern<strong>at</strong>ional business machines Corp technology 8 765 983 787 0.68% 0.68%<br />
intern<strong>at</strong>ional Flavors & Fragrances inc basic m<strong>at</strong>erials 169 436 301 0.67% 0.67%<br />
voting<br />
ownership<br />
sector<br />
market value<br />
(noK)<br />
intern<strong>at</strong>ional Game technology Consumer services 211 230 269 0.69% 0.69%<br />
intern<strong>at</strong>ional Paper Co basic m<strong>at</strong>erials 522 633 353 0.68% 0.68%<br />
intern<strong>at</strong>ional rectifier Corp technology 1 716 791 0.02% 0.02%<br />
intern<strong>at</strong>ional speedway Corp Consumer services 26 261 549 0.14% 0.37%<br />
interoil Corp oil & Gas 111 639 295 0.76% 0.76%<br />
interpublic Group <strong>of</strong> Cos inc/the Consumer services 98 910 796 0.37% 0.37%<br />
intersil Corp technology 53 940 649 0.68% 0.68%<br />
interval leisure Group inc Consumer services 24 028 030 0.53% 0.53%<br />
interXion <strong>Holding</strong> nv technology 125 243 527 2.38% 2.38%<br />
intl. FCstone inc Financials 141 0.00% 0.00%<br />
intrepid Potash inc basic m<strong>at</strong>erials 49 840 725 0.49% 0.49%<br />
intuit inc technology 685 438 121 0.73% 0.73%<br />
intuitive surgical inc Health Care 847 341 575 0.79% 0.79%<br />
invacare Corp Health Care 19 042 771 0.50% 0.66%<br />
invesco ltd Financials 372 866 009 0.69% 0.69%<br />
invesco mortgage Capital inc Financials 66 025 180 0.68% 0.68%<br />
investment technology Group inc Financials 18 514 805 0.72% 0.72%<br />
investors bancorp inc Financials 33 467 078 0.37% 0.37%<br />
investors real est<strong>at</strong>e trust Financials 22 960 293 0.63% 0.63%<br />
ion Geophysical Corp oil & Gas 53 371 132 0.94% 0.94%<br />
iPC the Hospitalist Co inc Health Care 28 471 840 0.63% 0.63%<br />
iPG Photonics Corp industrials 48 403 928 0.50% 0.50%<br />
iron mountain inc industrials 232 465 734 0.68% 0.68%<br />
isis Pharmaceuticals inc Health Care 29 455 877 0.69% 0.69%<br />
isle <strong>of</strong> Capri Casinos inc Consumer services 87 <strong>31</strong>8 0.01% 0.01%<br />
istar Financial inc Financials 18 694 666 0.72% 0.72%<br />
itC <strong>Holding</strong>s Corp utilities 170 219 241 0.73% 0.73%<br />
itron inc industrials 517 620 042 5.95% 5.95%<br />
itt Corp industrials 71 441 934 0.67% 0.67%<br />
itt educ<strong>at</strong>ional services inc Consumer services 62 469 710 0.69% 0.69%<br />
ixia technology 10 796 474 0.25% 0.25%<br />
J&J snack Foods Corp Consumer Goods <strong>31</strong> 369 565 0.53% 0.53%<br />
j2 <strong>Global</strong> inc technology 50 633 677 0.64% 0.64%<br />
Jabil Circuit inc industrials 136 128 845 0.56% 0.56%<br />
Jack Henry & associ<strong>at</strong>es inc industrials 114 155 683 0.66% 0.66%<br />
Jack in the box inc Consumer services 37 739 229 0.69% 0.69%<br />
Jacobs engineering Group inc industrials 207 648 502 0.67% 0.67%<br />
Jakks Pacific inc Consumer Goods 15 473 600 0.71% 0.71%<br />
James river Coal Co basic m<strong>at</strong>erials 9 700 868 0.66% 0.66%<br />
Janus Capital Group inc Financials 46 505 682 0.66% 0.66%<br />
Jarden Corp Consumer Goods 109 422 515 0.68% 0.68%<br />
Jazz Pharmaceuticals inc Health Care 25 838 215 0.27% 0.27%<br />
Jb Hunt transport services inc industrials 162 367 602 0.52% 0.52%<br />
JC Penney Co inc Consumer services 124 827 575 0.28% 0.28%<br />
JDa s<strong>of</strong>tware Group inc technology 57 861 8<strong>31</strong> 0.70% 0.70%<br />
JDs uniphase Corp technology 92 843 703 0.64% 0.64%<br />
Jefferies Group inc Financials 92 785 367 0.57% 0.57%<br />
Jetblue airways Corp Consumer services 69 190 942 0.75% 0.75%<br />
Jm smucker Co/the Consumer Goods 361 341 256 0.68% 0.68%<br />
John bean technologies Corp industrials 15 749 777 0.60% 0.60%<br />
John Wiley & sons inc Consumer services 91 747 484 0.24% 0.57%<br />
Johnson & Johnson Health Care 7 334 209 914 0.69% 0.69%<br />
Johnson Controls inc Consumer Goods 969 988 595 0.76% 0.76%<br />
Jones Group inc/the Consumer Goods 35 681 123 0.70% 0.70%<br />
Jones lang lasalle inc Financials 108 827 511 0.68% 0.68%<br />
Jos a bank Clothiers inc Consumer services 53 202 153 0.66% 0.66%<br />
Joy <strong>Global</strong> inc industrials <strong>31</strong>8 828 610 0.68% 0.68%<br />
JPmorgan Chase & Co Financials 6 185 588 223 0.82% 0.82%<br />
Juniper networks inc technology 667 842 891 1.04% 1.04%<br />
K12 inc Consumer services 26 832 636 0.69% 0.69%<br />
Kaiser aluminum Corp basic m<strong>at</strong>erials 25 860 490 0.49% 0.49%<br />
Kaman Corp industrials 29 510 546 0.69% 0.69%<br />
Kansas City southern industrials 306 210 289 0.69% 0.69%<br />
Kar auction services inc Consumer services 22 708 948 0.21% 0.21%<br />
Kaydon Corp industrials 67 354 687 1.15% 1.15%<br />
Kb Home Consumer Goods 22 138 033 0.72% 0.72%<br />
Kbr inc industrials 168 386 225 0.68% 0.68%<br />
KbW inc Financials 17 938 596 0.60% 0.60%<br />
Kearny Financial Corp Financials 6 189 450 0.16% 0.16%<br />
Kellogg Co Consumer Goods 558 282 705 0.52% 0.52%<br />
Kelly services inc industrials 17 662 906 0.00% 0.59%<br />
Kemper Corp Financials 50 862 809 0.48% 0.48%<br />
Kenexa Corp technology 30 111 604 0.70% 0.70%<br />
Kennametal inc industrials 122 089 008 0.70% 0.70%<br />
Key energy services inc oil & Gas 96 896 911 0.70% 0.70%<br />
KeyCorp Financials 558 117 160 1.28% 1.28%<br />
Kilroy realty Corp Financials 88 342 347 0.67% 0.67%<br />
Kimberly-Clark Corp Consumer Goods 1 167 630 932 0.67% 0.67%<br />
Kimco realty Corp Financials 266 663 850 0.68% 0.68%<br />
Kinder morgan inc/Delaware oil & Gas 143 138 1<strong>31</strong> 0.11% 0.09%<br />
Kindred Healthcare inc Health Care 24 937 799 0.68% 0.68%<br />
Kirby Corp industrials 175 814 880 0.80% 0.80%<br />
Kla-tencor Corp technology 327 084 752 0.68% 0.68%<br />
Knight Capital Group inc Financials 55 597 516 0.80% 0.80%<br />
Knight transport<strong>at</strong>ion inc industrials 42 836 694 0.58% 0.58%<br />
Knightsbridge tankers ltd industrials 12 760 058 0.64% 0.64%<br />
Knoll inc Consumer Goods 26 467 663 0.63% 0.63%<br />
Knology inc Consumer services 22 517 <strong>31</strong>0 0.70% 0.70%<br />
Kodiak oil & Gas Corp oil & Gas 96 375 759 0.66% 0.66%<br />
Kohl’s Corp Consumer services 849 138 174 1.14% 1.14%<br />
Kopin Corp technology 8 810 561 0.56% 0.56%<br />
Country associ<strong>at</strong>ion according to Ftse (the benchmark provider for <strong>equities</strong>). if a company is not in the benchmark, the country <strong>of</strong> incorpor<strong>at</strong>ion is listed. sector classific<strong>at</strong>ion according to iCb (the industry Classific<strong>at</strong>ion<br />
benchmark company).<br />
voting<br />
ownership<br />
HOLdiNgs<br />
40<br />
<strong>Government</strong> <strong>Pension</strong> FunD <strong>Global</strong> ANNUAL REPORT 2011
<strong>Government</strong> <strong>Pension</strong> <strong>Fund</strong> <strong>Global</strong> <strong>Holding</strong> <strong>of</strong> <strong>equities</strong> <strong>at</strong> <strong>31</strong> December 2011<br />
sector<br />
market value<br />
(noK)<br />
Koppers <strong>Holding</strong>s inc basic m<strong>at</strong>erials 30 233 044 0.72% 0.72%<br />
Korn/Ferry intern<strong>at</strong>ional industrials 34 082 589 0.70% 0.70%<br />
Kraft Foods inc Consumer Goods 2 666 338 083 0.68% 0.68%<br />
Kr<strong>at</strong>on Performance Polymers inc basic m<strong>at</strong>erials 26 789 642 0.69% 0.69%<br />
Kroger Co/the Consumer services 725 947 130 0.87% 0.87%<br />
Kronos Worldwide inc basic m<strong>at</strong>erials 82 748 873 0.66% 0.66%<br />
K-swiss inc Consumer Goods 94 364 0.01% 0.02%<br />
l-3 Communic<strong>at</strong>ions <strong>Holding</strong>s inc industrials 269 <strong>31</strong>5 025 0.68% 0.68%<br />
labor<strong>at</strong>ory Corp <strong>of</strong> america <strong>Holding</strong>s Health Care 428 070 370 0.84% 0.84%<br />
laclede Group inc/the utilities 33 176 557 0.61% 0.61%<br />
lam research Corp technology 162 360 059 0.61% 0.61%<br />
lamar advertising Co Consumer services 90 389 482 0.24% 0.59%<br />
lancaster Colony Corp Consumer Goods 55 361 767 0.49% 0.49%<br />
landauer inc industrials 21 383 222 0.74% 0.74%<br />
landstar system inc industrials 89 588 257 0.67% 0.67%<br />
las vegas sands Corp Consumer services 670 403 488 0.32% 0.32%<br />
lasalle Hotel Properties Financials 81 818 005 0.68% 0.68%<br />
l<strong>at</strong>tice semiconductor Corp technology 21 280 480 0.51% 0.51%<br />
layne Christensen Co industrials 16 644 333 0.58% 0.58%<br />
leap Wireless intern<strong>at</strong>ional inc telecommunic<strong>at</strong>ions 12 201 233 0.28% 0.28%<br />
lear Corp Consumer Goods 141 478 807 0.59% 0.59%<br />
legg mason inc Financials 136 330 060 0.68% 0.68%<br />
leggett & Pl<strong>at</strong>t inc Consumer Goods 1<strong>31</strong> 329 673 0.69% 0.69%<br />
lender Processing services inc industrials 53 900 147 0.71% 0.71%<br />
lennar Corp Consumer Goods 120 979 826 0.22% 0.55%<br />
lennox intern<strong>at</strong>ional inc industrials 70 796 321 0.68% 0.68%<br />
leucadia n<strong>at</strong>ional Corp Financials 81 117 8<strong>31</strong> 0.24% 0.24%<br />
level 3 Communic<strong>at</strong>ions inc telecommunic<strong>at</strong>ions 115 006 190 0.55% 0.55%<br />
lexicon Pharmaceuticals inc Health Care 14 014 740 0.38% 0.38%<br />
lexington realty trust Financials 47 959 689 0.70% 0.70%<br />
lexmark intern<strong>at</strong>ional inc technology 104 879 332 0.71% 0.71%<br />
lHC Group inc Health Care 5 783 777 0.40% 0.40%<br />
liberty <strong>Global</strong> inc Consumer services 732 590 681 0.86% 1.06%<br />
liberty interactive Corp Consumer services 399 329 165 0.48% 0.69%<br />
liberty media Corp Consumer services 369 298 091 0.37% 0.64%<br />
liberty Property trust Financials 146 0<strong>31</strong> 999 0.68% 0.68%<br />
life technologies Corp Health Care <strong>31</strong>5 670 263 0.76% 0.76%<br />
life time Fitness inc Consumer services 78 398 072 0.66% 0.66%<br />
lifePoint Hospitals inc Health Care 76 177 113 0.71% 0.71%<br />
lincare <strong>Holding</strong>s inc Health Care 98 028 109 0.72% 0.72%<br />
lincoln educ<strong>at</strong>ional services Corp industrials 221 590 0.02% 0.02%<br />
lincoln electric <strong>Holding</strong>s inc industrials 135 585 965 0.69% 0.69%<br />
lincoln n<strong>at</strong>ional Corp Financials 306 489 204 0.88% 0.88%<br />
lindsay Corp industrials 28 795 988 0.69% 0.69%<br />
linear technology Corp technology 266 244 858 0.65% 0.65%<br />
linkedin Corp industrials 59 270 756 0.03% 0.16%<br />
linn energy llC oil & Gas 4 068 564 0.01% 0.01%<br />
lions G<strong>at</strong>e entertainment Corp Consumer services 35 132 422 0.51% 0.51%<br />
liquidity services inc Consumer services <strong>31</strong> 554 284 0.49% 0.49%<br />
littelfuse inc industrials 39 257 450 0.66% 0.66%<br />
live n<strong>at</strong>ion entertainment inc Consumer services 66 279 503 0.71% 0.71%<br />
liz Claiborne inc Consumer Goods 32 919 3<strong>31</strong> 0.68% 0.68%<br />
lKQ Corp Consumer Goods 191 815 291 0.73% 0.73%<br />
loews Corp Financials 271 496 711 0.30% 0.30%<br />
logmein inc technology 38 323 680 0.69% 0.69%<br />
loral space & Communic<strong>at</strong>ions inc technology 41 056 041 0.50% 0.35%<br />
louisiana-Pacific Corp industrials 39 821 495 0.61% 0.61%<br />
lowe’s Cos inc Consumer services 1 689 604 753 0.89% 0.89%<br />
lPl investment <strong>Holding</strong>s inc Financials 42 121 291 0.21% 0.21%<br />
lsi Corp technology 122 773 804 0.61% 0.61%<br />
ltC Properties inc Financials 39 702 650 0.71% 0.71%<br />
ltd brands inc Consumer services 278 964 544 0.39% 0.39%<br />
lufkin industries inc oil & Gas 83 598 352 0.68% 0.68%<br />
lululemon <strong>at</strong>hletica inc Consumer Goods 205 479 825 0.51% 0.51%<br />
lumber liquid<strong>at</strong>ors <strong>Holding</strong>s inc Consumer services 14 757 267 0.50% 0.50%<br />
luminex Corp Health Care 42 070 975 0.79% 0.79%<br />
lumos networks Corp telecommunic<strong>at</strong>ions 7 550 908 0.39% 0.39%<br />
lyondellbasell industries nv basic m<strong>at</strong>erials 566 889 788 0.51% 0.51%<br />
m&t bank Corp Financials 645 941 096 1.13% 1.13%<br />
macerich Co/the Financials 272 792 674 0.68% 0.68%<br />
mack-Cali realty Corp Financials 92 109 338 0.66% 0.66%<br />
macquarie infrastructure Co llC industrials 53 828 217 0.70% 0.70%<br />
macy’s inc Consumer services 1 184 956 185 1.47% 1.47%<br />
madison square Garden Co/the Consumer services 74 777 559 0.22% 0.58%<br />
magellan Health services inc Health Care 57 050 817 0.68% 0.68%<br />
maiden <strong>Holding</strong>s ltd Financials 26 647 200 0.71% 0.71%<br />
maKo surgical Corp Health Care <strong>31</strong> 382 937 0.50% 0.50%<br />
manh<strong>at</strong>tan associ<strong>at</strong>es inc technology 33 450 254 0.67% 0.67%<br />
manitowoc Co inc/the industrials 48 047 256 0.66% 0.66%<br />
mannKind Corp Health Care 8 359 725 0.43% 0.43%<br />
manpower inc industrials 116 726 516 0.67% 0.67%<br />
mantech intern<strong>at</strong>ional Corp industrials 27 920 696 0.10% 0.41%<br />
mar<strong>at</strong>hon oil Corp oil & Gas 728 493 206 0.59% 0.59%<br />
mar<strong>at</strong>hon Petroleum Corp oil & Gas 419 806 497 0.59% 0.59%<br />
markel Corp Financials 161 401 879 0.68% 0.68%<br />
marketaxess <strong>Holding</strong>s inc Financials 41 621 848 0.65% 0.61%<br />
marriott intern<strong>at</strong>ional inc/De Consumer services 395 382 4<strong>31</strong> 0.68% 0.68%<br />
marriott vac<strong>at</strong>ions Worldwide Corp Consumer services 24 388 435 0.71% 0.71%<br />
marsh & mclennan Cos inc Financials 464 369 716 0.46% 0.46%<br />
martin marietta m<strong>at</strong>erials inc industrials 135 400 420 0.66% 0.66%<br />
marvell technology Group ltd technology 322 581 908 0.67% 0.67%<br />
voting<br />
ownership<br />
sector<br />
market value<br />
(noK)<br />
masco Corp industrials 155 927 109 0.70% 0.70%<br />
masimo Corp Health Care 44 626 872 0.67% 0.67%<br />
mastec inc industrials 46 783 036 0.53% 0.53%<br />
mastercard inc Financials 1 642 549 329 0.61% 0.58%<br />
m<strong>at</strong>erion Corp industrials 20 976 858 0.71% 0.71%<br />
m<strong>at</strong>rix service Co oil & Gas 9 277 764 0.59% 0.59%<br />
m<strong>at</strong>tel inc Consumer Goods 405 995 262 0.72% 0.72%<br />
m<strong>at</strong>thews intern<strong>at</strong>ional Corp Consumer services 36 826 517 0.69% 0.69%<br />
maxim integr<strong>at</strong>ed Products inc technology 307 012 728 0.68% 0.68%<br />
maXimus inc industrials 56 542 507 0.68% 0.68%<br />
maxwell technologies inc industrials <strong>31</strong> 914 140 1.17% 1.17%<br />
mb Financial inc Financials 39 776 889 0.71% 0.71%<br />
mbia inc Financials 71 385 185 0.53% 0.53%<br />
mcCormick & Co inc/mD Consumer Goods 243 917 328 0.00% 0.61%<br />
mcDermott intern<strong>at</strong>ional inc oil & Gas 125 701 974 0.78% 0.78%<br />
mcDonald’s Corp Consumer services 4 186 881 787 0.68% 0.68%<br />
mcGr<strong>at</strong>h rentcorp industrials 25 876 544 0.61% 0.61%<br />
mcGraw-Hill Cos inc/the Consumer services 696 277 703 0.88% 0.88%<br />
mcKesson Corp Consumer services 844 994 900 0.74% 0.74%<br />
mcmoran explor<strong>at</strong>ion Co oil & Gas 78 921 128 0.56% 0.56%<br />
mDC <strong>Holding</strong>s inc Consumer Goods 24 749 189 0.50% 0.50%<br />
mDu resources Group inc industrials 162 471 377 0.67% 0.67%<br />
mead Johnson nutrition Co Consumer Goods 642 114 774 0.77% 0.77%<br />
meadWestvaco Corp industrials 205 491 419 0.67% 0.67%<br />
medassets inc technology 16 826 701 0.52% 0.52%<br />
medco Health solutions inc Health Care 871 136 616 0.67% 0.67%<br />
medical Properties trust inc Financials 43 339 079 0.66% 0.66%<br />
medicines Co/the Health Care 33 450 201 0.55% 0.55%<br />
medicis Pharmaceutical Corp Health Care 87 5<strong>31</strong> 371 0.70% 0.70%<br />
mediv<strong>at</strong>ion inc Health Care 64 072 042 0.67% 0.67%<br />
mednax inc Health Care 141 635 112 0.67% 0.67%<br />
medtronic inc Health Care 1 698 372 679 0.70% 0.70%<br />
memC electronic m<strong>at</strong>erials inc technology 83 558 836 1.54% 1.54%<br />
men’s Wearhouse inc/the Consumer services 69 233 206 0.70% 0.70%<br />
mentor Graphics Corp technology 61 033 453 0.69% 0.69%<br />
mercadolibre inc Consumer services 322 160 740 1.54% 1.54%<br />
merck & Co inc Health Care 5 <strong>31</strong>1 652 556 0.77% 0.77%<br />
mercury General Corp Financials 52 503 026 0.35% 0.35%<br />
meredith Corp Consumer services 44 734 482 0.19% 0.51%<br />
meridian bioscience inc Health Care 26 974 563 0.58% 0.58%<br />
merit medical systems inc Health Care 22 250 209 0.66% 0.66%<br />
meritage Homes Corp Consumer Goods 27 856 223 0.62% 0.62%<br />
meritor inc industrials 19 487 458 0.65% 0.65%<br />
metabolix inc basic m<strong>at</strong>erials 2 296 809 0.25% 0.25%<br />
methode electronics inc industrials 11 502 677 0.63% 0.63%<br />
metlife inc Financials 2 485 396 664 1.26% 1.26%<br />
metroPCs Communic<strong>at</strong>ions inc telecommunic<strong>at</strong>ions 30 798 246 0.16% 0.16%<br />
mettler-toledo intern<strong>at</strong>ional inc industrials 187 551 686 0.67% 0.67%<br />
mF <strong>Global</strong> <strong>Holding</strong>s ltd Financials 9 163 0.01% 0.01%<br />
mFa Financial inc Financials 100 379 107 0.70% 0.70%<br />
mFC industrial ltd basic m<strong>at</strong>erials 17 945 390 0.69% 0.69%<br />
mGe energy inc utilities 40 422 585 0.63% 0.63%<br />
mGiC investment Corp Financials 35 564 658 0.79% 0.79%<br />
mGm resorts intern<strong>at</strong>ional Consumer services 157 284 847 0.52% 0.52%<br />
micrel inc technology 20 193 063 0.54% 0.54%<br />
microchip technology inc technology 283 050 841 0.68% 0.68%<br />
micron technology inc technology 332 132 342 0.90% 0.90%<br />
miCros systems inc technology 153 917 572 0.69% 0.69%<br />
microsemi Corp technology 59 887 0<strong>31</strong> 0.69% 0.69%<br />
micros<strong>of</strong>t Corp technology 8 984 472 914 0.69% 0.69%<br />
microstr<strong>at</strong>egy inc technology 36 444 818 0.16% 0.52%<br />
mid-america apartment Communities inc Financials 93 774 759 0.66% 0.66%<br />
middleby Corp Consumer Goods 72 041 217 0.69% 0.69%<br />
mine safety appliances Co industrials 34 005 762 0.47% 0.47%<br />
minerals technologies inc basic m<strong>at</strong>erials 41 478 072 0.70% 0.70%<br />
mKs instruments inc technology 60 335 705 0.69% 0.69%<br />
mobile mini inc industrials 32 539 083 0.69% 0.69%<br />
modine manufacturing Co Consumer Goods 17 4<strong>31</strong> 096 0.66% 0.66%<br />
mohawk industries inc Consumer Goods 164 878 694 0.67% 0.67%<br />
molex inc industrials 132 775 499 0.51% 0.58%<br />
molina Healthcare inc Health Care <strong>31</strong> 107 358 0.51% 0.51%<br />
molson Coors brewing Co Consumer Goods 268 427 208 0.57% 0.57%<br />
molycorp inc basic m<strong>at</strong>erials 60 686 407 0.51% 0.51%<br />
momenta Pharmaceuticals inc Health Care 32 407 482 0.61% 0.61%<br />
monolithic Power systems inc technology 20 128 172 0.66% 0.66%<br />
monro muffler brake inc Consumer services 50 784 838 0.71% 0.71%<br />
monsanto Co Consumer Goods 1 661 423 466 0.74% 0.74%<br />
monster beverage Corp Consumer Goods 245 647 681 0.51% 0.51%<br />
monster Worldwide inc industrials 41 136 286 0.67% 0.67%<br />
montpelier re <strong>Holding</strong>s ltd Financials 48 738 799 0.75% 0.75%<br />
moody’s Corp Financials 302 338 202 0.68% 0.68%<br />
moog inc industrials 76 782 851 0.36% 0.64%<br />
morgan stanley Financials 502 989 304 0.29% 0.29%<br />
morningstar inc Consumer services 63 501 142 0.36% 0.36%<br />
mosaic Co/the basic m<strong>at</strong>erials 825 380 959 0.60% 0.60%<br />
motorola mobility <strong>Holding</strong>s inc technology 745 790 3<strong>31</strong> 1.08% 1.08%<br />
motorola solutions inc technology 777 382 763 0.86% 0.86%<br />
move inc Financials 9 573 857 0.66% 0.66%<br />
msC industrial Direct Co industrials 136 345 840 0.15% 0.50%<br />
msCi inc Financials 216 643 995 0.91% 0.91%<br />
mts systems Corp industrials 26 059 935 0.68% 0.68%<br />
Country associ<strong>at</strong>ion according to Ftse (the benchmark provider for <strong>equities</strong>). if a company is not in the benchmark, the country <strong>of</strong> incorpor<strong>at</strong>ion is listed. sector classific<strong>at</strong>ion according to iCb (the industry Classific<strong>at</strong>ion<br />
benchmark company).<br />
voting<br />
ownership<br />
HOLdiNgs<br />
41<br />
<strong>Government</strong> <strong>Pension</strong> FunD <strong>Global</strong> ANNUAL REPORT 2011
<strong>Government</strong> <strong>Pension</strong> <strong>Fund</strong> <strong>Global</strong> <strong>Holding</strong> <strong>of</strong> <strong>equities</strong> <strong>at</strong> <strong>31</strong> December 2011<br />
sector<br />
market value<br />
(noK)<br />
mueller industries inc industrials 57 191 695 0.65% 0.65%<br />
mueller W<strong>at</strong>er Products inc industrials 13 851 881 0.61% 0.61%<br />
multi-Fineline electronix inc industrials 8 401 179 0.28% 0.28%<br />
murphy oil Corp oil & Gas 435 736 210 0.68% 0.68%<br />
mWi veterinary supply inc industrials 35 268 825 0.70% 0.70%<br />
myers industries inc industrials 11 652 033 0.47% 0.47%<br />
mylan inc/Pa Health Care 702 172 140 1.29% 1.29%<br />
mYr Group inc/Delaware industrials 18 108 223 0.78% 0.78%<br />
myriad Genetics inc Health Care 73 158 028 0.69% 0.69%<br />
nabi biopharmaceuticals Health Care 124 113 0.03% 0.03%<br />
nabors industries ltd oil & Gas 201 301 708 0.68% 0.68%<br />
naCCo industries inc industrials 22 438 950 0.19% 0.50%<br />
nam tai electronics inc industrials 7 327 351 0.52% 0.52%<br />
nasDaQ omX Group inc/the Financials 189 132 4<strong>31</strong> 0.73% 0.73%<br />
nash Finch Co Consumer services 12 843 3<strong>31</strong> 0.61% 0.61%<br />
n<strong>at</strong>ional beverage Corp Consumer Goods 8 225 097 0.19% 0.19%<br />
n<strong>at</strong>ional Cinemedia inc Consumer services 28 181 070 0.69% 0.69%<br />
n<strong>at</strong>ional Financial Partners Corp Financials 34 697 937 1.04% 1.04%<br />
n<strong>at</strong>ional Fuel Gas Co utilities 880 472 204 3.20% 3.20%<br />
n<strong>at</strong>ional Health investors inc Financials 48 238 392 0.66% 0.66%<br />
n<strong>at</strong>ional Healthcare Corp Health Care 17 483 243 0.51% 0.51%<br />
n<strong>at</strong>ional instruments Corp industrials 94 847 853 0.51% 0.51%<br />
n<strong>at</strong>ional interst<strong>at</strong>e Corp Financials 2 903 510 0.10% 0.10%<br />
n<strong>at</strong>ional oilwell varco inc oil & Gas 1 009 236 559 0.59% 0.59%<br />
n<strong>at</strong>ional Penn bancshares inc Financials 51 341 377 0.67% 0.67%<br />
n<strong>at</strong>ional Presto industries inc Consumer Goods 17 157 403 0.45% 0.45%<br />
n<strong>at</strong>ional retail Properties inc Financials 111 179 <strong>31</strong>4 0.69% 0.69%<br />
n<strong>at</strong>us medical inc Health Care 11 045 694 0.67% 0.67%<br />
navigant Consulting inc industrials 22 712 516 0.64% 0.64%<br />
navig<strong>at</strong>ors Group inc/the Financials 22 502 076 0.55% 0.55%<br />
navios maritime <strong>Holding</strong>s inc industrials 9 641 777 0.45% 0.45%<br />
navistar intern<strong>at</strong>ional Corp industrials 107 594 505 0.68% 0.68%<br />
nbt bancorp inc Financials <strong>31</strong> 110 <strong>31</strong>8 0.71% 0.71%<br />
nCr Corp technology 104 130 628 0.67% 0.67%<br />
nektar therapeutics Health Care 25 093 130 0.66% 0.66%<br />
nelnet inc Financials 15 926 657 0.07% 0.22%<br />
neogen Corp Health Care 29 161 095 0.68% 0.68%<br />
net 1 uePs technologies inc industrials 13 945 515 0.68% 0.68%<br />
netapp inc technology 454 869 733 0.59% 0.59%<br />
netflix inc Consumer services 162 952 225 0.71% 0.71%<br />
netgear inc technology 50 546 611 0.67% 0.67%<br />
netlogic microsystems inc technology 140 912 427 0.69% 0.69%<br />
netscout systems inc technology 30 233 014 0.69% 0.69%<br />
netsuite inc technology 41 043 989 0.25% 0.25%<br />
neustar inc industrials 58 070 252 0.39% 0.39%<br />
neutral tandem inc technology 14 682 841 0.73% 0.73%<br />
new Jersey resources Corp utilities 79 893 095 0.66% 0.66%<br />
new York Community bancorp inc Financials 218 551 420 0.68% 0.68%<br />
new York times Co/the Consumer services 48 133 978 0.71% 0.71%<br />
newell rubbermaid inc Consumer Goods 188 858 696 0.68% 0.68%<br />
newfield explor<strong>at</strong>ion Co oil & Gas 202 500 337 0.67% 0.67%<br />
newmarket Corp basic m<strong>at</strong>erials 111 289 712 0.70% 0.70%<br />
newmont mining Corp basic m<strong>at</strong>erials 1 763 519 805 0.99% 0.99%<br />
newpark resources inc oil & Gas 34 647 372 0.67% 0.67%<br />
newport Corp industrials 19 256 945 0.63% 0.63%<br />
news Corp Consumer services 2 366 5<strong>31</strong> 797 0.50% 0.84%<br />
nextera energy inc utilities 1 294 108 502 0.84% 0.84%<br />
niC inc technology 28 039 836 0.55% 0.55%<br />
nielsen <strong>Holding</strong>s nv Consumer services 128 479 866 0.20% 0.20%<br />
nii <strong>Holding</strong>s inc telecommunic<strong>at</strong>ions 1 204 286 242 5.53% 5.53%<br />
niKe inc Consumer Goods 1 108 052 068 0.42% 0.42%<br />
nisource inc utilities 268 627 349 0.67% 0.67%<br />
noble Corp oil & Gas 227 058 687 0.50% 0.50%<br />
noble energy inc oil & Gas 1 135 536 735 1.14% 1.14%<br />
nordic american tankers ltd industrials 20 944 860 0.62% 0.62%<br />
nordson Corp industrials 72 709 624 0.45% 0.45%<br />
nordstrom inc Consumer services 197 729 902 0.32% 0.32%<br />
norfolk southern Corp industrials 800 189 015 0.55% 0.55%<br />
northeast utilities utilities 72 299 413 0.19% 0.19%<br />
northern oil and Gas inc oil & Gas 89 538 675 0.99% 0.99%<br />
northern trust Corp Financials 246 229 353 0.43% 0.43%<br />
northstar realty Finance Corp Financials 21 649 075 0.79% 0.79%<br />
northwest bancshares inc Financials 53 576 455 0.74% 0.74%<br />
northwest n<strong>at</strong>ural Gas Co utilities 48 175 504 0.63% 0.63%<br />
northwest Pipe Co industrials 9 002 158 0.71% 0.71%<br />
northWestern Corp utilities 48 959 1<strong>31</strong> 0.63% 0.63%<br />
novellus systems inc technology 111 532 367 0.68% 0.68%<br />
nrG energy inc utilities 106 705 219 0.43% 0.43%<br />
nstar utilities 200 506 990 0.69% 0.69%<br />
ntelos <strong>Holding</strong>s Corp telecommunic<strong>at</strong>ions 389 327 0.02% 0.02%<br />
nu skin enterprises inc Consumer Goods 124 256 294 0.69% 0.69%<br />
nuance Communic<strong>at</strong>ions inc technology 302 530 118 0.67% 0.67%<br />
nucor Corp basic m<strong>at</strong>erials 293 685 204 0.39% 0.39%<br />
nutrisystem inc Consumer Goods 13 711 091 0.63% 0.63%<br />
nuvasive inc Health Care 20 992 534 0.66% 0.66%<br />
nv energy inc utilities 194 435 172 0.84% 0.84%<br />
nviDia Corp technology 358 128 422 0.71% 0.71%<br />
nvr inc Consumer Goods 137 579 330 0.68% 0.68%<br />
nXP semiconductor nv technology 115 767 948 0.50% 0.50%<br />
nxstage medical inc Health Care 27 715 653 0.47% 0.47%<br />
nYse euronext Financials 320 083 235 0.78% 0.78%<br />
voting<br />
ownership<br />
sector<br />
market value<br />
(noK)<br />
oasis Petroleum inc oil & Gas 88 215 089 0.55% 0.55%<br />
occidental Petroleum Corp oil & Gas 3 559 446 058 0.78% 0.78%<br />
oceaneering intern<strong>at</strong>ional inc oil & Gas 243 032 064 0.82% 0.82%<br />
ocwen Financial Corp Financials 72 672 156 0.65% 0.65%<br />
<strong>of</strong>fice Depot inc Consumer services 23 342 298 0.65% 0.65%<br />
<strong>of</strong>ficemax inc Consumer services 15 195 025 0.65% 0.65%<br />
oGe energy Corp oil & Gas 657 579 455 1.98% 1.98%<br />
oil st<strong>at</strong>es intern<strong>at</strong>ional inc oil & Gas 160 161 135 0.69% 0.69%<br />
old Dominion Freight line inc industrials 90 594 599 0.65% 0.65%<br />
old n<strong>at</strong>ional bancorp/in Financials 47 821 659 0.73% 0.73%<br />
old republic intern<strong>at</strong>ional Corp Financials 101 184 582 0.71% 0.71%<br />
olin Corp basic m<strong>at</strong>erials 61 761 415 0.66% 0.66%<br />
om Group inc basic m<strong>at</strong>erials <strong>31</strong> 023 914 0.72% 0.72%<br />
omega Healthcare investors inc Financials 82 328 460 0.69% 0.69%<br />
omnicare inc Consumer services 158 891 484 0.68% 0.68%<br />
omnicell inc Health Care 21 133 571 0.65% 0.65%<br />
omnicom Group inc Consumer services 952 402 144 1.30% 1.30%<br />
omnivision technologies inc technology 28 736 401 0.67% 0.67%<br />
on semiconductor Corp technology 141 247 777 0.68% 0.68%<br />
oneok inc utilities 361 925 988 0.68% 0.68%<br />
onyx Pharmaceuticals inc Health Care 382 328 538 2.29% 2.29%<br />
opentable inc Consumer services 27 036 693 0.49% 0.49%<br />
opko Health inc Health Care 18 328 402 0.22% 0.22%<br />
opnet technologies inc technology 24 655 485 0.50% 0.50%<br />
oracle Corp technology 5 288 512 779 0.69% 0.69%<br />
orbital sciences Corp industrials 35 387 504 0.69% 0.69%<br />
orbitz Worldwide inc Consumer services 5 919 269 0.25% 0.25%<br />
o’reilly automotive inc Consumer services 416 620 809 0.68% 0.68%<br />
oriental Financial Group inc Financials 22 749 018 0.73% 0.73%<br />
orient-express Hotels ltd Consumer services 30 346 763 0.24% 0.56%<br />
oritani Financial Corp Financials 28 <strong>31</strong>3 807 0.81% 0.81%<br />
orm<strong>at</strong> technologies inc utilities 27 806 545 0.57% 0.57%<br />
orth<strong>of</strong>ix intern<strong>at</strong>ional nv Health Care 27 3<strong>31</strong> 983 0.71% 0.71%<br />
oshkosh Corp industrials 76 574 598 0.66% 0.66%<br />
osi systems inc industrials 33 634 156 0.59% 0.59%<br />
otter tail Corp industrials 35 407 075 0.75% 0.75%<br />
overseas shipholding Group inc industrials 12 329 586 0.62% 0.62%<br />
overstock.com inc Consumer services 3 560 201 0.33% 0.33%<br />
owens & minor inc Health Care 68 923 499 0.66% 0.66%<br />
owens Corning industrials 177 271 843 0.86% 0.86%<br />
owens-illinois inc industrials 202 510 124 1.07% 1.07%<br />
oxford industries inc Consumer Goods 34 820 347 0.78% 0.78%<br />
PaCCar inc industrials 603 997 612 0.75% 0.75%<br />
Pacific sunwear <strong>of</strong> California inc Consumer services 137 433 0.02% 0.02%<br />
Packaging Corp <strong>of</strong> america industrials 101 154 9<strong>31</strong> 0.68% 0.68%<br />
Pall Corp industrials 570 940 902 1.45% 1.45%<br />
Panera bread Co Consumer services 165 340 989 0.59% 0.64%<br />
Pantry inc/the Consumer services 6 917 540 0.43% 0.43%<br />
Papa John’s intern<strong>at</strong>ional inc Consumer services 27 209 105 0.50% 0.50%<br />
Par Pharmaceutical Cos inc Health Care 47 448 440 0.67% 0.67%<br />
Parametric technology Corp technology 88 442 940 0.68% 0.68%<br />
PareXel intern<strong>at</strong>ional Corp Health Care 48 233 495 0.66% 0.66%<br />
Park electrochemical Corp industrials 20 383 867 0.64% 0.64%<br />
Park n<strong>at</strong>ional Corp Financials 40 573 943 0.68% 0.68%<br />
Parker Drilling Co oil & Gas <strong>31</strong> 322 770 0.63% 0.63%<br />
Parker Hannifin Corp industrials 434 878 086 0.63% 0.63%<br />
Parkway Properties inc/md Financials 9 336 658 0.72% 0.72%<br />
Partnerre ltd Financials 179 133 555 0.69% 0.69%<br />
P<strong>at</strong>riot Coal Corp basic m<strong>at</strong>erials 30 239 752 0.65% 0.65%<br />
P<strong>at</strong>terson Cos inc Health Care 144 520 722 0.74% 0.74%<br />
P<strong>at</strong>terson-uti energy inc oil & Gas 123 505 678 0.67% 0.67%<br />
Paychex inc industrials 437 675 862 0.67% 0.67%<br />
PDl bioPharma inc Health Care 33 <strong>31</strong>0 485 0.64% 0.64%<br />
Peabody energy Corp basic m<strong>at</strong>erials 397 110 801 0.74% 0.74%<br />
Pebblebrook Hotel trust Financials 37 <strong>31</strong>7 971 0.64% 0.64%<br />
Peet’s C<strong>of</strong>fee & tea inc Consumer services 32 470 494 0.67% 0.67%<br />
Pegasystems inc technology 18 919 958 0.29% 0.29%<br />
Penn n<strong>at</strong>ional Gaming inc Consumer services 124 026 811 0.70% 0.70%<br />
Penn virginia Corp oil & Gas 9 741 506 0.68% 0.68%<br />
Pennsylvania real est<strong>at</strong>e investment trust Financials 22 342 840 0.64% 0.64%<br />
Penske automotive Group inc Consumer services 35 416 602 0.34% 0.34%<br />
Pentair inc industrials 628 567 177 3.21% 3.21%<br />
People’s united Financial inc Financials 187 678 544 0.68% 0.68%<br />
PeP boys-manny moe & Jack Consumer services 23 799 104 0.69% 0.69%<br />
Pepco <strong>Holding</strong>s inc utilities 185 008 074 0.67% 0.67%<br />
PepsiCo inc/nC Consumer Goods 4 194 309 912 0.68% 0.68%<br />
Perficient inc technology 10 270 897 0.56% 0.56%<br />
Pericom semiconductor Corp technology 2 549 932 0.23% 0.23%<br />
Perkinelmer inc industrials 95 328 811 0.71% 0.71%<br />
Perrigo Co Health Care 590 001 108 1.09% 1.09%<br />
Petroleum Development Corp oil & Gas 36 114 357 0.73% 0.73%<br />
Petroquest energy inc oil & Gas 15 334 837 0.61% 0.61%<br />
Petsmart inc Consumer services 230 658 146 0.68% 0.68%<br />
PF Chang’s China bistro inc Consumer services 30 879 060 0.79% 0.79%<br />
Pfizer inc Health Care 7 143 553 509 0.72% 0.72%<br />
PG&e Corp utilities 2 206 300 411 2.21% 2.21%<br />
PH Gl<strong>at</strong>felter Co basic m<strong>at</strong>erials 23 784 489 0.65% 0.65%<br />
Pharmacyclics inc Health Care 40 726 366 0.67% 0.67%<br />
Pharmasset inc Health Care 390 453 578 0.67% 0.67%<br />
Pharmerica Corp Health Care 16 536 390 0.62% 0.62%<br />
PHH Corp industrials 22 626 793 0.63% 0.63%<br />
Country associ<strong>at</strong>ion according to Ftse (the benchmark provider for <strong>equities</strong>). if a company is not in the benchmark, the country <strong>of</strong> incorpor<strong>at</strong>ion is listed. sector classific<strong>at</strong>ion according to iCb (the industry Classific<strong>at</strong>ion<br />
benchmark company).<br />
voting<br />
ownership<br />
HOLdiNgs<br />
42<br />
<strong>Government</strong> <strong>Pension</strong> FunD <strong>Global</strong> ANNUAL REPORT 2011
<strong>Government</strong> <strong>Pension</strong> <strong>Fund</strong> <strong>Global</strong> <strong>Holding</strong> <strong>of</strong> <strong>equities</strong> <strong>at</strong> <strong>31</strong> December 2011<br />
sector<br />
market value<br />
(noK)<br />
PHi inc oil & Gas 15 380 414 0.00% 0.68%<br />
Phoenix Cos inc/the Financials 36 250 359 3.11% 3.11%<br />
PiCo <strong>Holding</strong>s inc Financials 24 496 654 0.88% 0.88%<br />
Piedmont n<strong>at</strong>ural Gas Co inc utilities 97 578 539 0.67% 0.67%<br />
Piedmont <strong>of</strong>fice realty trust inc Financials 118 090 275 0.67% 0.67%<br />
Pier 1 imports inc Consumer services 64 485 276 0.71% 0.71%<br />
Pike electric Corp industrials 4 338 586 0.29% 0.29%<br />
Pinnacle entertainment inc Consumer services 23 523 226 0.62% 0.62%<br />
Pinnacle Financial Partners inc Financials 23 800 379 0.72% 0.72%<br />
Pinnacle West Capital Corp utilities 611 666 347 1.95% 1.95%<br />
Pioneer Drilling Co oil & Gas 30 383 772 0.85% 0.85%<br />
Pioneer n<strong>at</strong>ural resources Co oil & Gas 441 630 7<strong>31</strong> 0.68% 0.68%<br />
Piper Jaffray Cos Financials 15 307 527 0.66% 0.66%<br />
Pitney bowes inc technology 203 348 047 0.92% 0.92%<br />
Plains explor<strong>at</strong>ion & Production Co oil & Gas 208 694 599 0.68% 0.68%<br />
Plantronics inc technology 66 134 320 0.71% 0.71%<br />
Pl<strong>at</strong>inum underwriters <strong>Holding</strong>s ltd Financials 50 954 392 0.67% 0.67%<br />
Plexus Corp industrials 39 403 035 0.70% 0.70%<br />
Plum Creek timber Co inc Financials 263 697 521 0.75% 0.75%<br />
PmC - sierra inc technology 55 180 293 0.73% 0.73%<br />
Pmi Group inc/the Financials <strong>31</strong>7 511 1.21% 1.21%<br />
PnC Financial services Group inc Financials 1 619 594 471 0.89% 0.89%<br />
Pnm resources inc utilities 63 610 904 0.67% 0.67%<br />
Polaris industries inc Consumer Goods 156 023 433 0.68% 0.68%<br />
Polycom inc technology 118 895 485 0.69% 0.69%<br />
Polyone Corp basic m<strong>at</strong>erials 44 707 883 0.71% 0.71%<br />
Polypore intern<strong>at</strong>ional inc basic m<strong>at</strong>erials 129 018 065 1.06% 1.06%<br />
Pool Corp Consumer Goods 62 163 333 0.73% 0.73%<br />
Popular inc Financials 56 580 738 0.67% 0.67%<br />
Portfolio recovery associ<strong>at</strong>es inc Financials 47 983 193 0.70% 0.70%<br />
Portland General electric Co utilities 101 157 600 0.89% 0.89%<br />
Post Properties inc Financials 89 021 050 0.66% 0.66%<br />
Potl<strong>at</strong>ch Corp Financials 48 633 660 0.65% 0.65%<br />
Powell industries inc industrials 9 263 496 0.42% 0.42%<br />
Power integr<strong>at</strong>ions inc technology 36 841 734 0.66% 0.66%<br />
Power-one inc industrials 26 204 197 1.08% 1.08%<br />
Powerwave technologies inc industrials 2 357 504 0.60% 0.60%<br />
PPG industries inc basic m<strong>at</strong>erials 299 177 225 0.39% 0.39%<br />
PPl Corp utilities 1 058 893 660 1.04% 1.04%<br />
Praxair inc basic m<strong>at</strong>erials 1 125 101 982 0.59% 0.59%<br />
Precision Castparts Corp industrials 1 166 943 <strong>31</strong>3 0.82% 0.82%<br />
Premiere <strong>Global</strong> services inc technology 19 771 251 0.78% 0.78%<br />
Presidential life Corp Financials 7 479 783 0.42% 0.42%<br />
Prestige brands <strong>Holding</strong>s inc Health Care 24 362 078 0.72% 0.72%<br />
priceline.com inc Consumer services 1 016 714 477 0.73% 0.73%<br />
Pricesmart inc Consumer services 84 089 819 0.68% 0.68%<br />
Primerica inc Financials 45 960 663 0.51% 0.51%<br />
Principal Financial Group inc Financials 303 696 469 0.68% 0.68%<br />
Priv<strong>at</strong>ebancorp inc Financials 32 555 142 0.69% 0.69%<br />
Proassurance Corp Financials 102 465 893 0.70% 0.70%<br />
Procter & Gamble Co/the Consumer Goods 7 423 161 218 0.68% 0.68%<br />
Progress energy inc utilities 1 006 661 946 1.02% 1.02%<br />
Progress s<strong>of</strong>tware Corp technology 52 883 758 0.72% 0.72%<br />
Progressive Corp/the Financials 289 909 374 0.40% 0.40%<br />
Prologis inc Financials 567 324 112 0.73% 0.73%<br />
Prosperity bancshares inc Financials 56 368 774 0.50% 0.50%<br />
Protective life Corp Financials 76 187 012 0.68% 0.68%<br />
Provident Financial services inc Financials 32 729 487 0.68% 0.68%<br />
Provident new York bancorp Financials 7 871 862 0.52% 0.52%<br />
Prudential Financial inc Financials 2 187 636 804 1.50% 1.50%<br />
Ps business Parks inc Financials 41 004 082 0.51% 0.51%<br />
Pss World medical inc Health Care 52 850 910 0.69% 0.69%<br />
Public service enterprise Group inc utilities 96 842 258 0.10% 0.10%<br />
Public storage Financials 693 188 087 0.50% 0.48%<br />
Pulte Group inc Consumer Goods 94 332 888 0.65% 0.65%<br />
PvH Corp Consumer Goods 192 730 700 0.68% 0.68%<br />
QeP resources inc oil & Gas 207 835 686 0.67% 0.67%<br />
QliK technologies inc technology 80 922 574 0.67% 0.67%<br />
Qlogic Corp technology 65 343 771 0.73% 0.73%<br />
Qlt inc Health Care 15 237 377 0.72% 0.72%<br />
QualComm inc technology 3 800 590 378 0.69% 0.69%<br />
Quality systems inc technology 64 369 355 0.50% 0.50%<br />
Quanex building Products Corp industrials 25 025 128 0.76% 0.76%<br />
Quanta services inc industrials 341 712 718 1.29% 1.29%<br />
Quest Diagnostics inc Health Care 371 393 064 0.68% 0.68%<br />
Quest s<strong>of</strong>tware inc technology 50 961 211 0.55% 0.55%<br />
Questar Corp utilities 155 203 543 0.74% 0.74%<br />
Questcor Pharmaceuticals inc Health Care 102 548 634 0.66% 0.66%<br />
Quicksilver resources inc oil & Gas 16 347 748 0.24% 0.24%<br />
Quidel Corp Health Care 21 650 233 0.72% 0.72%<br />
Quiksilver inc Consumer Goods 19 152 818 0.54% 0.54%<br />
rackspace Hosting inc technology 224 984 697 0.67% 0.67%<br />
radian Group inc Financials 15 041 802 0.81% 0.81%<br />
radioshack Corp Consumer services 41 770 071 0.72% 0.72%<br />
ralcorp <strong>Holding</strong>s inc Consumer Goods 191 407 608 0.68% 0.68%<br />
ralph lauren Corp Consumer Goods 356 128 353 0.12% 0.47%<br />
rambus inc technology 38 636 083 0.78% 0.78%<br />
ramco-Gershenson Properties trust Financials 17 388 408 0.76% 0.76%<br />
range resources Corp oil & Gas 426 196 855 0.71% 0.71%<br />
raven industries inc industrials 46 493 603 0.70% 0.70%<br />
raymond James Financial inc Financials 157 426 912 0.68% 0.68%<br />
voting<br />
ownership<br />
sector<br />
market value<br />
(noK)<br />
rayonier inc Financials 272 530 518 0.84% 0.84%<br />
rbC bearings inc industrials 37 615 969 0.68% 0.68%<br />
realnetworks inc Consumer services 7 432 336 0.48% 0.48%<br />
realPage inc technology 17 788 051 0.16% 0.16%<br />
realty income Corp Financials 182 654 <strong>31</strong>3 0.66% 0.66%<br />
red H<strong>at</strong> inc technology 268 547 335 0.57% 0.57%<br />
red robin Gourmet burgers inc Consumer services 14 511 272 0.60% 0.60%<br />
redwood trust inc Financials 32 145 042 0.67% 0.67%<br />
regal entertainment Group Consumer services 62 764 376 0.24% 0.57%<br />
regal-beloit Corp industrials 195 134 670 1.54% 1.54%<br />
regency Centers Corp Financials 134 706 098 0.67% 0.67%<br />
regeneron Pharmaceuticals inc Health Care 198 199 906 0.54% 0.65%<br />
regions Financial Corp Financials 62 692 846 0.19% 0.19%<br />
regis Corp Consumer services 38 568 530 0.68% 0.68%<br />
reinsurance Group <strong>of</strong> america inc Financials 155 072 013 0.68% 0.68%<br />
reliance steel & aluminum Co basic m<strong>at</strong>erials 145 964 178 0.67% 0.67%<br />
renaissancere <strong>Holding</strong>s ltd Financials 158 011 543 0.69% 0.69%<br />
renasant Corp Financials 16 173 532 0.72% 0.72%<br />
rent-a-Center inc/tX Consumer services 93 170 764 0.72% 0.72%<br />
republic airways <strong>Holding</strong>s inc Consumer services 106 833 0.01% 0.01%<br />
republic bancorp inc/KY Financials 13 734 802 0.24% 0.48%<br />
republic services inc industrials 591 656 793 0.97% 0.97%<br />
resaca exploit<strong>at</strong>ion inc oil & Gas 417 757 0.41% 0.41%<br />
resmed inc Health Care 370 599 453 0.40% 1.67%<br />
resources Connection inc industrials 20 569 707 0.74% 0.74%<br />
rex energy Corp oil & Gas 22 200 904 0.57% 0.57%<br />
rF micro Devices inc technology 61 047 <strong>31</strong>2 0.68% 0.68%<br />
rigel Pharmaceuticals inc Health Care 22 240 568 0.66% 0.66%<br />
rite aid Corp Consumer services 33 047 521 0.49% 0.49%<br />
riverbed technology inc technology 150 283 168 0.69% 0.69%<br />
rli Corp Financials 63 799 239 0.70% 0.70%<br />
rlJ lodging trust Financials 48 913 366 0.46% 0.46%<br />
robbins & myers inc industrials 83 204 907 0.63% 0.63%<br />
robert Half intern<strong>at</strong>ional inc industrials 166 652 849 0.69% 0.69%<br />
rock-tenn Co industrials 203 128 355 0.84% 0.84%<br />
rockwell autom<strong>at</strong>ion inc industrials 415 826 630 0.67% 0.67%<br />
rockwell Collins inc industrials 338 7<strong>31</strong> <strong>31</strong>0 0.69% 0.69%<br />
rockwood <strong>Holding</strong>s inc basic m<strong>at</strong>erials 120 715 880 0.67% 0.67%<br />
r<strong>of</strong>in-sinar technologies inc industrials 24 389 083 0.63% 0.63%<br />
rogers Corp industrials 23 641 104 0.66% 0.66%<br />
rollins inc Consumer services 64 792 460 0.33% 0.33%<br />
roper industries inc industrials 328 977 076 0.66% 0.66%<br />
rosetta resources inc oil & Gas 96 499 120 0.70% 0.70%<br />
ross stores inc Consumer services 219 523 594 0.34% 0.34%<br />
rovi Corp technology 110 912 807 0.69% 0.69%<br />
rowan Cos inc oil & Gas 156 643 895 0.69% 0.69%<br />
royal Caribbean Cruises ltd Consumer services 163 503 525 0.51% 0.51%<br />
royal Gold inc basic m<strong>at</strong>erials 149 674 467 0.68% 0.68%<br />
rPC inc oil & Gas 42 642 217 0.26% 0.26%<br />
rPm intern<strong>at</strong>ional inc basic m<strong>at</strong>erials 127 702 786 0.67% 0.67%<br />
rr Donnelley & sons Co industrials 108 584 287 0.67% 0.67%<br />
rsC <strong>Holding</strong>s inc industrials 23 393 051 0.20% 0.20%<br />
rti intern<strong>at</strong>ional metals inc basic m<strong>at</strong>erials 27 567 340 0.66% 0.66%<br />
rubicon technology inc industrials 13 107 534 1.04% 1.04%<br />
ruby tuesday inc Consumer services 18 126 150 0.69% 0.69%<br />
ruddick Corp Consumer services 63 115 253 0.50% 0.50%<br />
rudolph technologies inc technology 10 249 558 0.58% 0.58%<br />
rush enterprises inc Consumer services 23 366 710 0.08% 0.49%<br />
ryder system inc industrials 111 207 847 0.69% 0.69%<br />
ryland Group inc Consumer Goods 29 968 428 0.72% 0.72%<br />
s&t bancorp inc Financials 24 514 019 0.75% 0.75%<br />
s1 Corp technology 36 992 844 1.17% 1.17%<br />
sabra Health Care reit inc Financials 18 574 944 0.70% 0.70%<br />
safety insurance Group inc Financials 24 687 328 0.67% 0.67%<br />
safeway inc Consumer services 123 258 650 0.29% 0.29%<br />
saiC inc technology 169 678 147 0.68% 0.68%<br />
saks inc Consumer services 63 908 334 0.69% 0.69%<br />
salesforce.com inc technology 440 954 086 0.54% 0.54%<br />
salix Pharmaceuticals ltd Health Care 113 700 835 0.67% 0.67%<br />
sally beauty <strong>Holding</strong>s inc Consumer services 116 439 527 0.50% 0.50%<br />
sanderson Farms inc Consumer Goods 43 565 920 0.65% 0.65%<br />
sanDisk Corp technology 1 944 585 841 2.76% 2.76%<br />
sandridge energy inc oil & Gas 146 796 236 0.73% 0.73%<br />
sandy spring bancorp inc Financials 15 887 635 0.63% 0.63%<br />
sanmina-sCi Corp industrials 28 014 611 0.62% 0.62%<br />
sapient Corp technology 53 044 4<strong>31</strong> 0.50% 0.50%<br />
sara lee Corp Consumer Goods 447 610 342 0.67% 0.67%<br />
sauer-Danfoss inc industrials 21 021 940 0.20% 0.20%<br />
saul Centers inc Financials 19 3<strong>31</strong> 562 0.47% 0.47%<br />
savient Pharmaceuticals inc Health Care 5 605 885 0.59% 0.59%<br />
sba Communic<strong>at</strong>ions Corp telecommunic<strong>at</strong>ions 13 551 900 0.05% 0.05%<br />
sCana Corp utilities 132 267 325 0.38% 0.38%<br />
scansource inc technology 39 713 676 0.68% 0.68%<br />
schawk inc Consumer services 7 351 452 0.43% 0.43%<br />
schlumberger ltd oil & Gas 4 158 765 042 0.76% 0.76%<br />
schnitzer steel industries inc industrials 43 093 060 0.28% 0.61%<br />
scholastic Corp Consumer services 38 747 577 0.74% 0.70%<br />
school specialty inc industrials 58 441 0.02% 0.02%<br />
schweitzer-mauduit intern<strong>at</strong>ional inc Consumer Goods 45 389 936 0.71% 0.71%<br />
scientific Games Corp Consumer services 28 010 169 0.53% 0.53%<br />
scotts miracle-Gro Co/the Consumer Goods 91 182 491 0.54% 0.54%<br />
Country associ<strong>at</strong>ion according to Ftse (the benchmark provider for <strong>equities</strong>). if a company is not in the benchmark, the country <strong>of</strong> incorpor<strong>at</strong>ion is listed. sector classific<strong>at</strong>ion according to iCb (the industry Classific<strong>at</strong>ion<br />
benchmark company).<br />
voting<br />
ownership<br />
HOLdiNgs<br />
43<br />
<strong>Government</strong> <strong>Pension</strong> FunD <strong>Global</strong> ANNUAL REPORT 2011
<strong>Government</strong> <strong>Pension</strong> <strong>Fund</strong> <strong>Global</strong> <strong>Holding</strong> <strong>of</strong> <strong>equities</strong> <strong>at</strong> <strong>31</strong> December 2011<br />
sector<br />
market value<br />
(noK)<br />
scripps networks interactive inc Consumer services 162 802 921 1.87% 0.40%<br />
seaboard Corp Consumer Goods <strong>31</strong> 543 337 0.21% 0.21%<br />
seaCor <strong>Holding</strong>s inc oil & Gas 80 020 172 0.69% 0.69%<br />
seag<strong>at</strong>e technology PlC technology 281 216 486 0.62% 0.62%<br />
sealed air Corp industrials 132 216 651 0.67% 0.67%<br />
sealy Corp Consumer Goods 95 207 0.01% 0.01%<br />
sears <strong>Holding</strong>s Corp Consumer services 69 268 345 0.34% 0.34%<br />
seaspan Corp industrials 39 428 871 0.70% 0.70%<br />
se<strong>at</strong>tle Genetics inc Health Care 87 146 939 0.76% 0.76%<br />
sei investments Co Financials 96 142 302 0.52% 0.52%<br />
select Comfort Corp Consumer Goods 48 932 866 0.67% 0.67%<br />
selective insurance Group inc Financials 36 306 870 0.63% 0.63%<br />
semGroup Corp oil & Gas <strong>31</strong> 986 936 0.49% 0.49%<br />
sempra energy utilities 1 <strong>31</strong>0 278 462 1.66% 1.66%<br />
semtech Corp technology 64 388 840 0.67% 0.67%<br />
senior Housing Properties trust Financials 147 470 904 0.68% 0.68%<br />
sens<strong>at</strong>a technologies <strong>Holding</strong> nv industrials 145 903 627 0.53% 0.53%<br />
sensient technologies Corp basic m<strong>at</strong>erials 80 903 <strong>31</strong>7 0.71% 0.71%<br />
sequenom inc Health Care 15 965 339 0.61% 0.61%<br />
service Corp intern<strong>at</strong>ional/us Consumer services 100 966 820 0.70% 0.70%<br />
servicesource intern<strong>at</strong>ional inc industrials 22 647 078 0.34% 0.34%<br />
shaw Group inc/the industrials 77 936 634 0.75% 0.75%<br />
shenandoah telecommunic<strong>at</strong>ions Co telecommunic<strong>at</strong>ions 9 392 750 0.63% 0.63%<br />
sherwin-Williams Co/the industrials 374 672 284 0.68% 0.68%<br />
ship Finance intern<strong>at</strong>ional ltd industrials 23 548 5<strong>31</strong> 0.53% 0.53%<br />
shuffle master inc Consumer services 27 927 250 0.74% 0.74%<br />
shutterfly inc Consumer services 32 067 282 0.68% 0.68%<br />
sigma Designs inc technology 8 574 440 0.74% 0.74%<br />
sigma-aldrich Corp basic m<strong>at</strong>erials 307 891 901 0.69% 0.69%<br />
sign<strong>at</strong>ure bank/new York nY Financials 111 478 359 0.67% 0.67%<br />
signet Jewelers ltd Consumer services 154 203 932 0.68% 0.68%<br />
silgan <strong>Holding</strong>s inc industrials 83 104 661 0.52% 0.52%<br />
silicon Graphics intern<strong>at</strong>ional Corp technology 13 726 553 0.64% 0.64%<br />
silicon image inc technology 14 473 500 0.63% 0.63%<br />
silicon labor<strong>at</strong>ories inc technology 54 938 587 0.51% 0.51%<br />
simmons First n<strong>at</strong>ional Corp Financials 17 648 491 0.63% 0.63%<br />
simon Property Group inc Financials 1 527 220 705 0.68% 0.68%<br />
simpson manufacturing Co inc industrials 46 738 425 0.48% 0.48%<br />
sina Corp/China technology 277 271 411 1.36% 1.36%<br />
sirius Xm radio inc Consumer services 152 596 001 0.37% 0.37%<br />
sirona Dental systems inc Health Care 97 506 752 0.66% 0.66%<br />
six Flags entertainment Corp Consumer services 79 890 971 0.59% 0.59%<br />
sJW Corp utilities 22 591 092 0.86% 0.86%<br />
skechers u.s.a. inc Consumer Goods 16 452 969 0.15% 0.46%<br />
skywest inc Consumer services 27 344 273 0.72% 0.72%<br />
skyworks solutions inc technology 120 702 235 0.66% 0.66%<br />
sl Green realty Corp Financials 230 028 523 0.67% 0.66%<br />
slm Corp Financials 281 057 227 0.69% 0.69%<br />
sm energy Co oil & Gas 218 465 363 0.78% 0.78%<br />
smithfield Foods inc Consumer Goods 165 250 824 0.71% 0.71%<br />
snap-on inc Consumer Goods 117 241 069 0.67% 0.67%<br />
snyders-lance inc Consumer Goods 45 361 955 0.50% 0.50%<br />
sohu.com inc technology 56 499 179 0.50% 0.50%<br />
solarWinds inc technology 41 494 047 0.34% 0.34%<br />
solazyme inc oil & Gas 33 472 986 0.79% 0.79%<br />
solera <strong>Holding</strong>s inc technology 126 364 601 0.67% 0.67%<br />
solutia inc basic m<strong>at</strong>erials 84 679 584 0.67% 0.67%<br />
sonic automotive inc Consumer services 28 251 490 0.20% 0.61%<br />
sonic Corp Consumer services 15 321 477 0.62% 0.62%<br />
sonoco Products Co industrials 132 605 786 0.67% 0.67%<br />
sonosite inc Health Care <strong>31</strong> 654 156 0.71% 0.71%<br />
sonus networks inc technology 28 302 879 0.71% 0.71%<br />
sotheby’s Consumer services 77 469 151 0.67% 0.67%<br />
sourcefire inc technology 30 834 888 0.55% 0.55%<br />
south Jersey industries inc utilities 67 914 984 0.66% 0.66%<br />
southern Co utilities 523 793 195 0.22% 0.22%<br />
southern Copper Corp basic m<strong>at</strong>erials 561 458 032 0.37% 0.37%<br />
southern union Co oil & Gas 237 140 742 0.76% 0.76%<br />
southwest airlines Co Consumer services 297 558 853 0.75% 0.75%<br />
southwest Gas Corp utilities 77 027 420 0.66% 0.66%<br />
southwestern energy Co oil & Gas 472 430 738 0.71% 0.71%<br />
sovran self storage inc Financials 48 760 592 0.69% 0.69%<br />
spansion inc technology 19 <strong>31</strong>3 509 0.66% 0.66%<br />
spartan stores inc Consumer services 17 884 621 0.71% 0.71%<br />
spectra energy Corp utilities 134 973 970 0.11% 0.11%<br />
spectrum brands <strong>Holding</strong>s inc Consumer Goods 28 618 283 0.34% 0.34%<br />
speedway motorsports inc Consumer services 9 537 420 0.25% 0.25%<br />
spirit aerosystems <strong>Holding</strong>s inc industrials 99 739 252 0.17% 0.52%<br />
sprint nextel Corp telecommunic<strong>at</strong>ions 1 197 461 791 2.86% 2.83%<br />
sPX Corp industrials 116 467 087 0.63% 0.63%<br />
ss&C technologies <strong>Holding</strong>s inc technology 21 707 884 0.26% 0.26%<br />
st augustine Gold and Copper ltd basic m<strong>at</strong>erials 8 868 081 1.44% 1.44%<br />
st Joe Co/the Financials 54 694 815 0.68% 0.68%<br />
st Jude medical inc Health Care 630 860 900 0.97% 0.97%<br />
stage stores inc Consumer services 18 954 7<strong>31</strong> 0.75% 0.75%<br />
stanCorp Financial Group inc Financials 66 205 465 0.68% 0.68%<br />
standard microsystems Corp technology 24 010 177 0.68% 0.68%<br />
standard Pacific Corp Consumer Goods 17 882 344 0.47% 0.27%<br />
standex intern<strong>at</strong>ional Corp industrials 19 770 718 0.77% 0.77%<br />
stanley black & Decker inc Consumer Goods 460 918 648 0.68% 0.68%<br />
staples inc Consumer services 658 521 965 1.14% 1.14%<br />
voting<br />
ownership<br />
sector<br />
market value<br />
(noK)<br />
starbucks Corp Consumer services 1 437 695 548 0.70% 0.70%<br />
starwood Hotels & resorts Worldwide inc Consumer services 426 291 052 0.76% 0.76%<br />
starwood Property trust inc Financials 70 879 005 0.69% 0.69%<br />
st<strong>at</strong>e auto Financial Corp Financials 11 095 169 0.34% 0.34%<br />
st<strong>at</strong>e street Corp Financials 809 932 772 0.68% 0.68%<br />
steC inc technology 71 330 818 3.02% 3.02%<br />
steel Dynamics inc basic m<strong>at</strong>erials 112 736 <strong>31</strong>0 0.66% 0.66%<br />
steelcase inc Consumer Goods 26 625 773 0.11% 0.45%<br />
stein mart inc Consumer services 8 957 643 0.51% 0.51%<br />
steiner leisure ltd Consumer services 24 507 259 0.60% 0.60%<br />
stepan Co basic m<strong>at</strong>erials 37 090 123 0.76% 0.76%<br />
steris Corp Health Care 72 321 476 0.70% 0.70%<br />
steven madden ltd Consumer Goods 62 204 984 0.70% 0.70%<br />
stewart enterprises inc Consumer services 18 845 209 0.46% 0.63%<br />
stifel Financial Corp Financials 78 861 774 0.77% 0.77%<br />
stillw<strong>at</strong>er mining Co basic m<strong>at</strong>erials 48 120 811 0.67% 0.67%<br />
stone energy Corp oil & Gas 50 675 181 0.66% 0.66%<br />
str <strong>Holding</strong>s inc oil & Gas 46 865 870 2.29% 2.29%<br />
str<strong>at</strong>egic Hotels & resorts inc Financials 38 242 300 0.64% 0.64%<br />
str<strong>at</strong>tec security Corp Consumer Goods 47 624 0.01% 0.01%<br />
strayer educ<strong>at</strong>ion inc Consumer services 50 002 220 0.72% 0.72%<br />
stryker Corp Health Care 604 <strong>31</strong>4 414 0.53% 0.53%<br />
successFactors inc technology 137 142 964 0.68% 0.68%<br />
sun Communities inc Financials <strong>31</strong> 835 013 0.67% 0.67%<br />
sun Healthcare Group inc Health Care 112 351 0.02% 0.02%<br />
sunoco inc oil & Gas 177 746 280 0.68% 0.68%<br />
sunPower Corp oil & Gas 6 600 475 0.18% 0.18%<br />
sunstone Hotel investors inc Financials 38 942 990 0.67% 0.67%<br />
suntrust banks inc Financials 245 180 715 0.43% 0.43%<br />
superior energy services inc oil & Gas 108 264 208 0.80% 0.80%<br />
superior industries intern<strong>at</strong>ional inc Consumer Goods 15 521 144 0.58% 0.58%<br />
supertex inc technology 7 972 087 0.59% 0.59%<br />
suPervalu inc Consumer services 69 836 854 0.68% 0.68%<br />
surmodics inc Health Care 325 201 0.02% 0.02%<br />
susquehanna bancshares inc Financials 50 568 598 0.65% 0.65%<br />
svb Financial Group Financials 80 492 981 0.65% 0.65%<br />
swift energy Co oil & Gas 68 643 163 0.91% 0.91%<br />
sY bancorp inc Financials 8 5<strong>31</strong> 330 0.50% 0.50%<br />
sycamore networks inc technology 15 214 523 0.50% 0.50%<br />
sYKes enterprises inc industrials 21 084 988 0.51% 0.51%<br />
symantec Corp technology 482 979 935 0.70% 0.70%<br />
symetra Financial Corp Financials 43 114 588 0.67% 0.67%<br />
symmetry medical inc Health Care 10 243 412 0.59% 0.59%<br />
synaptics inc technology 40 410 588 0.70% 0.70%<br />
synchronoss technologies inc technology 33 999 602 0.49% 0.49%<br />
syneron medical ltd Health Care 19 328 830 0.84% 0.84%<br />
sYnneX Corp technology 11 012 460 0.16% 0.16%<br />
synopsys inc technology 158 297 954 0.68% 0.68%<br />
synovus Financial Corp Financials 43 504 935 0.66% 0.66%<br />
syntel inc technology 30 166 284 0.26% 0.26%<br />
sysco Corp Consumer services 690 205 371 0.67% 0.67%<br />
systemax inc technology 7 508 604 0.21% 0.21%<br />
t rowe Price Group inc Financials 587 561 197 0.68% 0.68%<br />
take-two interactive s<strong>of</strong>tware inc Consumer Goods 47 406 802 0.68% 0.68%<br />
tal intern<strong>at</strong>ional Group inc industrials 22 822 661 0.40% 0.40%<br />
talbots inc Consumer services 250 678 0.02% 0.02%<br />
taleo Corp technology 65 796 336 0.69% 0.69%<br />
tanger Factory outlet Centers Financials 104 071 280 0.69% 0.69%<br />
targa resources Corp oil & Gas 29 457 693 0.29% 0.29%<br />
targacept inc Health Care 6 738 813 0.61% 0.61%<br />
target Corp Consumer services 1 872 506 090 0.91% 0.91%<br />
taser intern<strong>at</strong>ional inc industrials 13 113 433 0.77% 0.77%<br />
taubman Centers inc Financials 146 612 084 0.68% 0.68%<br />
tCF Financial Corp Financials 64 526 805 0.65% 0.65%<br />
tD ameritrade <strong>Holding</strong> Corp Financials 178 261 434 0.35% 0.35%<br />
te Connectivity ltd industrials 506 772 945 0.65% 0.65%<br />
team Health <strong>Holding</strong>s inc Health Care 29 090 848 0.34% 0.34%<br />
team inc industrials 23 133 423 0.66% 0.66%<br />
tech D<strong>at</strong>a Corp technology 82 230 710 0.68% 0.68%<br />
techne Corp Health Care 103 222 429 0.68% 0.68%<br />
teCo energy inc utilities 168 554 887 0.68% 0.68%<br />
teekay Corp industrials 58 502 141 0.51% 0.51%<br />
tejon ranch Co Financials 15 379 026 0.53% 0.53%<br />
tekelec technology 30 289 800 0.67% 0.67%<br />
teledyne technologies inc industrials 79 480 288 0.66% 0.66%<br />
teleflex inc Health Care 102 186 013 0.69% 0.69%<br />
telephone & D<strong>at</strong>a systems inc telecommunic<strong>at</strong>ions 30 587 351 0.13% 0.20%<br />
teletech <strong>Holding</strong>s inc industrials 29 432 726 0.54% 0.54%<br />
tellabs inc technology 59 481 371 0.68% 0.68%<br />
temple-inland inc industrials 138 556 285 0.67% 0.67%<br />
tempur-Pedic intern<strong>at</strong>ional inc Consumer Goods 139 638 199 0.68% 0.68%<br />
tenet Healthcare Corp Health Care 90 233 126 0.68% 0.68%<br />
tennant Co industrials 30 745 399 0.70% 0.70%<br />
tenneco inc Consumer Goods 107 926 507 1.01% 1.01%<br />
terad<strong>at</strong>a Corp technology 3<strong>31</strong> 655 772 0.68% 0.68%<br />
teradyne inc technology 99 619 665 0.67% 0.67%<br />
terex Corp industrials 63 636 960 0.72% 0.72%<br />
tesla motors inc Consumer Goods 68 341 829 0.38% 0.38%<br />
tesoro Corp oil & Gas 150 927 941 0.78% 0.78%<br />
tessera technologies inc technology 33 861 822 0.66% 0.66%<br />
teton advisors inc Financials 0 0.00% 0.00%<br />
Country associ<strong>at</strong>ion according to Ftse (the benchmark provider for <strong>equities</strong>). if a company is not in the benchmark, the country <strong>of</strong> incorpor<strong>at</strong>ion is listed. sector classific<strong>at</strong>ion according to iCb (the industry Classific<strong>at</strong>ion<br />
benchmark company).<br />
voting<br />
ownership<br />
HOLdiNgs<br />
44<br />
<strong>Government</strong> <strong>Pension</strong> FunD <strong>Global</strong> ANNUAL REPORT 2011
<strong>Government</strong> <strong>Pension</strong> <strong>Fund</strong> <strong>Global</strong> <strong>Holding</strong> <strong>of</strong> <strong>equities</strong> <strong>at</strong> <strong>31</strong> December 2011<br />
sector<br />
market value<br />
(noK)<br />
tetra tech inc industrials 93 827 658 1.16% 1.16%<br />
tetra technologies inc oil & Gas 29 279 617 0.68% 0.68%<br />
texas Capital bancshares inc Financials 44 168 482 0.65% 0.65%<br />
texas industries inc industrials 36 002 640 0.70% 0.70%<br />
texas instruments inc technology 1 323 669 805 0.67% 0.67%<br />
texas roadhouse inc Consumer services 33 145 756 0.<strong>31</strong>% 0.50%<br />
textainer Group <strong>Holding</strong>s ltd industrials 14 942 181 0.18% 0.18%<br />
tFs Financial Corp Financials 45 249 406 0.27% 0.27%<br />
theravance inc Health Care 55 723 977 0.50% 0.50%<br />
thermo Fisher scientific inc Health Care 774 419 923 0.76% 0.76%<br />
thomas & betts Corp industrials 115 674 820 0.68% 0.68%<br />
thor industries inc Consumer Goods 46 456 833 0.52% 0.52%<br />
thor<strong>at</strong>ec Corp Health Care 170 137 994 1.42% 1.42%<br />
tHQ inc Consumer Goods 62 696 0.02% 0.02%<br />
tibCo s<strong>of</strong>tware inc technology 160 553 226 0.68% 0.68%<br />
tidew<strong>at</strong>er inc oil & Gas 132 703 194 0.87% 0.87%<br />
tiffany & Co Consumer services 173 848 458 0.35% 0.35%<br />
time Warner Cable inc Consumer services 637 230 332 0.53% 0.53%<br />
time Warner inc Consumer services 1 956 824 752 0.91% 0.91%<br />
timken Co industrials 202 559 609 0.90% 0.90%<br />
titan intern<strong>at</strong>ional inc Consumer Goods 33 505 557 0.68% 0.68%<br />
titanium metals Corp basic m<strong>at</strong>erials 53 124 187 0.34% 0.34%<br />
tivo inc Consumer Goods 44 544 028 0.69% 0.69%<br />
tJX Cos inc Consumer services 615 251 550 0.42% 0.42%<br />
tns inc technology 18 849 567 0.73% 0.73%<br />
toll brothers inc Consumer Goods 103 884 157 0.51% 0.51%<br />
tompkins Financial Corp Financials 11 380 971 0.45% 0.45%<br />
tootsie roll industries inc Consumer Goods 25 970 622 0.07% 0.32%<br />
torchmark Corp Financials 178 289 735 0.68% 0.68%<br />
toro Co/the industrials 75 535 693 0.70% 0.70%<br />
total system services inc industrials 155 497 480 0.66% 0.66%<br />
tower Group inc Financials 36 302 617 0.76% 0.76%<br />
towers W<strong>at</strong>son & Co industrials 1<strong>31</strong> 067 449 0.42% 0.42%<br />
tractor supply Co Consumer services 201 970 555 0.68% 0.68%<br />
trans<strong>at</strong>lantic <strong>Holding</strong>s inc Financials 141 082 466 0.70% 0.70%<br />
transDigm Group inc industrials 193 756 857 0.67% 0.67%<br />
travelers Cos inc/the Financials 254 206 618 0.17% 0.17%<br />
tredegar Corp basic m<strong>at</strong>erials 25 893 009 0.61% 0.61%<br />
treeHouse Foods inc Consumer Goods 92 810 473 0.66% 0.66%<br />
trimble navig<strong>at</strong>ion ltd industrials 266 394 672 0.83% 0.83%<br />
trinity industries inc industrials 94 681 208 0.66% 0.66%<br />
tripadvisor inc Consumer services 127 854 126 0.69% 0.69%<br />
triQuint semiconductor inc technology 32 341 571 0.67% 0.67%<br />
triumph Group inc industrials 115 535 233 0.67% 0.67%<br />
true religion apparel inc Consumer Goods 32 656 879 0.62% 0.62%<br />
trueblue inc industrials 24 202 856 0.73% 0.73%<br />
trustco bank Corp nY Financials 20 190 268 0.65% 0.65%<br />
trustmark Corp Financials 60 606 2<strong>31</strong> 0.65% 0.65%<br />
trW automotive <strong>Holding</strong>s Corp Consumer Goods 147 918 739 0.61% 0.61%<br />
tsakos energy navig<strong>at</strong>ion ltd industrials 7 614 887 0.58% 0.58%<br />
ttm technologies inc industrials 25 510 779 0.48% 0.48%<br />
tupperware brands Corp Consumer Goods 129 628 873 0.68% 0.68%<br />
tutor Perini Corp industrials 19 344 054 0.55% 0.55%<br />
tw telecom inc telecommunic<strong>at</strong>ions 113 599 449 0.66% 0.66%<br />
two Harbors investment Corp Financials 13 785 965 0.18% 0.18%<br />
tyco intern<strong>at</strong>ional ltd industrials 904 321 766 0.70% 0.70%<br />
tyler technologies inc technology 36 553 7<strong>31</strong> 0.68% 0.68%<br />
tyson Foods inc Consumer Goods 250 238 946 0.20% 0.54%<br />
uDr inc Financials 222 497 914 0.68% 0.68%<br />
uGi Corp utilities 129 846 616 0.64% 0.64%<br />
uil <strong>Holding</strong>s Corp utilities 360 626 535 3.38% 3.38%<br />
ulta salon Cosmetics & Fragrance inc Consumer services 119 468 850 0.50% 0.50%<br />
ultim<strong>at</strong>e s<strong>of</strong>tware Group inc technology 68 362 082 0.68% 0.68%<br />
ultra Petroleum Corp oil & Gas 183 815 334 0.68% 0.68%<br />
umb Financial Corp Financials 45 532 298 0.51% 0.51%<br />
umpqua <strong>Holding</strong>s Corp Financials 60 332 379 0.71% 0.71%<br />
under armour inc Consumer Goods 87 829 593 0.13% 0.40%<br />
unifirst Corp/ma industrials 36 944 620 0.17% 0.55%<br />
union Pacific Corp industrials 2 523 302 832 0.83% 0.83%<br />
unisource energy Corp utilities 175 160 196 2.15% 2.15%<br />
unisys Corp technology 32 <strong>31</strong>3 786 0.63% 0.63%<br />
unit Corp oil & Gas 103 617 200 0.78% 0.78%<br />
united bankshares inc/wv Financials 58 600 765 0.69% 0.69%<br />
united Continental <strong>Holding</strong>s inc Consumer services 250 826 971 0.67% 0.67%<br />
united Fire & Casualty Co Financials 15 808 668 0.51% 0.51%<br />
united n<strong>at</strong>ural Foods inc Consumer services 81 896 685 0.70% 0.70%<br />
united online inc technology 11 970 961 0.41% 0.41%<br />
united Parcel service inc industrials 2 334 818 200 0.17% 0.54%<br />
united rentals inc industrials 75 548 710 0.68% 0.68%<br />
united st<strong>at</strong>es Cellular Corp telecommunic<strong>at</strong>ions 26 375 620 0.03% 0.12%<br />
united st<strong>at</strong>es steel Corp basic m<strong>at</strong>erials 187 981 236 0.83% 0.83%<br />
united st<strong>at</strong>ioners inc industrials 57 629 985 0.70% 0.70%<br />
united technologies Corp industrials 2 747 382 757 0.70% 0.70%<br />
united therapeutics Corp Health Care <strong>31</strong>7 864 362 1.93% 1.93%<br />
unitedHealth Group inc Health Care 2 224 191 512 0.69% 0.69%<br />
universal american Corp/nY Health Care 27 753 648 0.47% 0.45%<br />
universal Display Corp industrials 127 102 740 1.26% 1.26%<br />
universal Forest Products inc industrials 15 957 <strong>31</strong>9 0.44% 0.44%<br />
universal Health realty income trust Financials 23 697 214 0.80% 0.80%<br />
universal Health services inc Health Care 143 427 545 0.08% 0.63%<br />
universal technical institute inc industrials 7 956 071 0.42% 0.42%<br />
voting<br />
ownership<br />
sector<br />
market value<br />
(noK)<br />
unum Group Financials 387 299 355 1.05% 1.05%<br />
urban outfitters inc Consumer services 134 721 222 0.57% 0.57%<br />
urs Corp industrials 154 058 384 0.92% 0.92%<br />
urstadt biddle Properties inc Financials 15 598 533 0.07% 0.49%<br />
us airways Group inc Consumer services 7 527 190 0.15% 0.15%<br />
us bancorp Financials 2 102 <strong>31</strong>3 843 0.68% 0.68%<br />
us ecology inc industrials 10 557 757 0.51% 0.51%<br />
usa mobility inc telecommunic<strong>at</strong>ions 2 976 440 0.16% 0.16%<br />
usana Health sciences inc Consumer Goods 12 585 586 0.46% 0.46%<br />
useC inc basic m<strong>at</strong>erials 157 357 0.02% 0.02%<br />
usG Corp industrials <strong>31</strong> 837 532 0.50% 0.50%<br />
uti Worldwide inc industrials 53 751 135 0.66% 0.66%<br />
utstarcom <strong>Holding</strong>s Corp technology 211 981 0.02% 0.02%<br />
vail resorts inc Consumer services 59 051 345 0.65% 0.65%<br />
valassis Communic<strong>at</strong>ions inc Consumer services 35 828 302 0.70% 0.70%<br />
valero energy Corp oil & Gas 474 396 739 0.67% 0.67%<br />
validus <strong>Holding</strong>s ltd Financials 129 533 674 0.70% 0.70%<br />
valley n<strong>at</strong>ional bancorp Financials 87 343 954 0.70% 0.70%<br />
valmont industries inc industrials 10 208 622 0.07% 0.07%<br />
valspar Corp industrials 145 653 178 0.67% 0.67%<br />
valueClick inc Consumer services 51 602 681 0.64% 0.64%<br />
varian medical systems inc Health Care 577 062 463 1.28% 1.28%<br />
vasCo D<strong>at</strong>a security intern<strong>at</strong>ional inc technology 223 972 0.02% 0.02%<br />
vCa antech inc Consumer services 67 283 913 0.66% 0.66%<br />
vectren Corp utilities 98 047 495 0.66% 0.66%<br />
veeco instruments inc industrials 48 513 551 1.01% 1.01%<br />
venoco inc oil & Gas 5 424 025 0.22% 0.22%<br />
ventas inc Financials 638 743 039 0.67% 0.67%<br />
vera bradley inc Consumer Goods 25 841 500 0.33% 0.33%<br />
veriFone systems inc technology 149 205 782 0.66% 0.66%<br />
verint systems inc technology 30 542 196 0.48% 0.48%<br />
verisign inc technology 240 388 904 0.71% 0.71%<br />
verisk analytics inc industrials 264 079 791 0.67% 0.67%<br />
verizon Communic<strong>at</strong>ions inc telecommunic<strong>at</strong>ions 4 306 732 536 0.64% 0.64%<br />
vertex Pharmaceuticals inc Health Care 375 797 921 0.91% 0.91%<br />
vF Corp Consumer Goods 564 506 268 0.67% 0.67%<br />
viacom inc Consumer services 2 006 879 378 0.00% 1.34%<br />
viad Corp industrials 13 437 638 0.64% 0.64%<br />
vias<strong>at</strong> inc technology 79 814 358 0.69% 0.69%<br />
vicor Corp industrials 7 696 741 0.11% 0.39%<br />
virgin media inc telecommunic<strong>at</strong>ions 1 385 830 030 3.79% 3.79%<br />
virnetX <strong>Holding</strong> Corp technology 37 964 560 0.50% 0.50%<br />
viropharma inc Health Care 82 800 118 0.72% 0.72%<br />
visa inc Financials 2 700 573 846 0.86% 0.64%<br />
vishay intertechnology inc industrials 54 896 326 0.37% 0.65%<br />
vistaPrint nv industrials 43 813 285 0.62% 0.62%<br />
visteon Corp/new Consumer Goods 96 320 083 0.63% 0.63%<br />
vitamin shoppe inc Consumer services 44 589 408 0.64% 0.64%<br />
vivus inc Health Care 36 037 098 0.70% 0.70%<br />
vmware inc technology 308 821 573 0.02% 0.15%<br />
vocus inc technology 14 507 190 0.55% 0.55%<br />
volcano Corp Health Care 46 958 216 0.63% 0.63%<br />
vornado realty trust Financials 571 476 379 0.68% 0.68%<br />
vulcan m<strong>at</strong>erials Co industrials 213 261 606 0.70% 0.70%<br />
W&t <strong>of</strong>fshore inc oil & Gas 23 737 715 0.25% 0.25%<br />
WabCo <strong>Holding</strong>s inc Consumer Goods 105 617 407 0.62% 0.62%<br />
Wabtec Corp/De industrials 137 875 975 0.69% 0.69%<br />
Waddell & reed Financial inc Financials 102 150 363 0.81% 0.81%<br />
Walgreen Co Consumer services 1 582 500 754 0.92% 0.92%<br />
Walt Disney Co/the Consumer services 2 592 568 342 0.64% 0.64%<br />
Walter energy inc basic m<strong>at</strong>erials 277 092 036 1.23% 1.23%<br />
Warburg Pincus llC oil & Gas 19 962 793 0.12% 0.12%<br />
Warnaco Group inc/the Consumer Goods 81 934 430 0.68% 0.68%<br />
Warner Chilcott PlC Health Care 115 345 919 0.50% 0.50%<br />
Washington Federal inc Financials 60 396 836 0.67% 0.67%<br />
Washington Post Co/the Consumer services 78 529 760 0.44% 0.44%<br />
Washington real est<strong>at</strong>e investment trust Financials 71 932 403 0.67% 0.67%<br />
Washington trust bancorp inc Financials 17 059 810 0.74% 0.74%<br />
Waste management inc industrials 248 270 365 0.28% 0.28%<br />
W<strong>at</strong>ers Corp Health Care 278 180 040 0.70% 0.70%<br />
W<strong>at</strong>sco inc industrials 72 351 826 0.40% 0.56%<br />
W<strong>at</strong>son Pharmaceuticals inc Health Care 259 843 561 0.57% 0.57%<br />
W<strong>at</strong>ts W<strong>at</strong>er technologies inc industrials <strong>31</strong>4 504 996 1.52% 4.12%<br />
Wausau Paper Corp basic m<strong>at</strong>erials 14 205 417 0.59% 0.59%<br />
WD-40 Co Consumer Goods 30 278 007 0.79% 0.79%<br />
We<strong>at</strong>herford intern<strong>at</strong>ional ltd oil & Gas 441 512 638 0.67% 0.67%<br />
WebmD Health Corp Consumer services 78 350 419 0.61% 0.61%<br />
Websense inc technology 42 854 550 0.99% 0.99%<br />
Webster Financial Corp Financials 73 934 771 0.69% 0.69%<br />
Weight W<strong>at</strong>chers intern<strong>at</strong>ional inc Consumer services 80 115 613 0.33% 0.33%<br />
Weingarten realty investors Financials 109 613 378 0.70% 0.70%<br />
Weis markets inc Consumer services 20 582 618 0.32% 0.32%<br />
WellCare Health Plans inc Health Care 90 580 366 0.68% 0.68%<br />
WellPoint inc Health Care 1 023 099 253 0.74% 0.74%<br />
Wells Fargo & Co Financials 6 608 717 473 0.76% 0.76%<br />
Wendy’s Co/the Consumer services 87 587 275 0.70% 0.70%<br />
Werner enterprises inc industrials 53 577 361 0.51% 0.51%<br />
Wesbanco inc Financials 22 764 653 0.74% 0.74%<br />
WesCo intern<strong>at</strong>ional inc industrials 77 418 289 0.57% 0.51%<br />
West Pharmaceutical services inc Health Care 50 507 225 0.66% 0.66%<br />
Westamerica bancorpor<strong>at</strong>ion Financials 51 095 448 0.68% 0.68%<br />
Country associ<strong>at</strong>ion according to Ftse (the benchmark provider for <strong>equities</strong>). if a company is not in the benchmark, the country <strong>of</strong> incorpor<strong>at</strong>ion is listed. sector classific<strong>at</strong>ion according to iCb (the industry Classific<strong>at</strong>ion<br />
benchmark company).<br />
voting<br />
ownership<br />
HOLdiNgs<br />
45<br />
<strong>Government</strong> <strong>Pension</strong> FunD <strong>Global</strong> ANNUAL REPORT 2011
<strong>Government</strong> <strong>Pension</strong> <strong>Fund</strong> <strong>Global</strong> <strong>Holding</strong> <strong>of</strong> <strong>equities</strong> <strong>at</strong> <strong>31</strong> December 2011<br />
sector<br />
market value<br />
(noK)<br />
Westar energy inc utilities 135 056 093 0.67% 0.67%<br />
Western alliance bancorp Financials 22 506 926 0.74% 0.74%<br />
Western Digital Corp technology 288 975 933 0.67% 0.67%<br />
Western refining inc oil & Gas 46 174 819 0.64% 0.64%<br />
Western union Co/the Financials 457 364 482 0.68% 0.68%<br />
Westlake Chemical Corp basic m<strong>at</strong>erials 32 062 468 0.20% 0.20%<br />
Weyerhaeuser Co Financials 449 322 862 0.75% 0.75%<br />
WGl <strong>Holding</strong>s inc utilities 90 555 061 0.67% 0.67%<br />
Whirlpool Corp Consumer Goods 170 846 559 0.79% 0.79%<br />
White mountains insurance Group ltd Financials 79 113 829 0.38% 0.38%<br />
Whiting Petroleum Corp oil & Gas 235 694 021 0.72% 0.72%<br />
Whole Foods market inc Consumer services 287 363 770 0.39% 0.39%<br />
Willbros Group inc oil & Gas 6 881 508 0.65% 0.65%<br />
Williams Cos inc/the oil & Gas 1 161 382 000 1.00% 1.00%<br />
Williams-sonoma inc Consumer services 163 998 523 0.69% 0.69%<br />
Willis Group <strong>Holding</strong>s PlC Financials 271 <strong>31</strong>4 473 0.68% 0.68%<br />
Windstream Corp telecommunic<strong>at</strong>ions 10 860 019 0.03% 0.03%<br />
Winn-Dixie stores inc Consumer services 23 395 794 0.74% 0.74%<br />
Winnebago industries inc Consumer Goods 7 766 802 0.60% 0.60%<br />
Wintrust Financial Corp Financials 37 921 348 0.63% 0.63%<br />
Wisconsin energy Corp utilities 119 0<strong>31</strong> 983 0.25% 0.25%<br />
Wms industries inc Consumer services 48 402 013 0.71% 0.71%<br />
Wolverine World Wide inc Consumer Goods 71 991 803 0.70% 0.70%<br />
Woodward inc industrials 11 803 772 0.07% 0.07%<br />
World acceptance Corp Financials 43 800 829 0.68% 0.68%<br />
World Fuel services Corp industrials 115 818 861 0.65% 0.65%<br />
Worthington industries inc basic m<strong>at</strong>erials 49 759 750 0.72% 0.72%<br />
Wr berkley Corp Financials 190 282 943 0.68% 0.68%<br />
Wr Grace & Co basic m<strong>at</strong>erials 181 646 <strong>31</strong>5 0.90% 0.90%<br />
Wright express Corp industrials 85 204 728 0.68% 0.68%<br />
Wright medical Group inc Health Care 26 280 676 0.68% 0.68%<br />
WW Grainger inc industrials 523 589 258 0.67% 0.67%<br />
Wyndham Worldwide Corp Consumer services 235 797 723 0.68% 0.68%<br />
Wynn resorts ltd Consumer services 416 101 081 0.50% 0.50%<br />
Xcel energy inc utilities 285 888 450 0.36% 0.36%<br />
XenoPort inc Health Care 5 977 700 0.74% 0.74%<br />
Xerox Corp technology 449 987 239 0.68% 0.68%<br />
Xilinx inc technology 340 192 971 0.68% 0.68%<br />
Xl Group Plc Financials 256 986 706 0.68% 0.68%<br />
Xo Group inc Consumer services 9 350 051 0.66% 0.66%<br />
Xylem inc/nY utilities 92 334 637 0.33% 0.33%<br />
Yahoo! inc technology 1 986 047 214 1.66% 1.66%<br />
Yandex nv technology 56 255 642 0.02% 0.15%<br />
Yum! brands inc Consumer services 1 102 560 350 0.68% 0.68%<br />
Zebra technologies Corp industrials 79 209 519 0.71% 0.71%<br />
Zep inc basic m<strong>at</strong>erials 11 029 953 0.60% 0.60%<br />
Zimmer <strong>Holding</strong>s inc Health Care 388 <strong>31</strong>3 110 0.68% 0.68%<br />
Zions bancorpor<strong>at</strong>ion Financials 119 014 455 0.66% 0.66%<br />
Zoll medical Corp Health Care 58 667 508 0.70% 0.70%<br />
Zoltek Cos inc basic m<strong>at</strong>erials 9 787 752 0.63% 0.63%<br />
Zoran Corp technology 13 401 932 0.55% 0.55%<br />
Zumiez inc Consumer services 28 409 970 0.55% 0.55%<br />
Zynga inc Consumer Goods 15 590 698 0.00% 0.04%<br />
voting<br />
ownership<br />
Country associ<strong>at</strong>ion according to Ftse (the benchmark provider for <strong>equities</strong>). if a company is not in the benchmark, the country <strong>of</strong> incorpor<strong>at</strong>ion is listed. sector classific<strong>at</strong>ion according to iCb (the industry Classific<strong>at</strong>ion<br />
benchmark company).<br />
sector<br />
market value<br />
(noK)<br />
voting<br />
ownership<br />
HOLdiNgs<br />
46<br />
<strong>Government</strong> <strong>Pension</strong> FunD <strong>Global</strong> ANNUAL REPORT 2011