
Improving Usability in Mobile Apps for Residential Energy Management: A Hybrid Approach Using Fuzzy Logic

 , , ,
, , ,  ,
, 
Abstract
:1. Introduction
2. Background
2.1. Related Work
2.2. Theorical Context
3. Materials and Methods
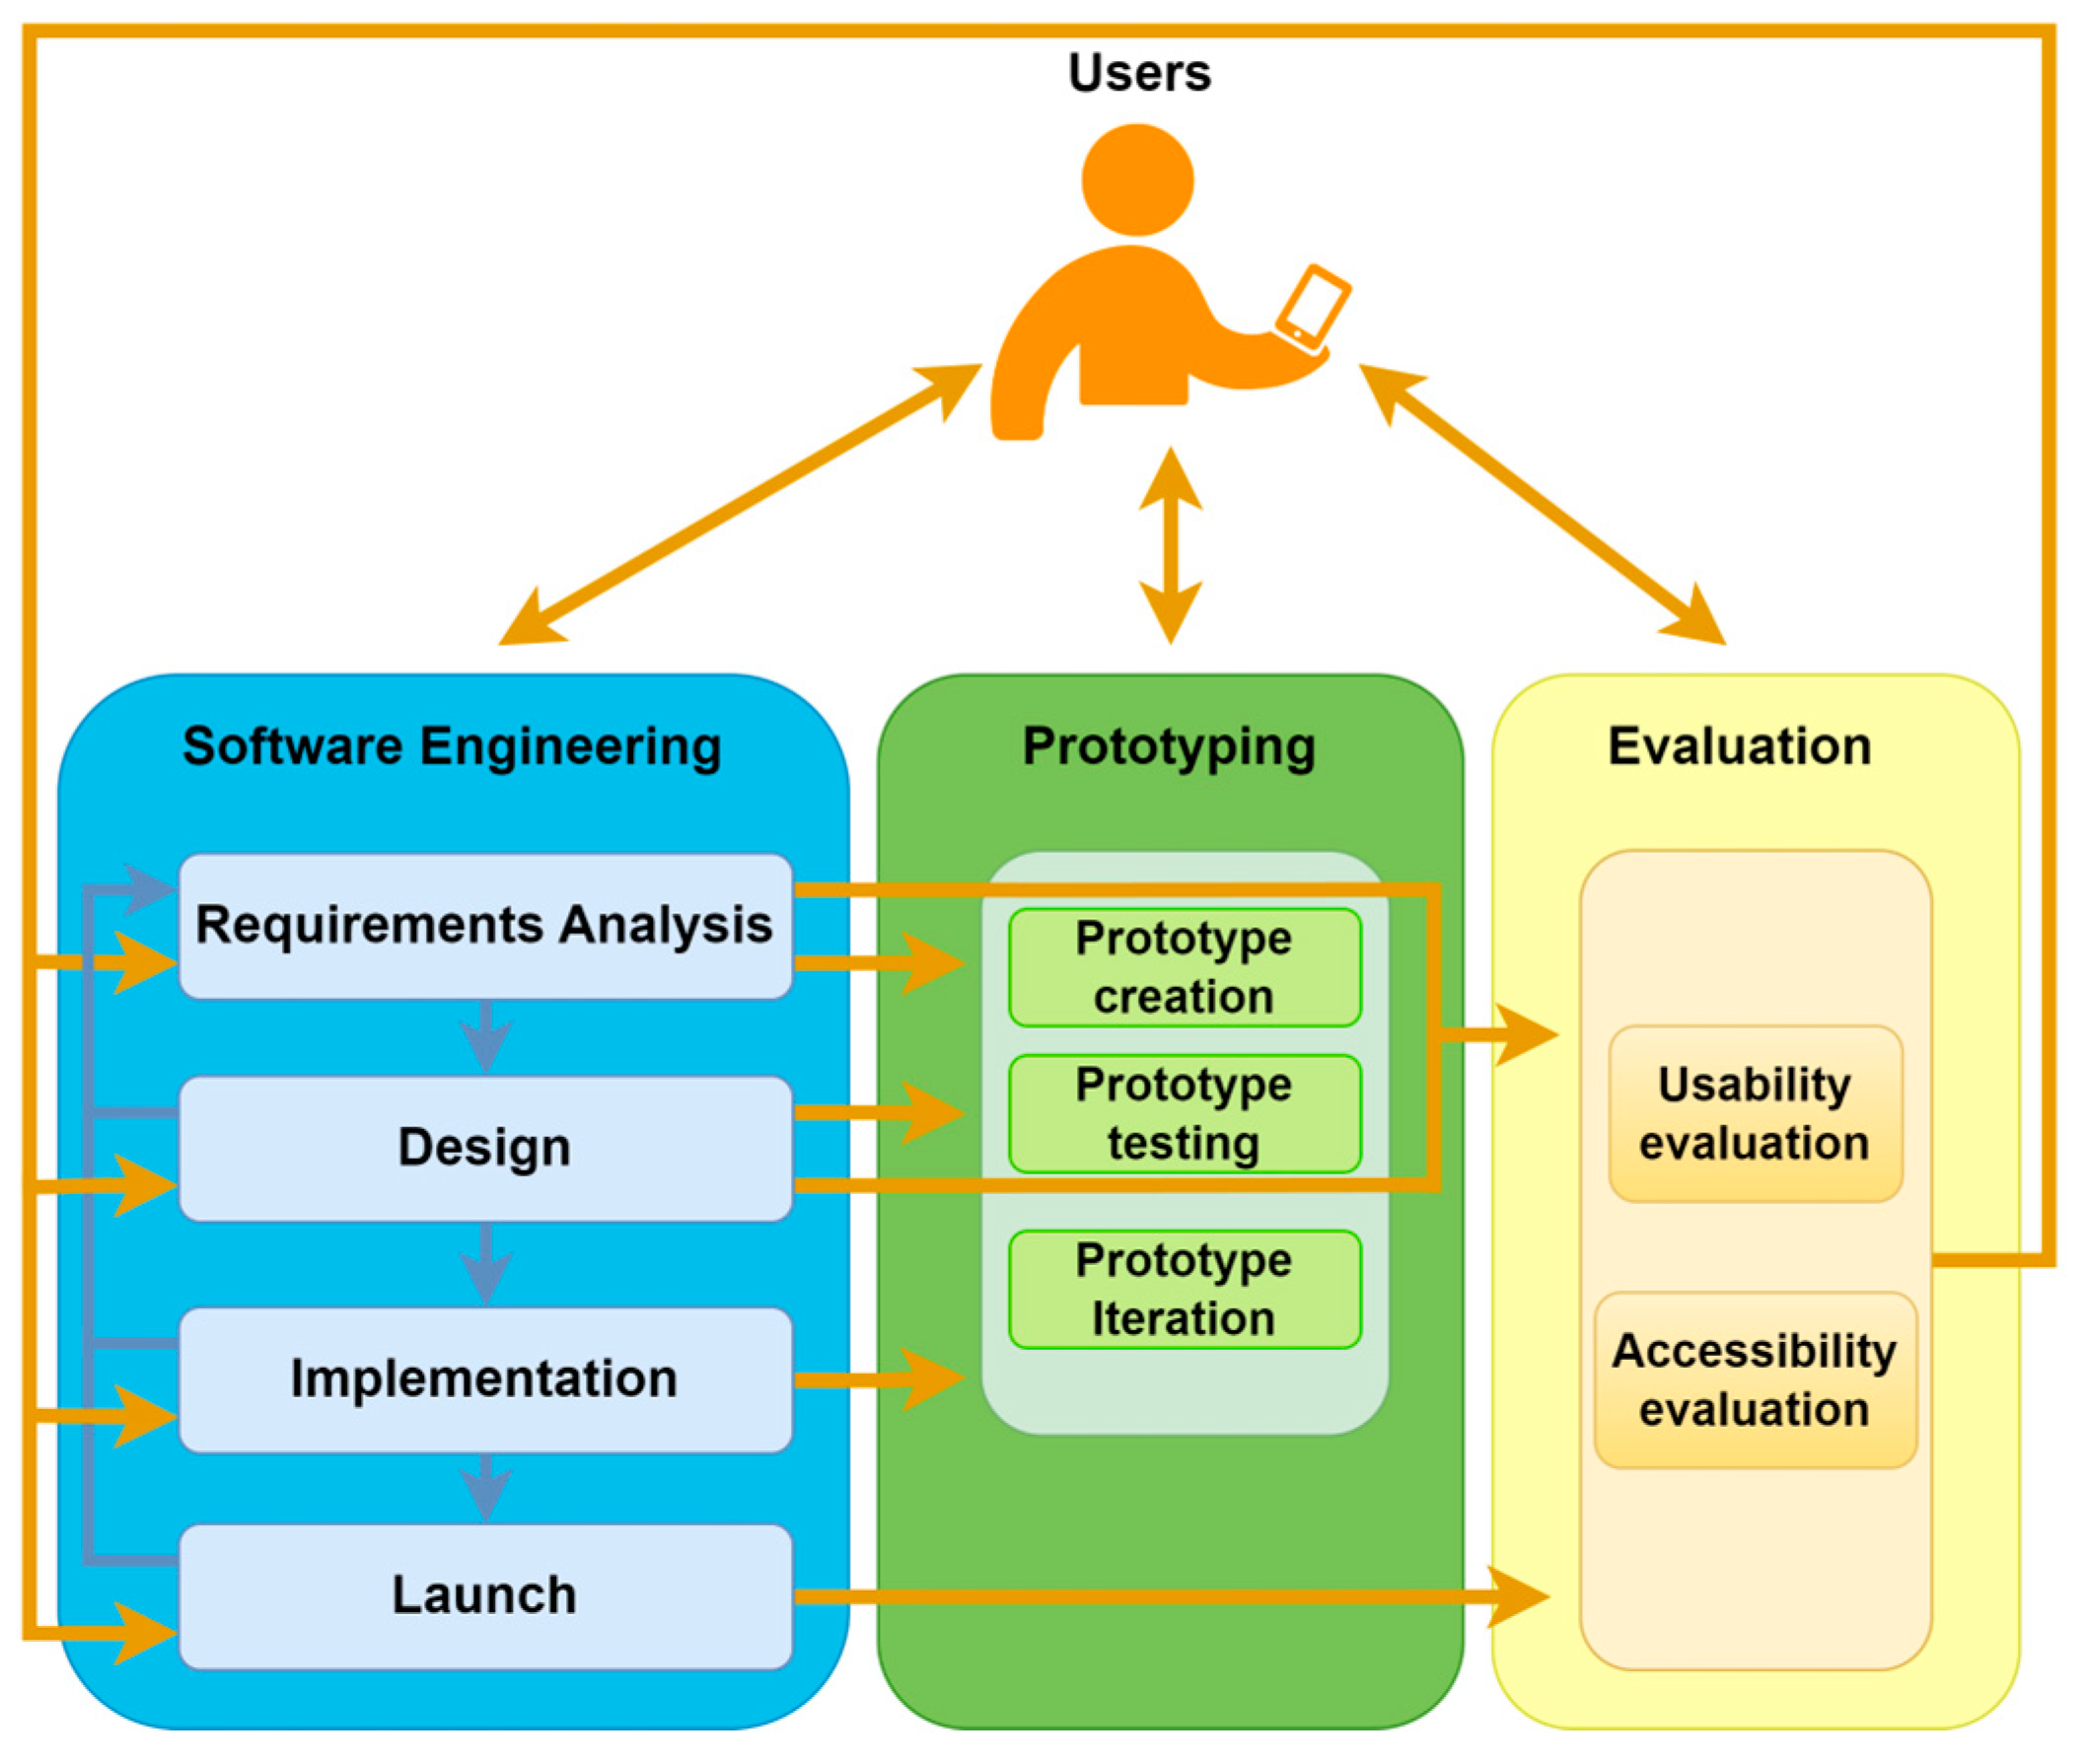
3.1. Methodology
3.2. Instruments
3.2.1. User Experience Questionnaire Short (UEQ-S)
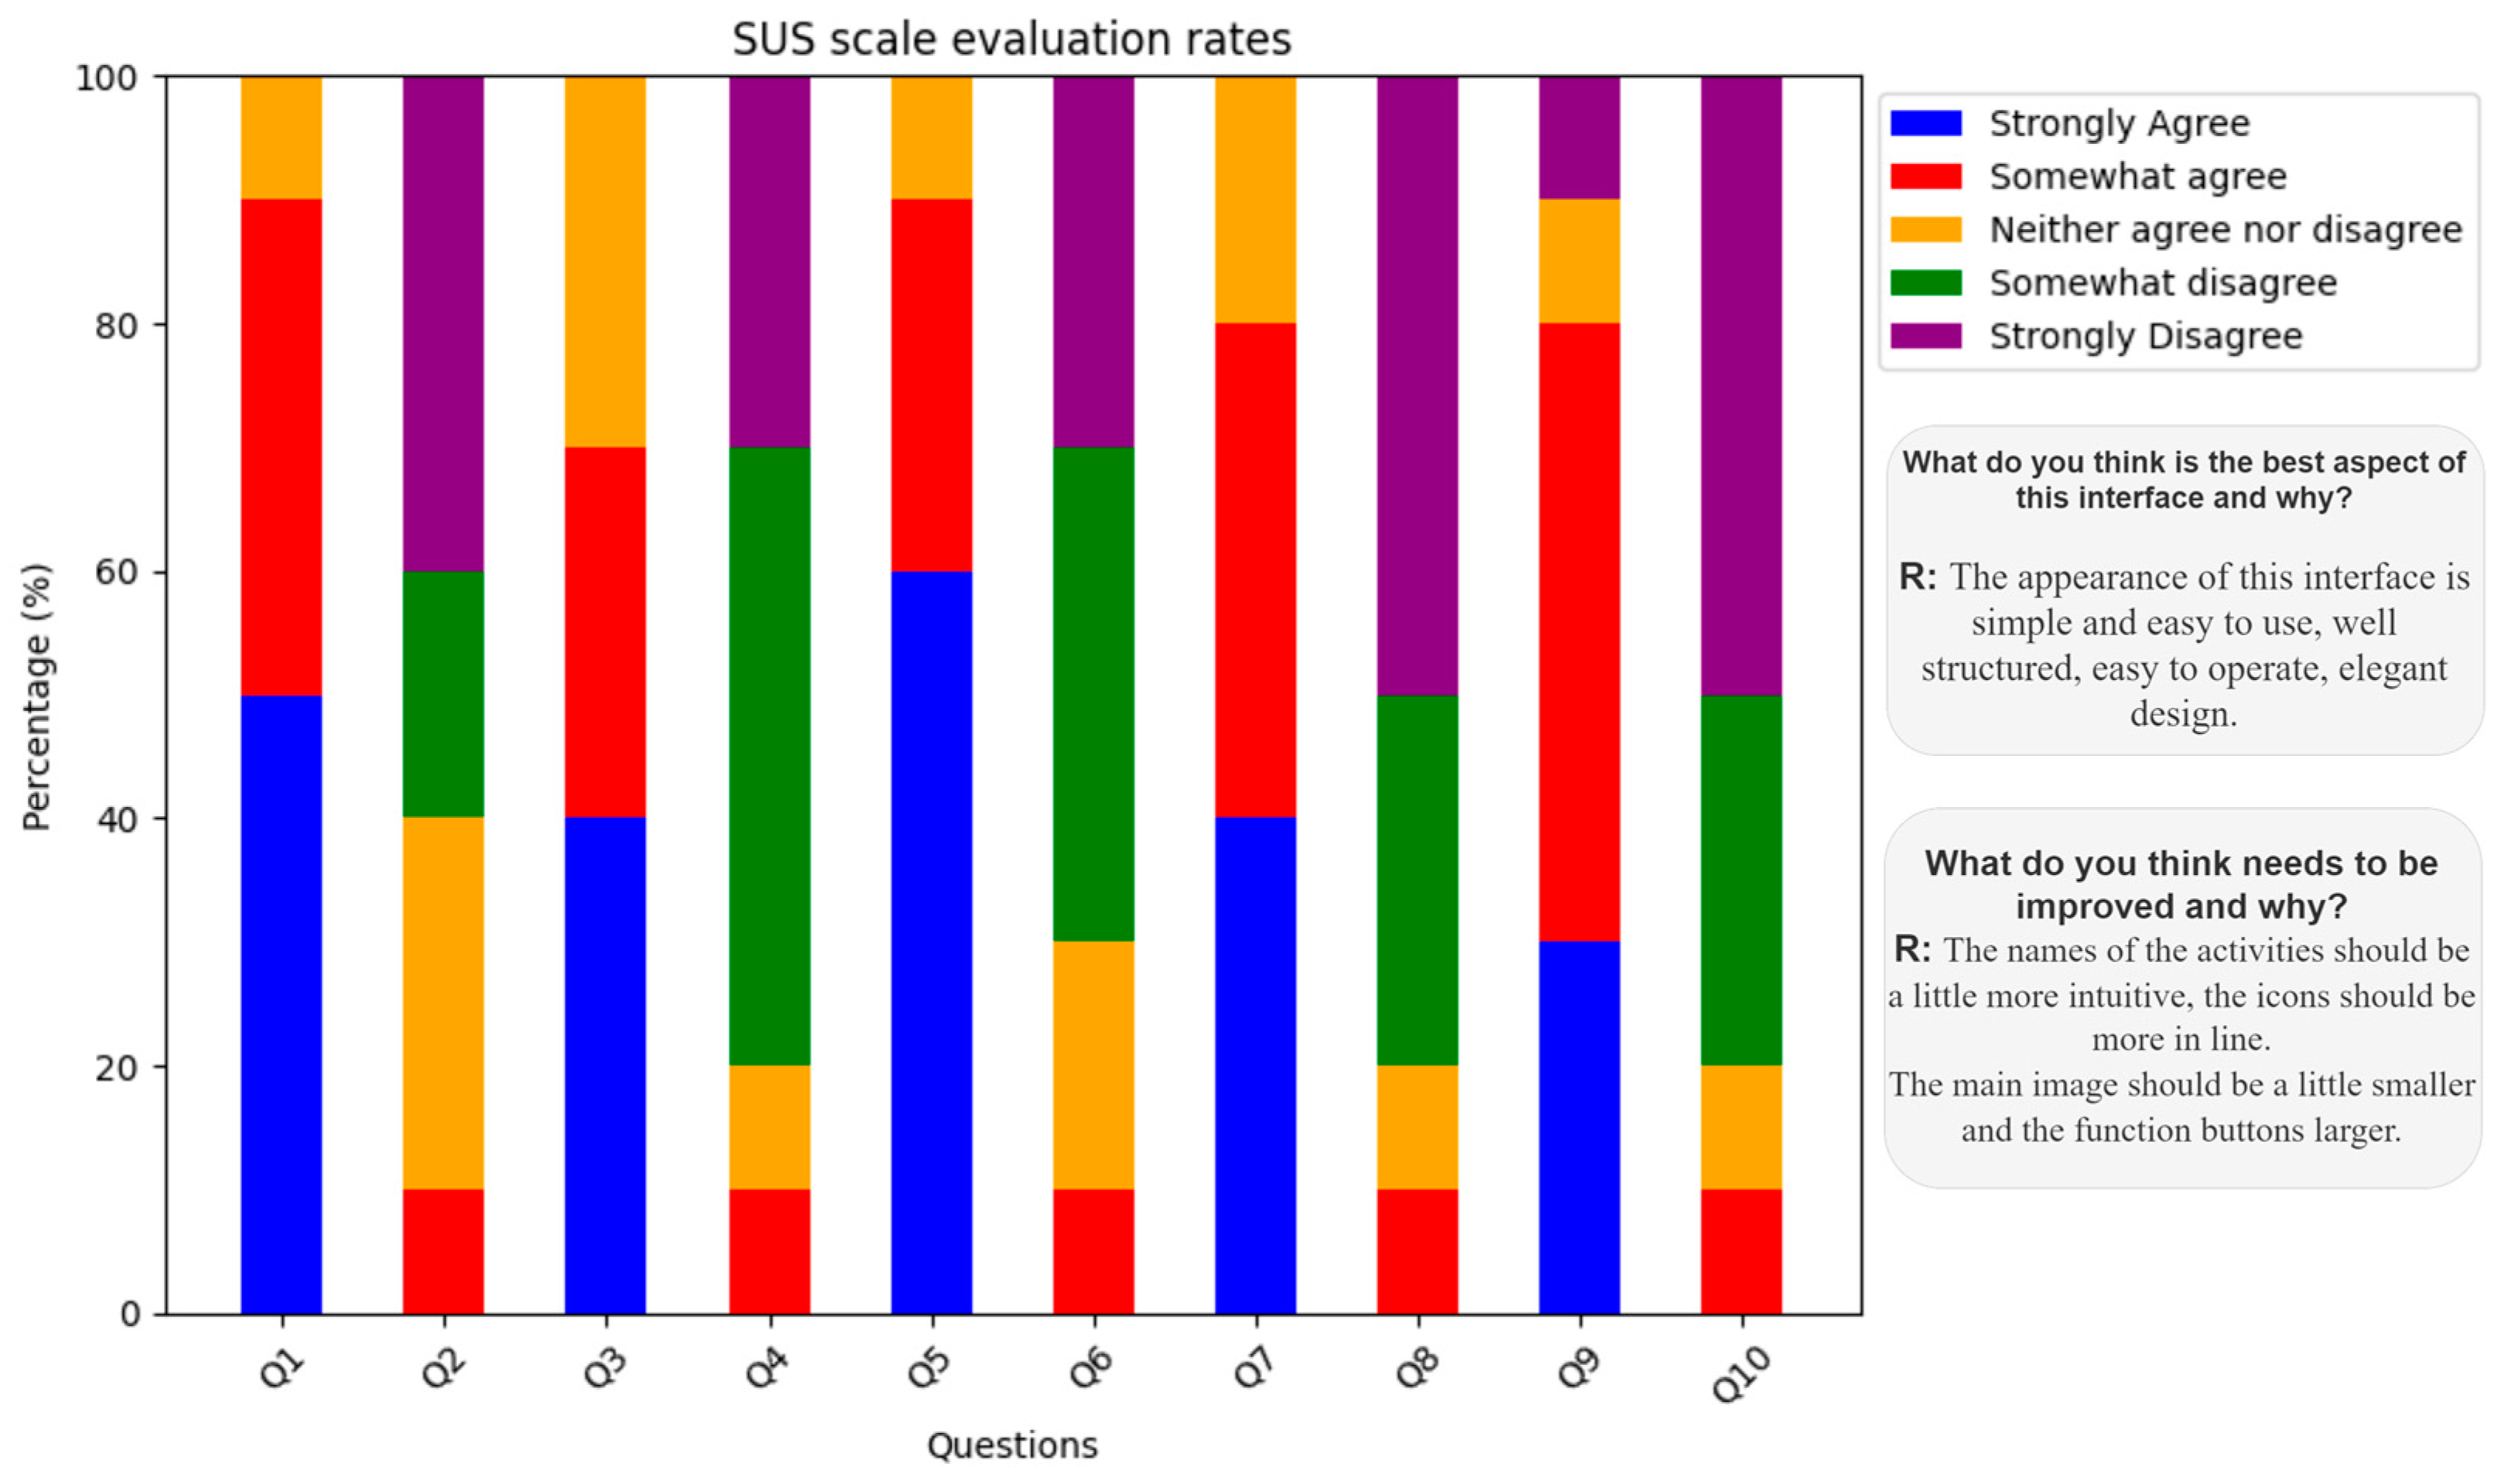
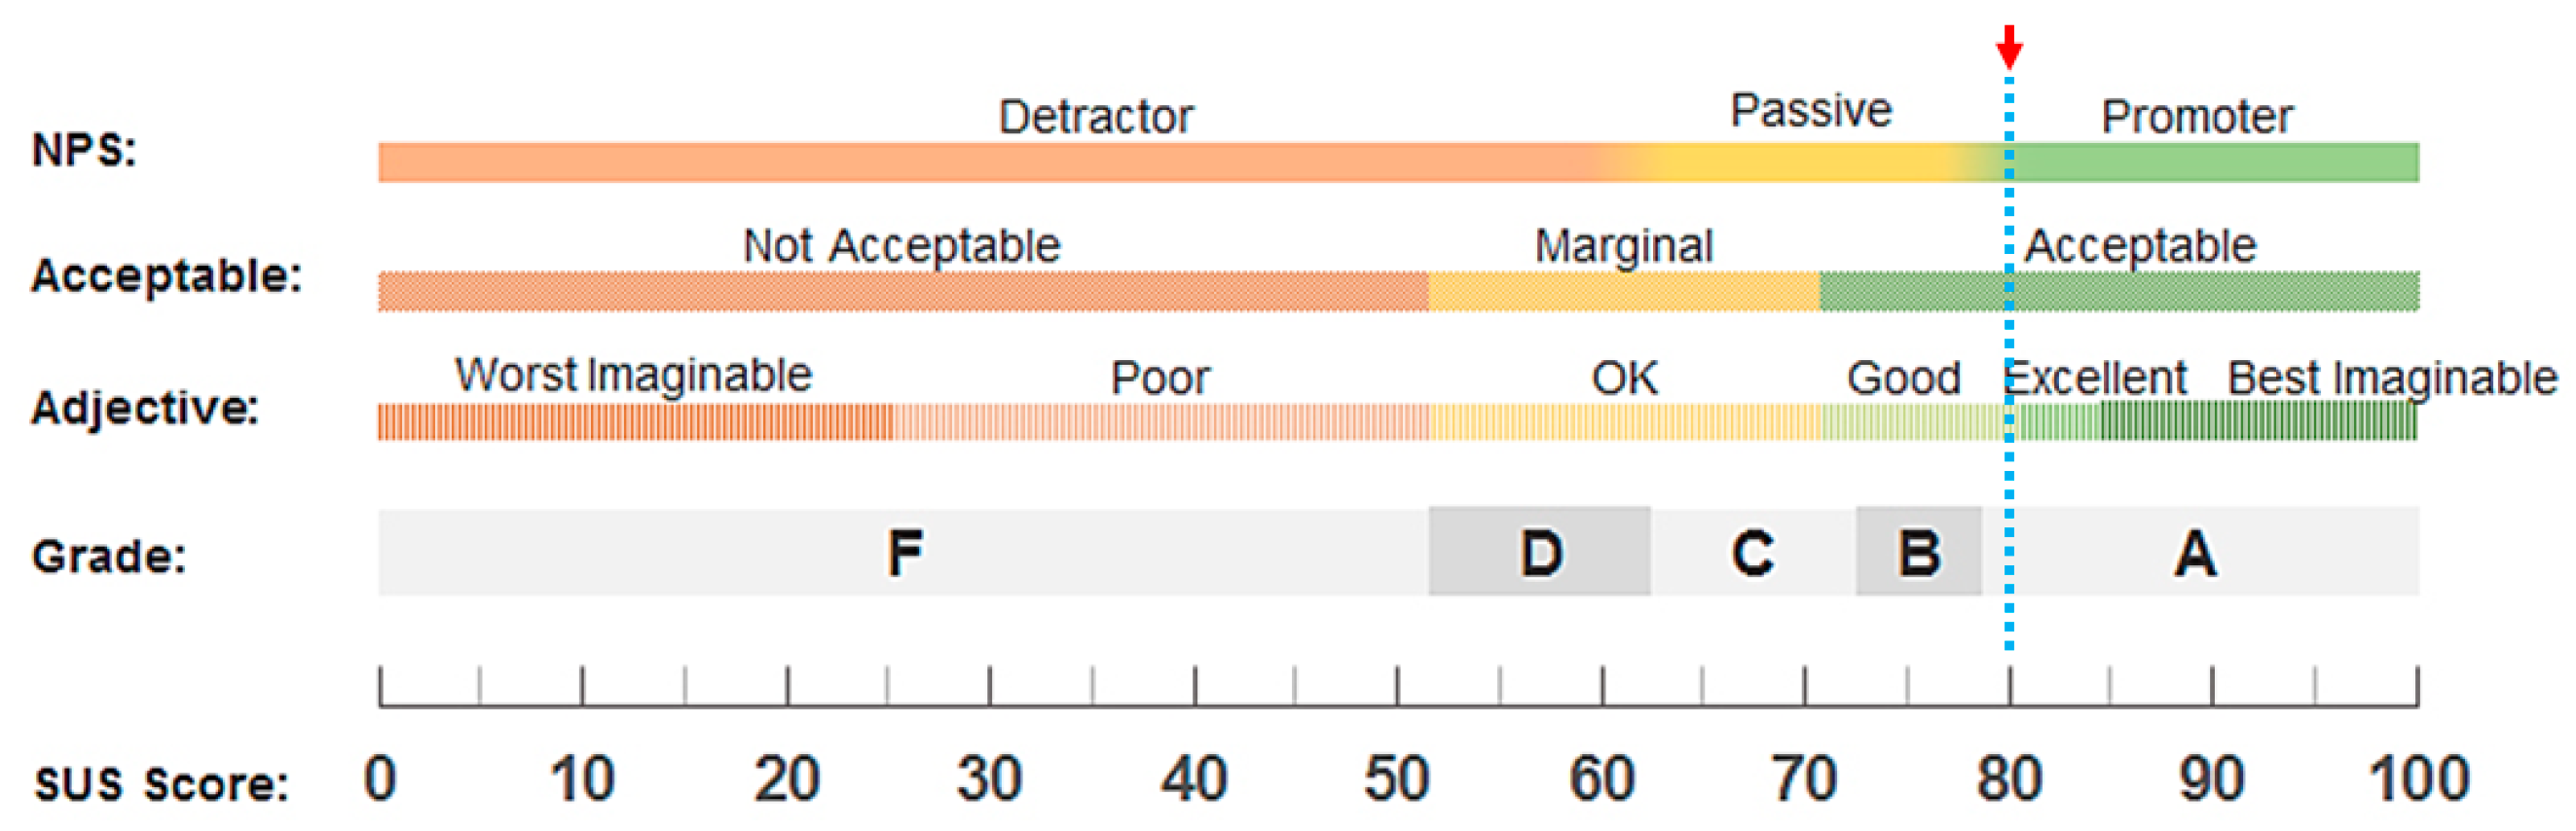
3.2.2. System Usability Scale (SUS)
3.2.3. Fuzzy Logic
- Membership functions: These represent the degree to which an element belongs to a subset defined by a label. They allow us to represent a fuzzy set graphically. The x-axis (abscissa) represents the universe in discourse, while the y-axis (ordinate) represents the degrees of membership in the interval [0, 1]. To define the fuzzy set, the triangular and trapezoidal functions will be used, as shown in Table 4, because they allow for modeling uncertainty and ambiguity and for representing graphically how the degree of belonging of an element to a fuzzy set varies, which is crucial in systems where the binary classification (belonging or not belonging) is too restrictive [44].
- Fuzzy systems: The starting point for building a fuzzy system is to obtain a collection of fuzzy rules based on human knowledge. The next step is to combine these rules into a simple design. Different fuzzy systems employ different principles of this combination; for this purpose, the Takagi–Sugeno–Kang (TSK) fuzzy system will be used for its accuracy in modeling complex and nonlinear relationships, providing clear and accurate numerical outputs [45].
- Defuzzification: An essential mathematical process in fuzzy logic that transforms fuzzy sets into a representative actual number. Although the fuzzy inference system produces conclusions in fuzzy terms, it is required to convert this fuzzy information into a singular real value to obtain a valuable and concrete output. Among the available defuzzification methods, the centroid method will be used, which allows the calculation of the x-coordinate of the center of gravity of the resulting fuzzy set, thus providing a fundamental value that effectively represents the fuzzy conclusion [46].
4. Experimentation
4.1. Participants
4.2. Requirements
4.3. Design
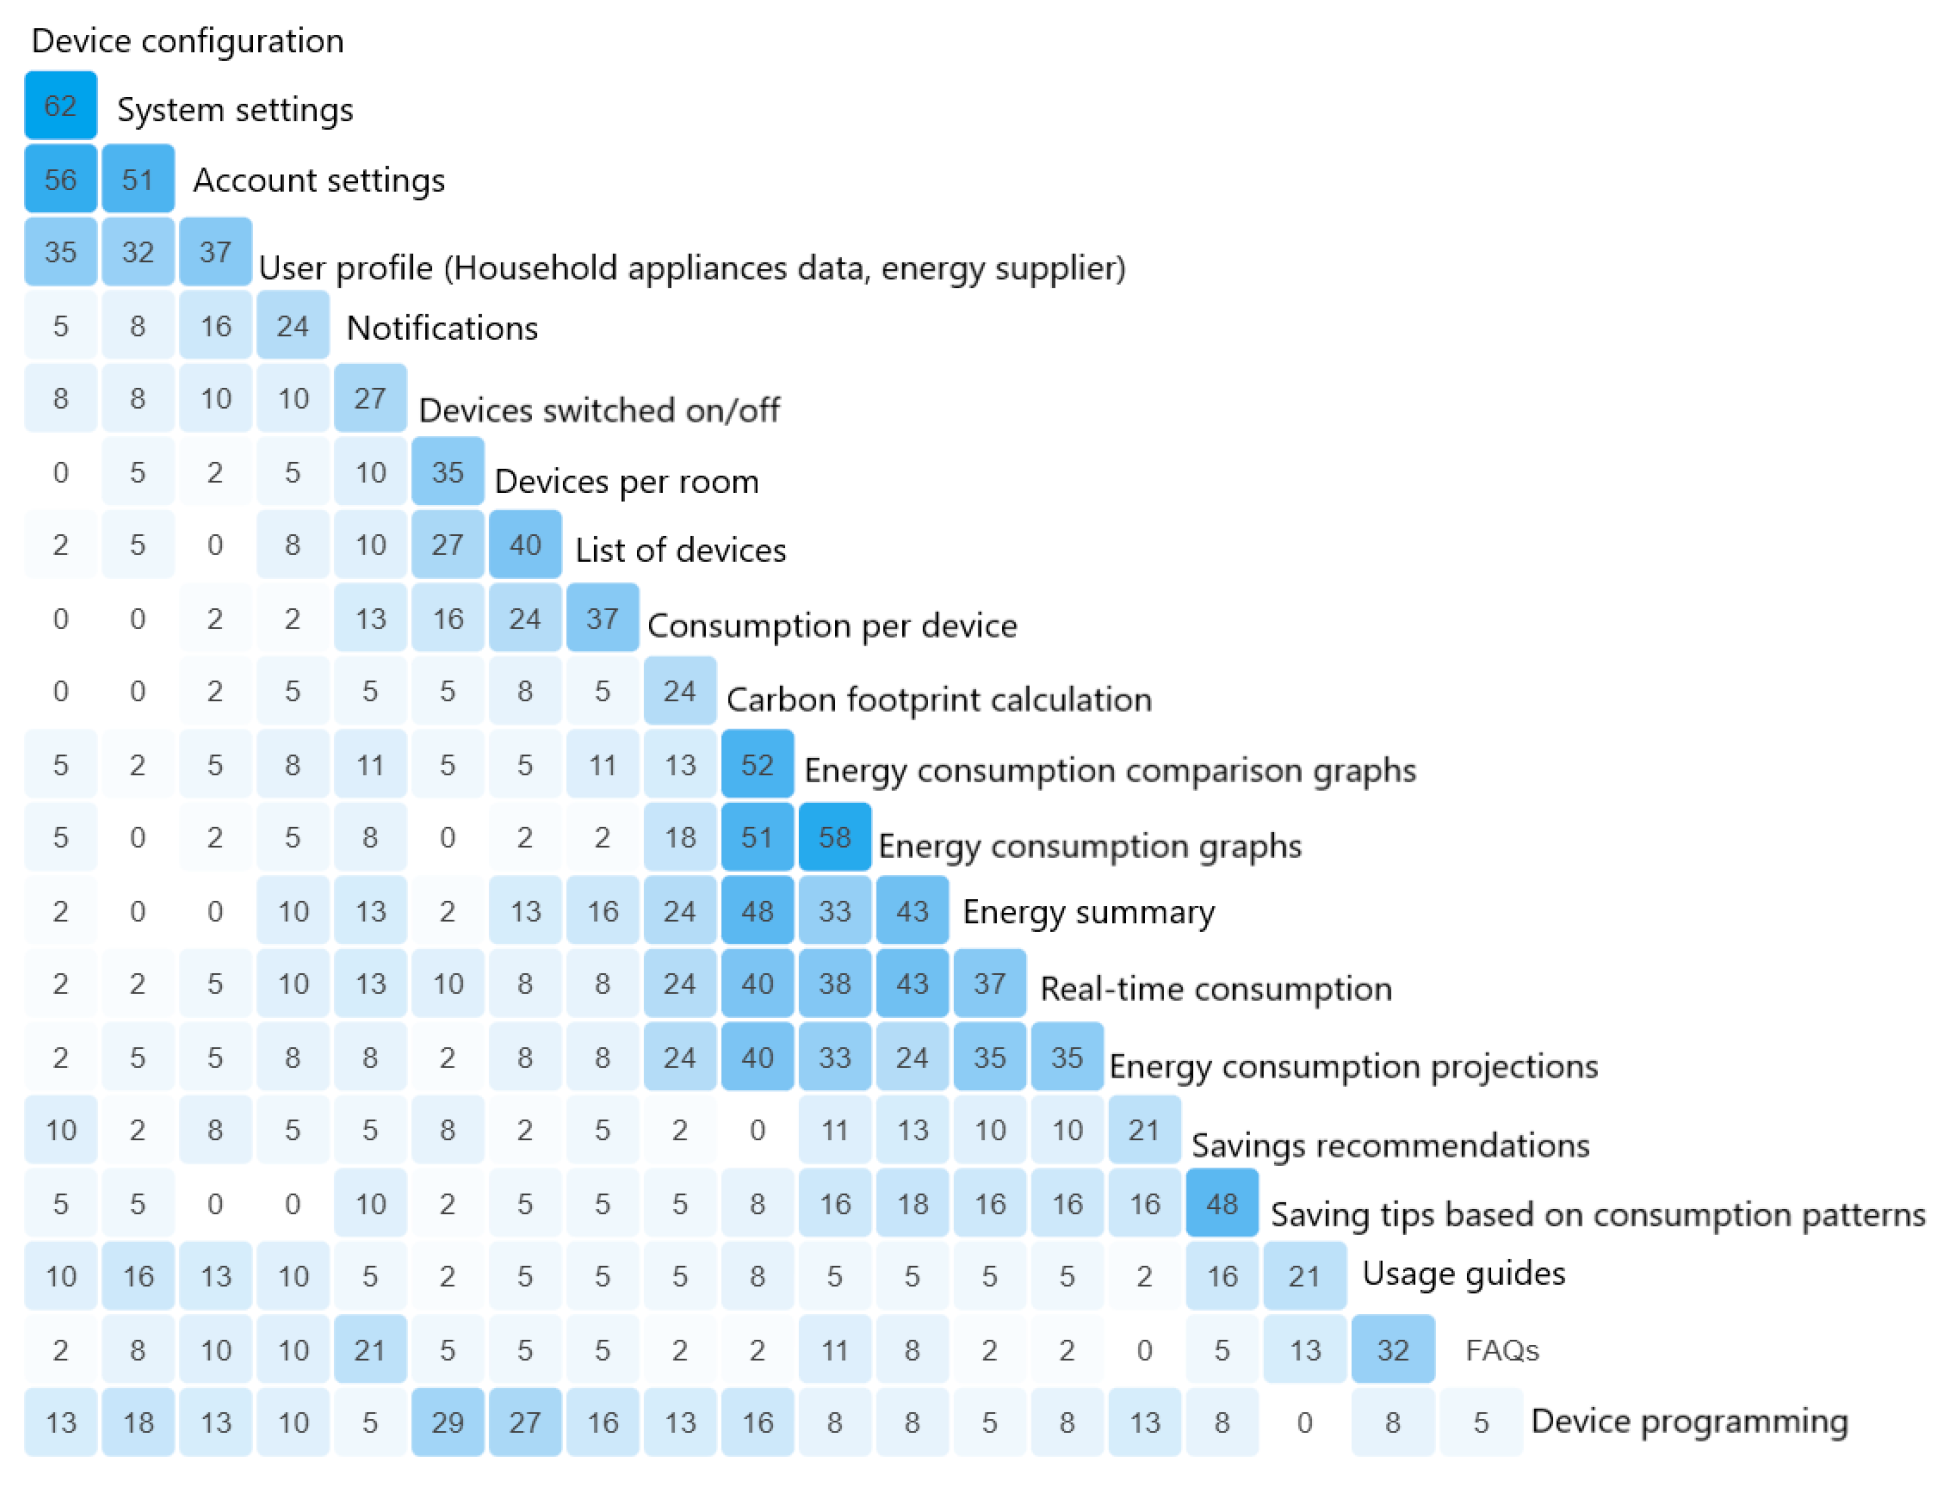
4.3.1. Information Architecture
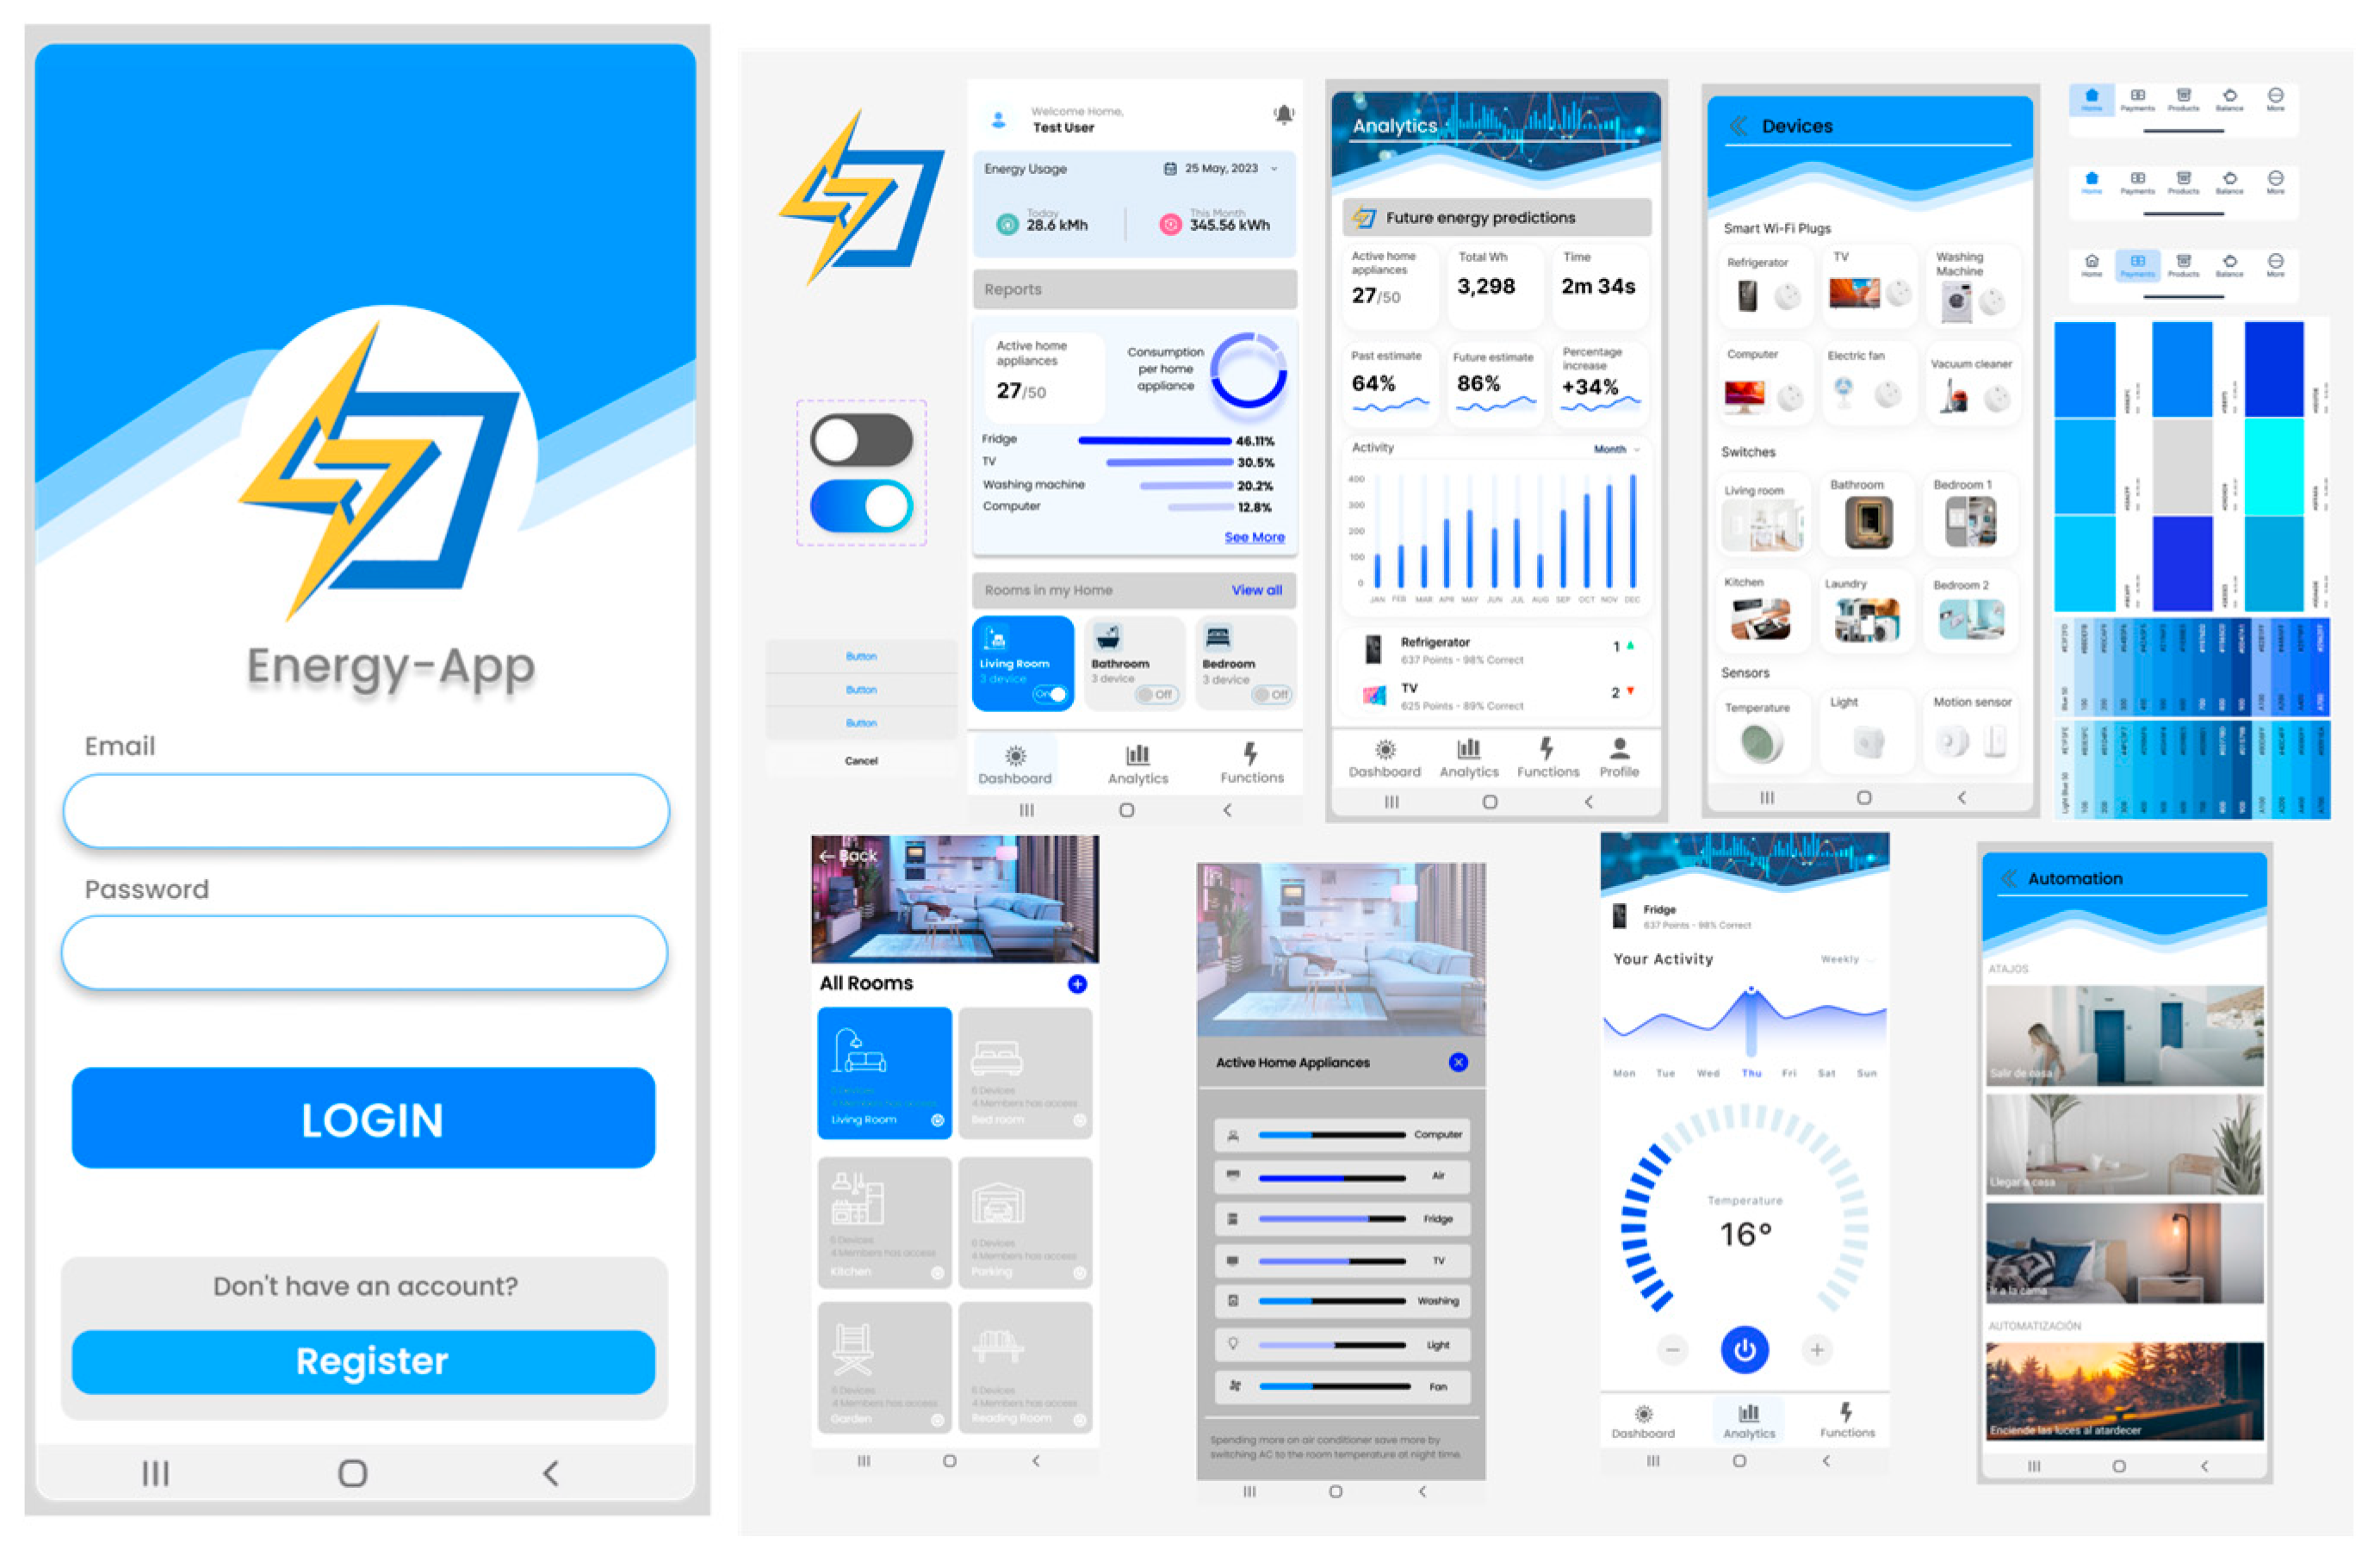
4.3.2. High-Fidelity Prototyping
4.4. Evaluations
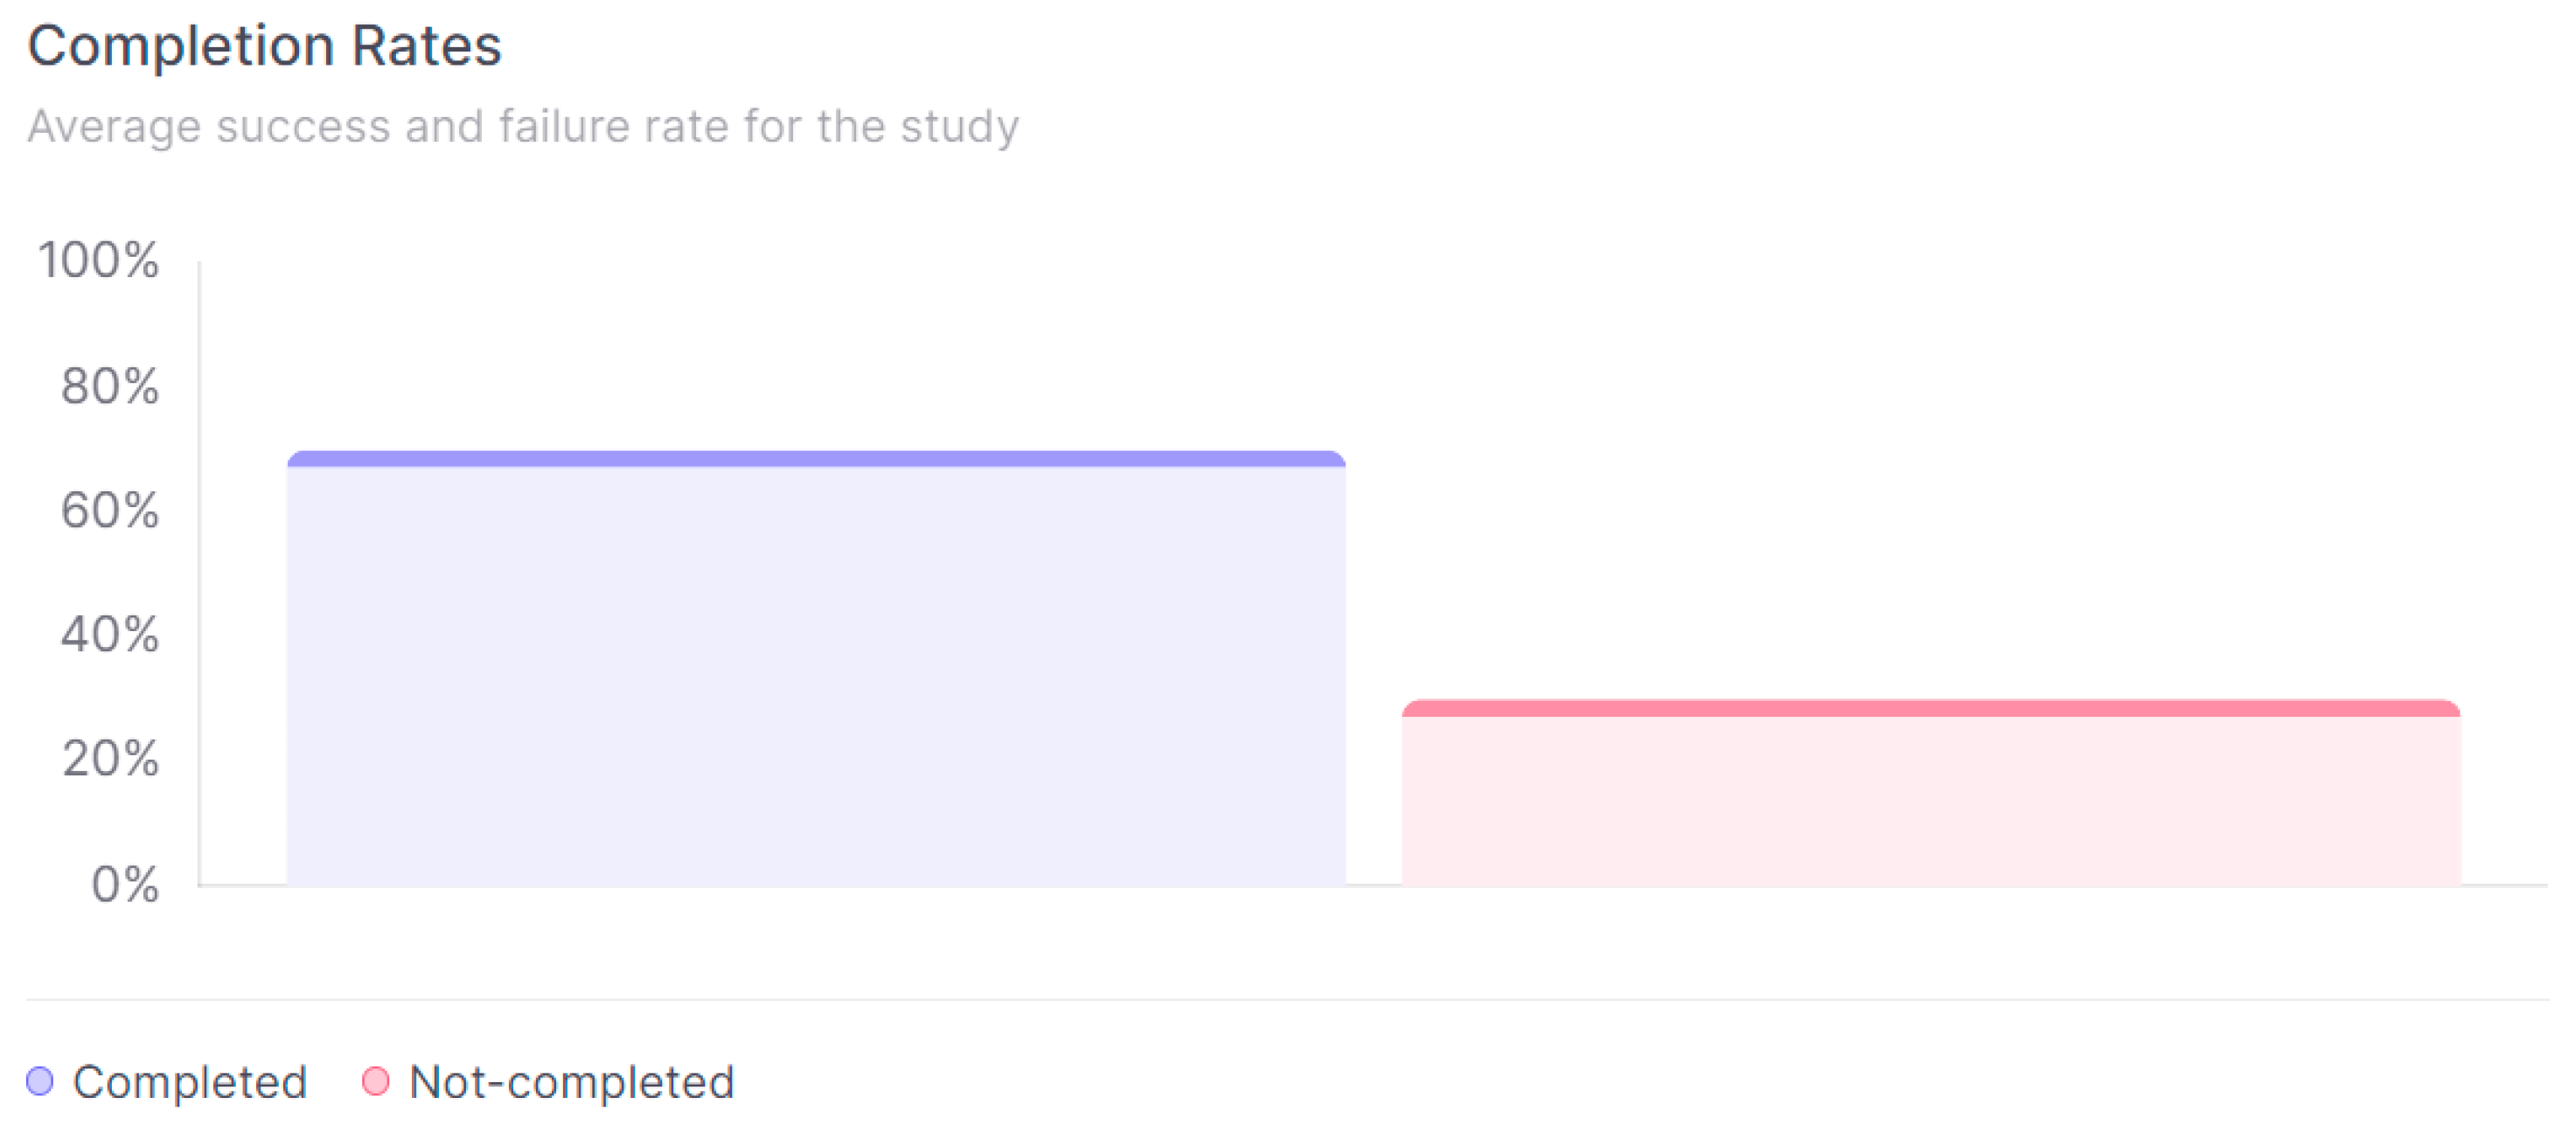
4.4.1. Success and Failure Metrics
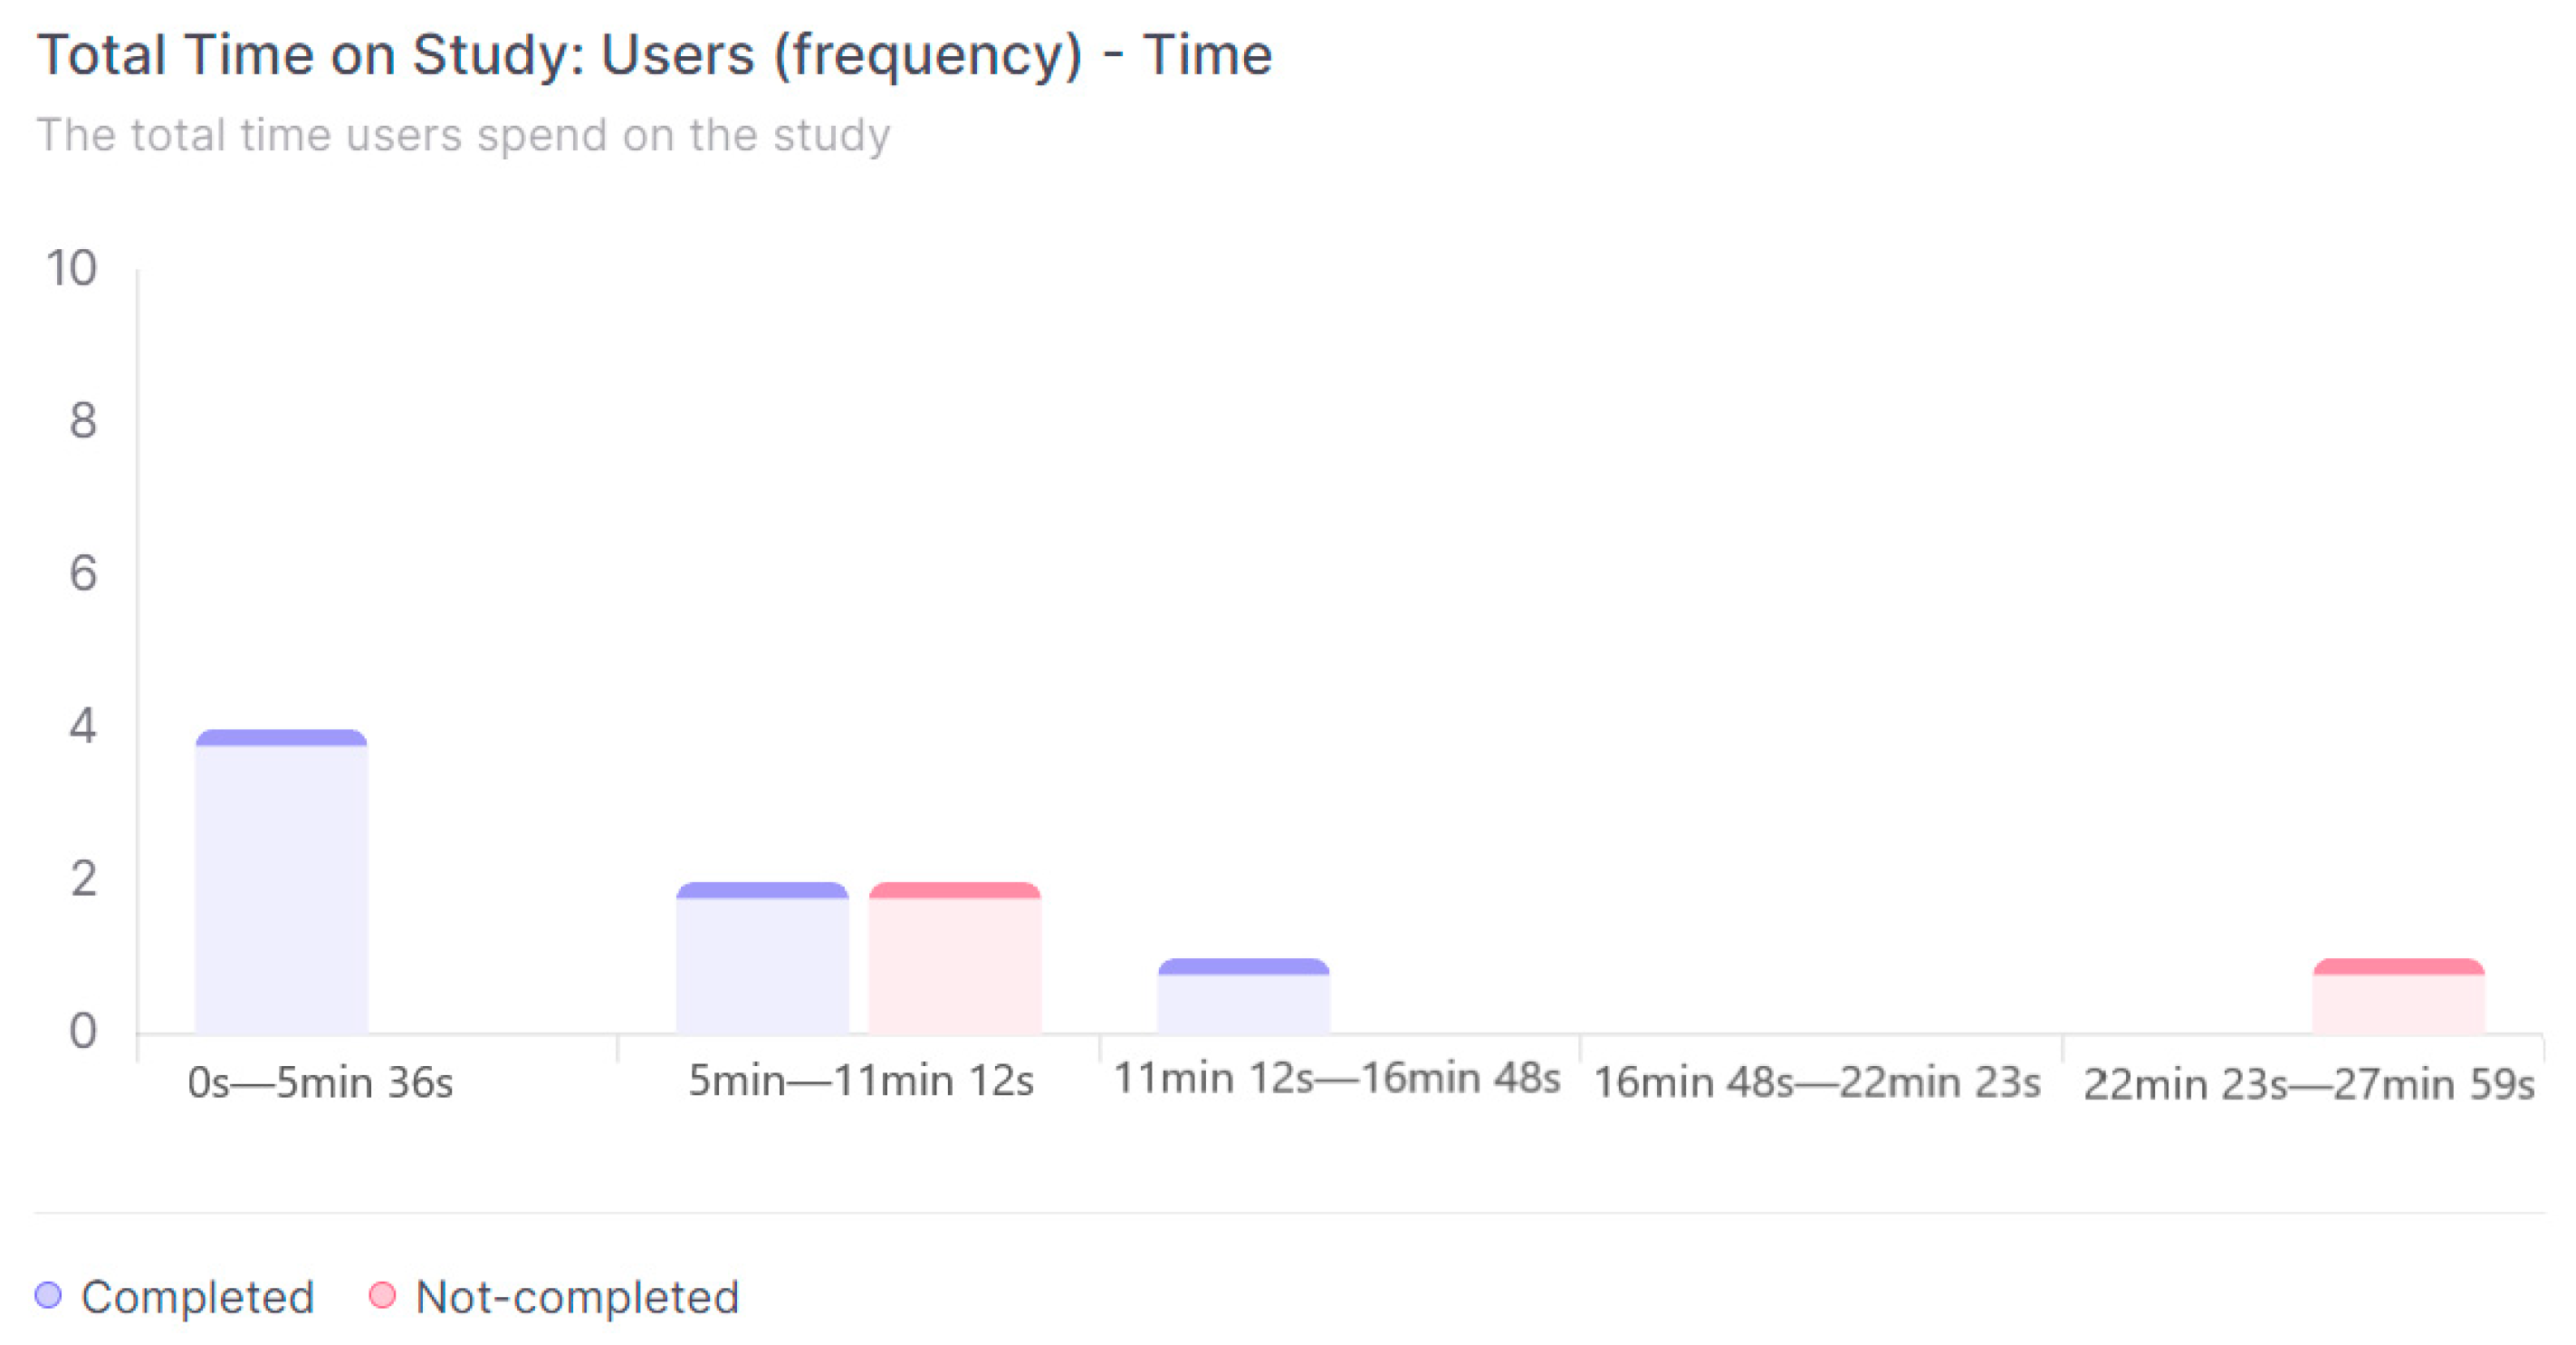
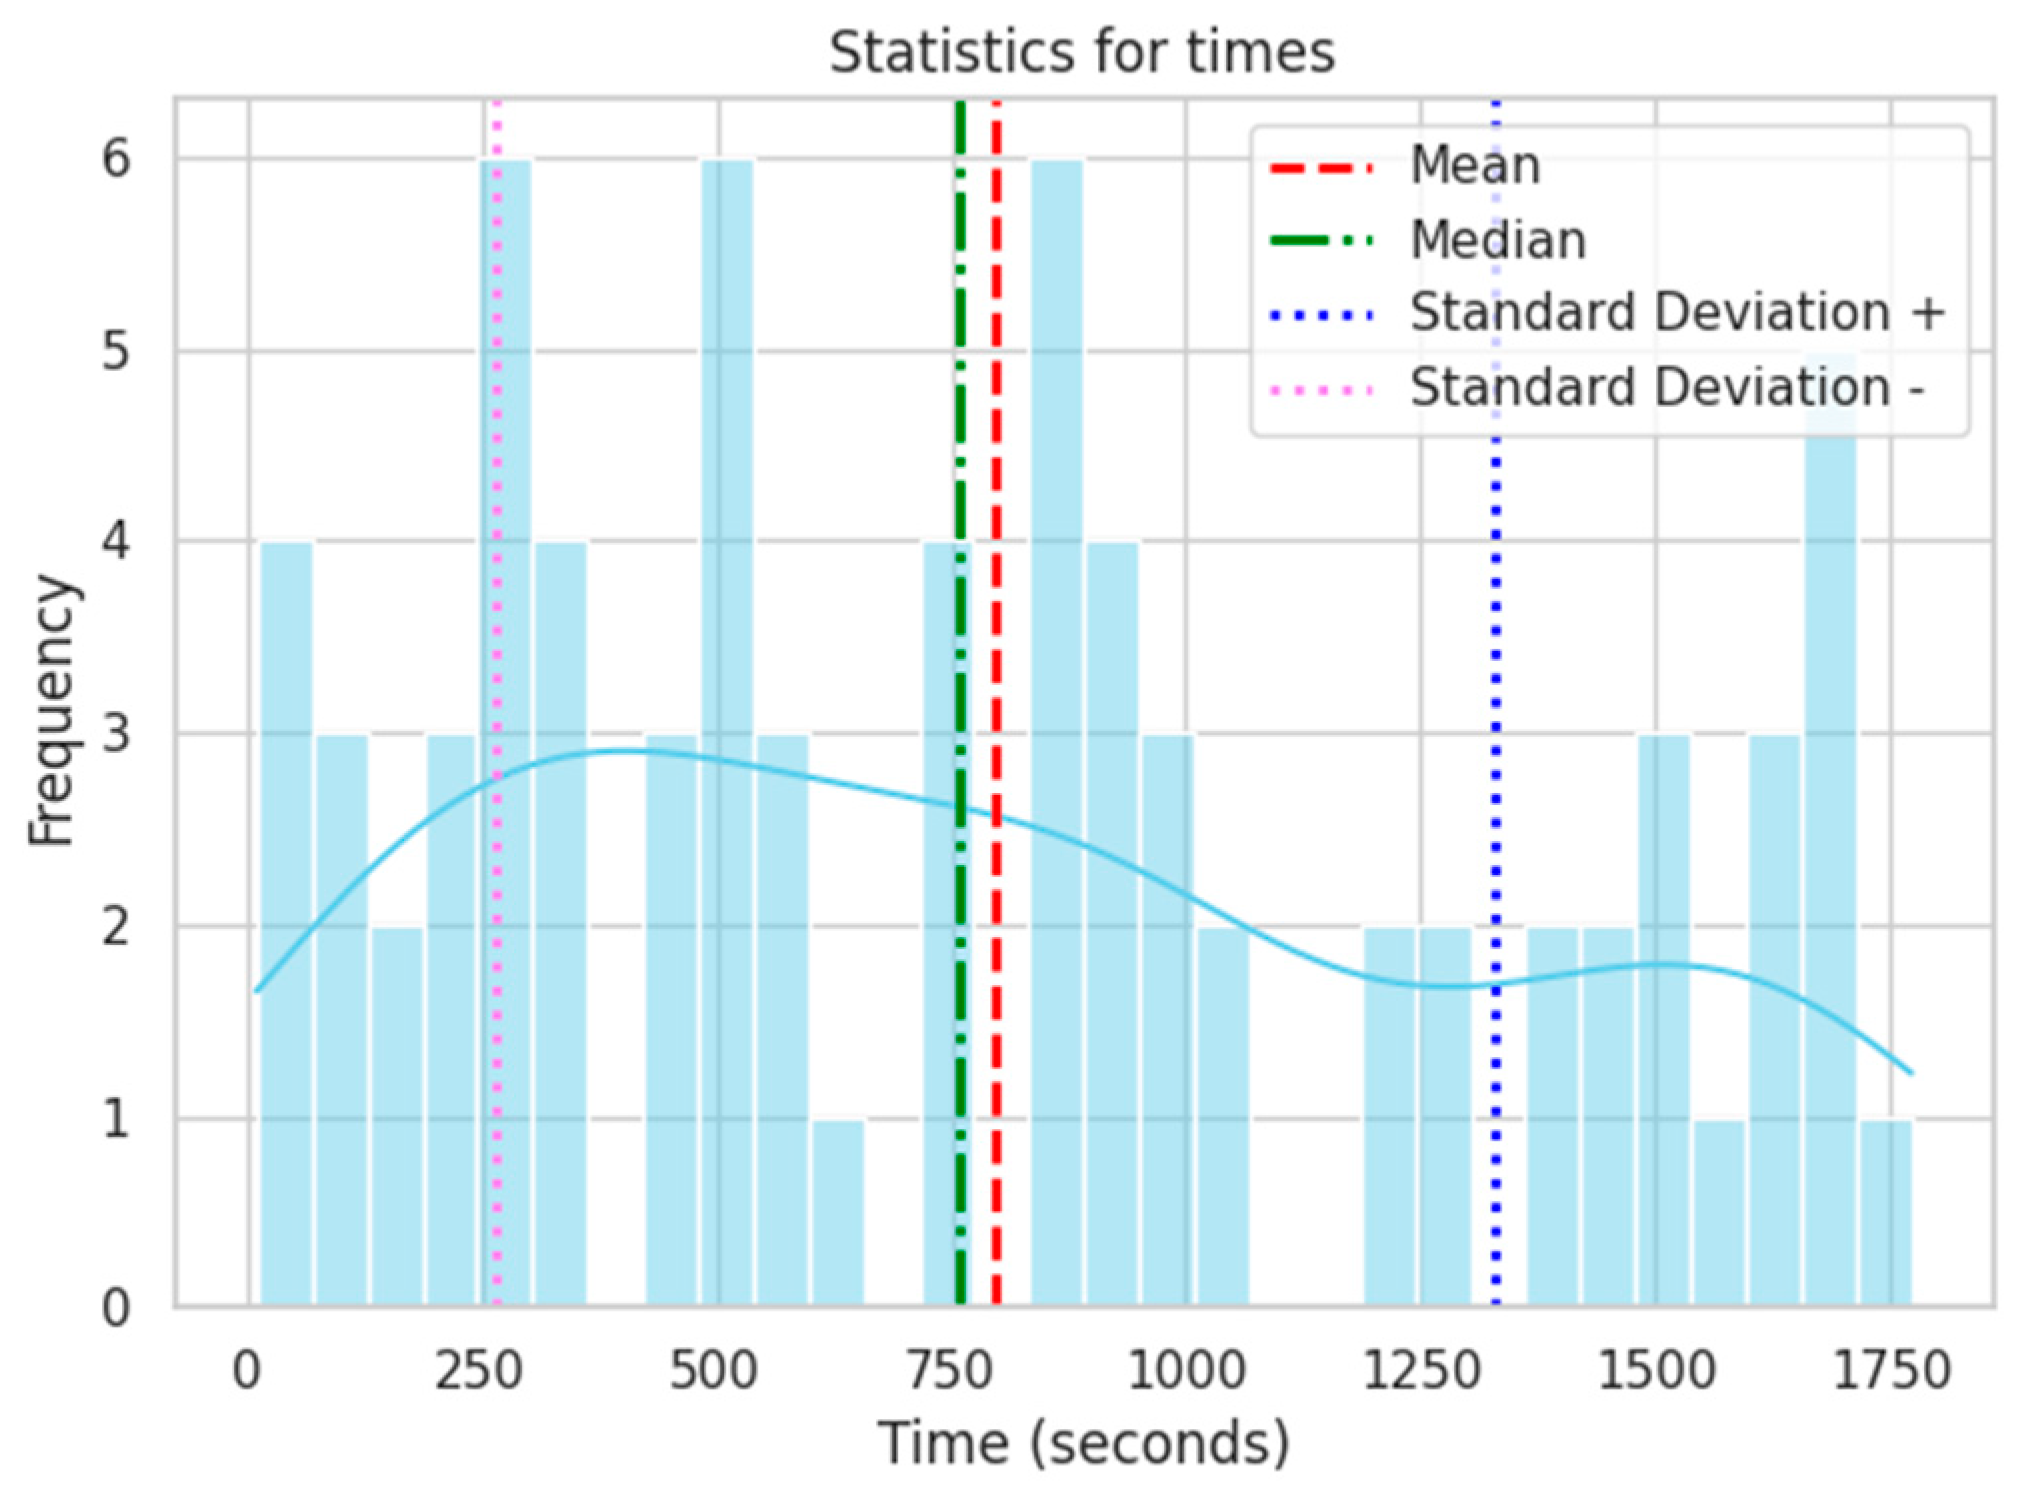
4.4.2. Time Metrics
- Times
- Average Times: The average time is approximately 797.51 s. This suggests that, on average, users take about 13 min and 29 s to complete the task or activity in question.
- Median Time: The median time is approximately 759.28 s. This indicates that half of the users take less than 12 min and 65 s to complete the task, while the other half take longer.
- Mode of Times: The mode of the times is 0:10.62 s. This could indicate a group of users who do not complete the task.
- Standard Deviation of Times: The standard deviation of the times is approximately 531.25 s. This suggests that there is significant variability in user times. Some users may be very fast, while others may be slower.
- Errors
- Average Number of Errors: The average number of errors is approximately 2.19. This indicates that, on average, each user makes about two errors in completing the task.
- Median of Errors: The median of the errors is approximately 2. This suggests that half of the users make two or fewer errors while the other half make more.
- Standard Deviation of Errors: The standard deviation of the number of errors is approximately 1.77. This suggests that the number of errors made by users can vary significantly. Some users may make very few errors, while others may make more errors.
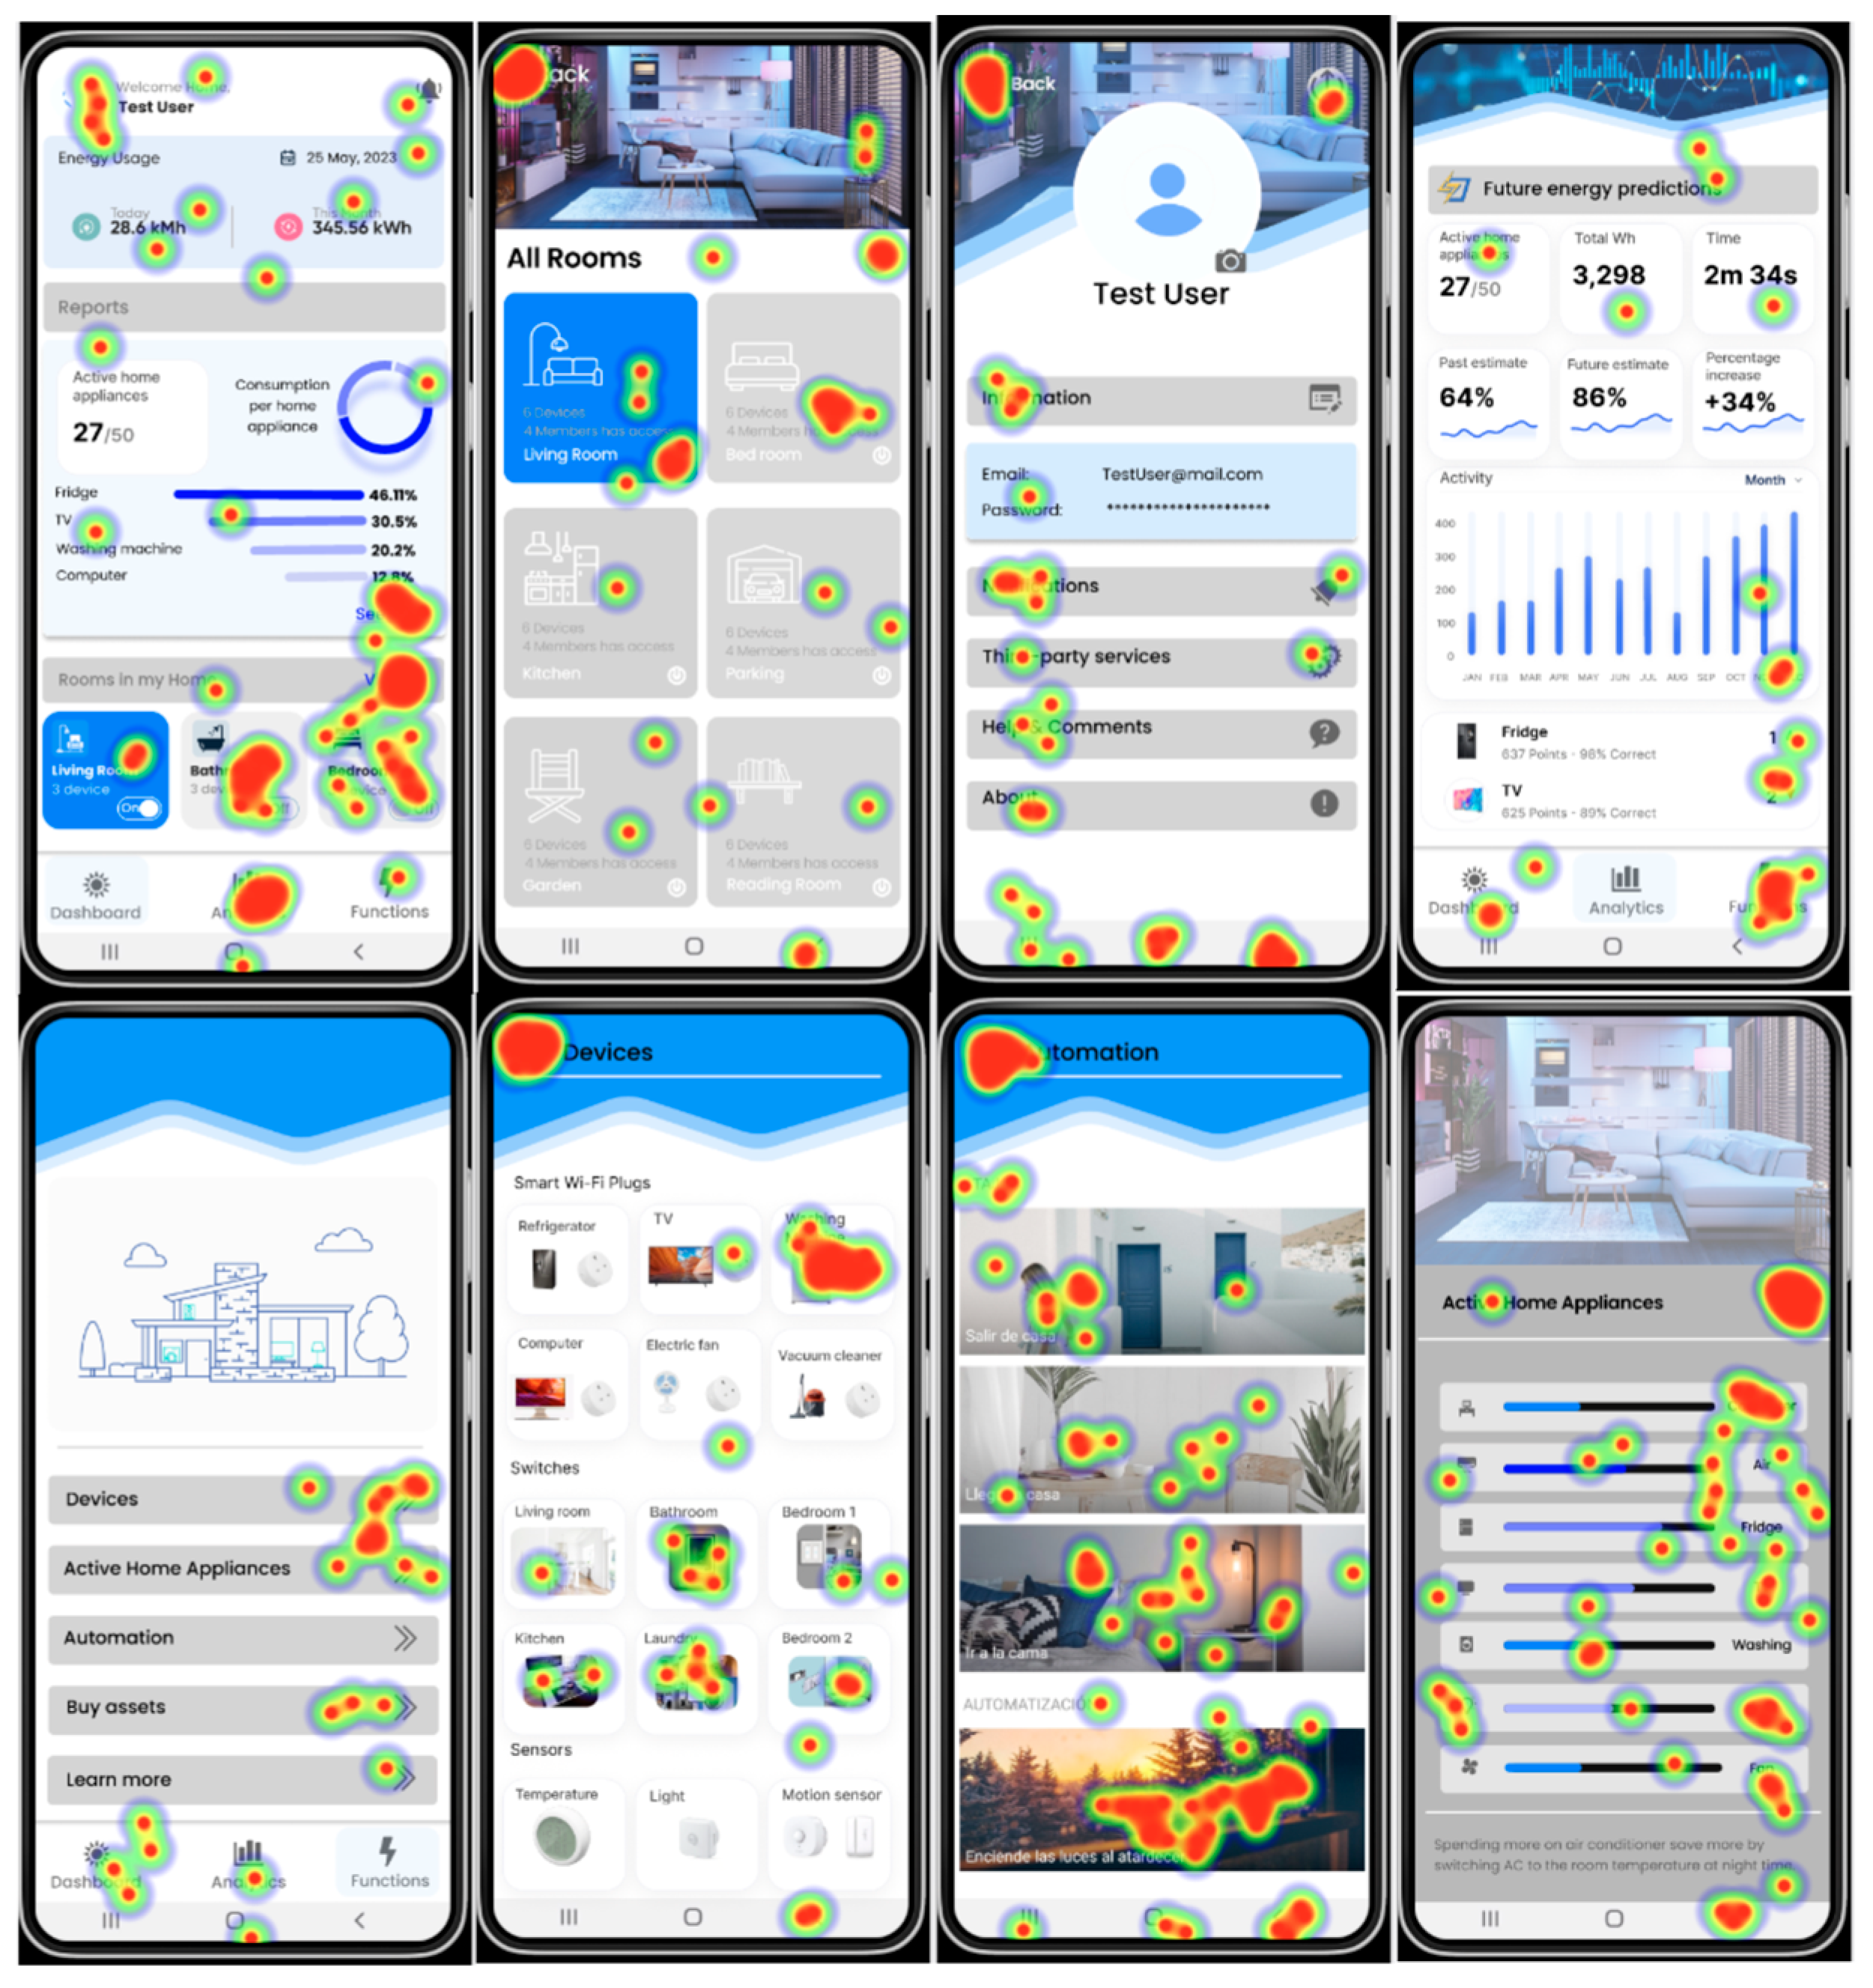
4.4.3. Behavioral Metrics
4.4.4. Interface Satisfaction and User Experience Metrics
5. Fuzzy Model
- Definition of Variables and Fuzzy Sets
- Ease of use (SUS): [0, 101, 1]
- Satisfaction (UEQ-S): [−3, 4, 1]
- Efficiency (average task time): [0, 601, 1]
- Probability of recommendation: [0, 101, 1]
- Overall quality of user experience: [0, 101, 1]
- 2.
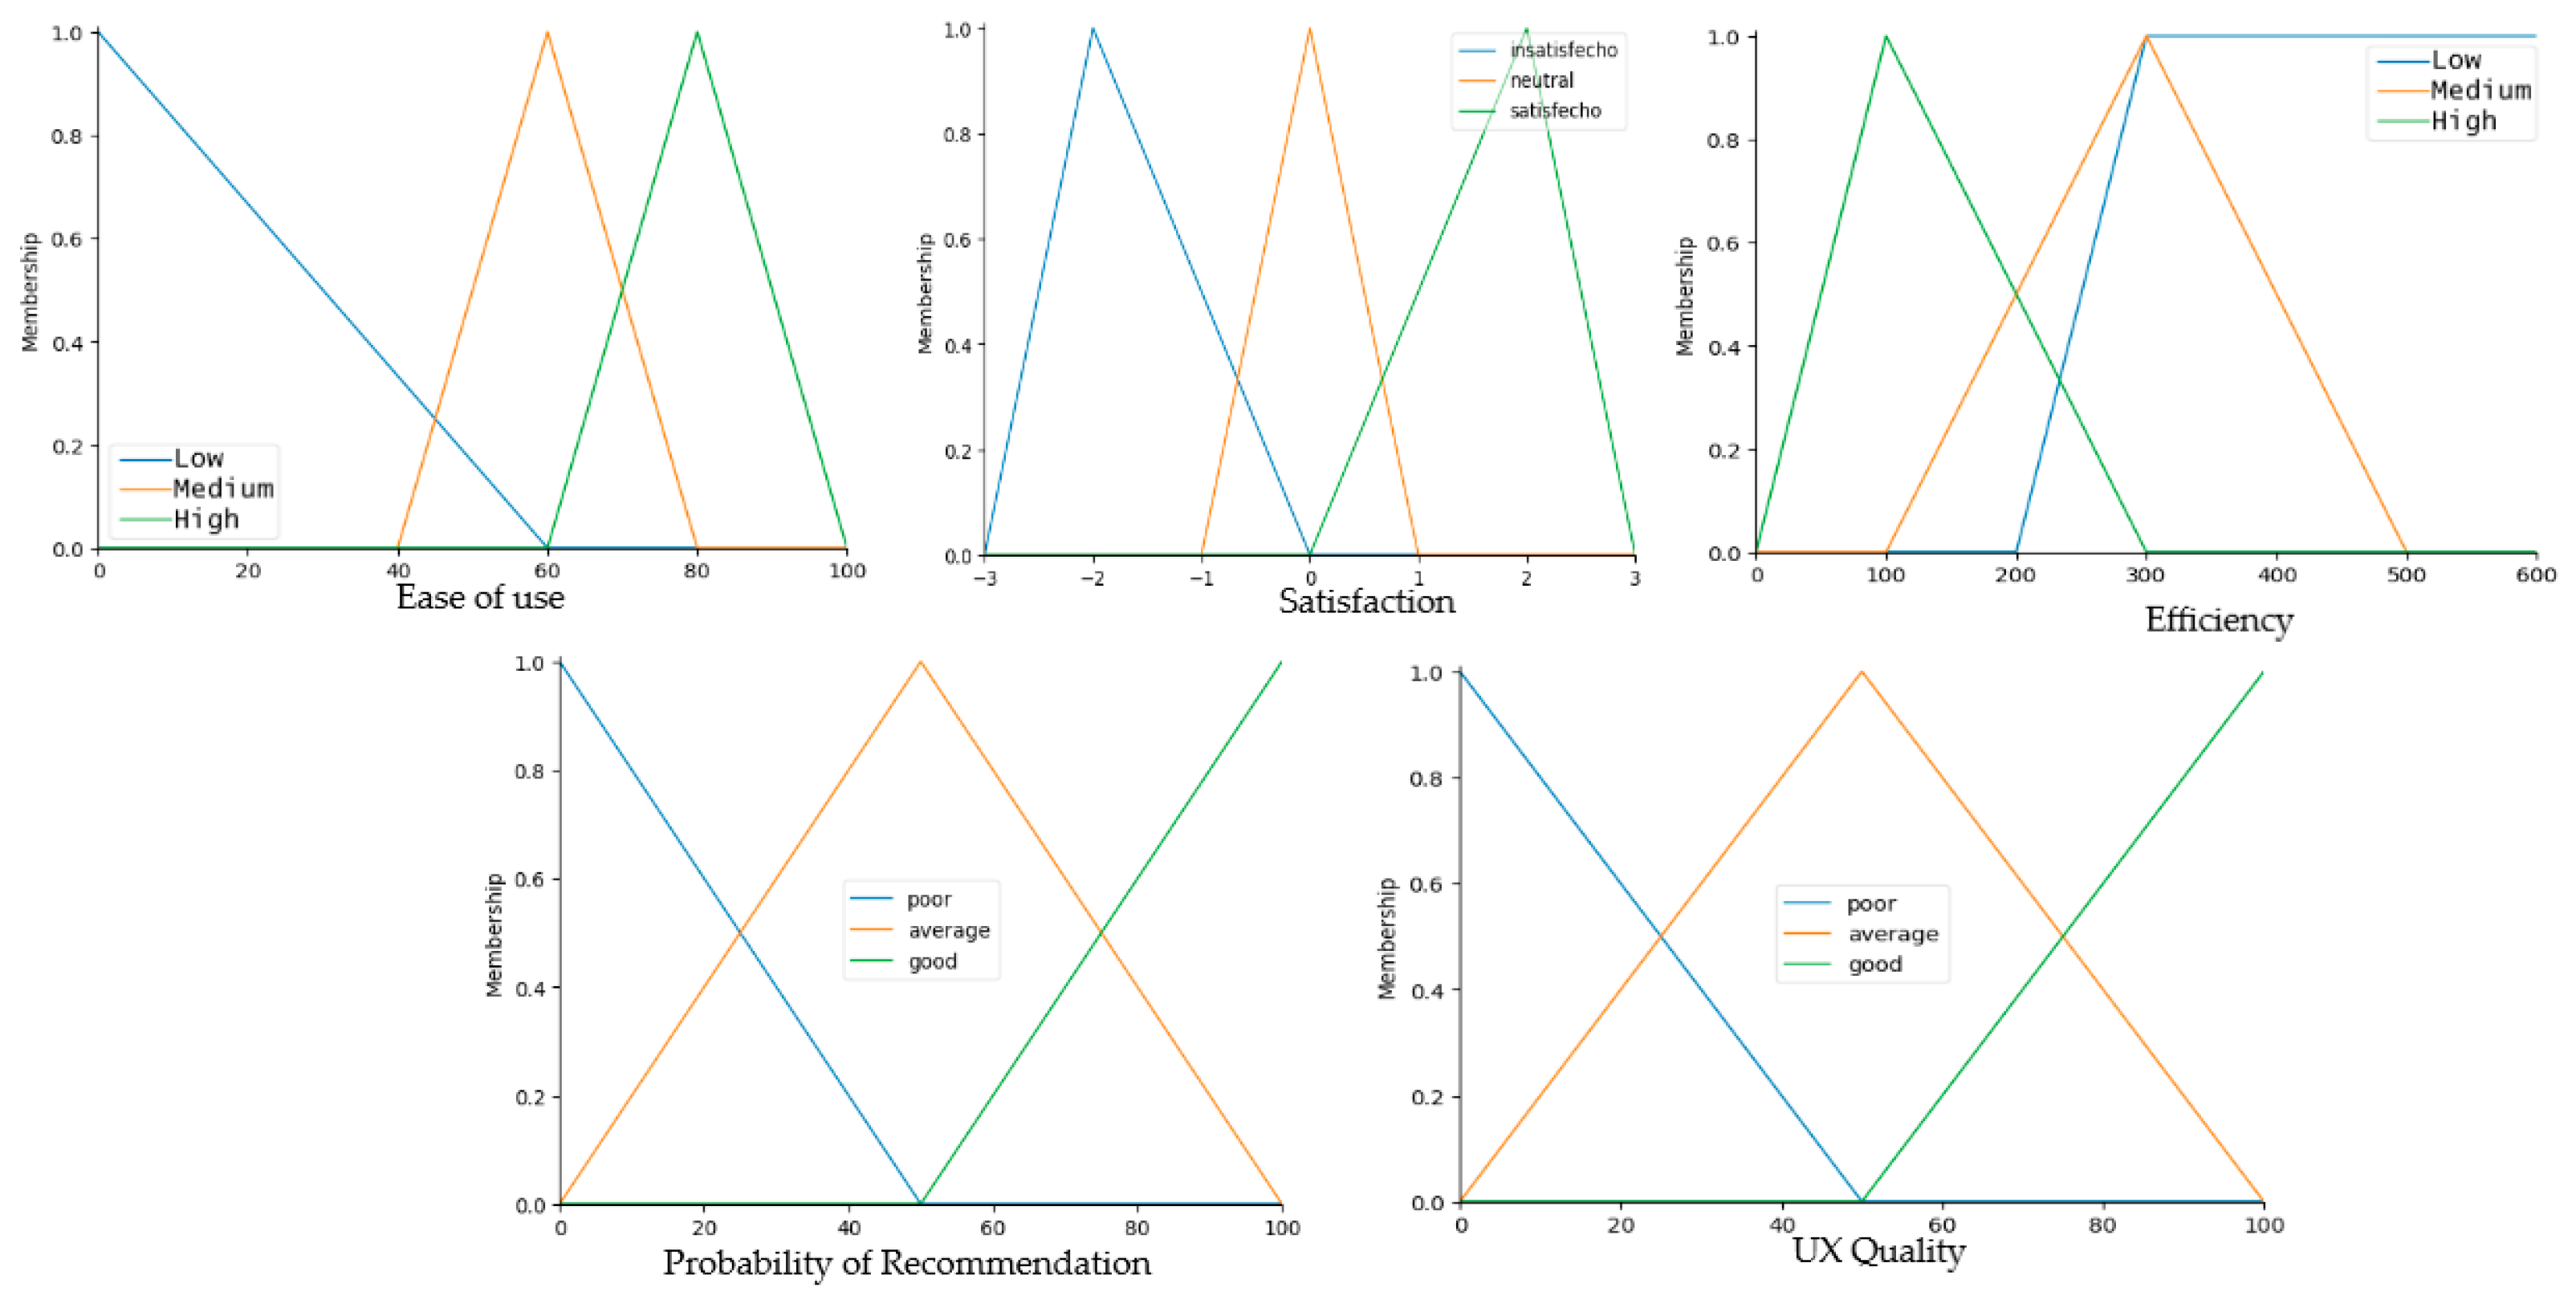
- Creating Membership Functions
- 3.
- Fuzzy Inference Rules
- If ease of use is high and satisfaction is high, then the likelihood of recommendation is high.
- If ease of use is low or satisfaction is low, then the overall quality of experience is low.
- If efficiency is low, then the overall quality of experience is low, regardless of the ease of use and satisfaction.
- If the ease of use is high, satisfaction is high, and efficiency is high, then the quality of the user experience is good.
- If the ease of use is low or satisfaction is low, then the quality of the user experience is poor.
- 4.
- Implementing Fuzzy Inference
- # Creating the control system
- control_system = ctrl.ControlSystem([rule1, rule2, rule3, rule4, rule5])
- control_simulation = ctrl.ControlSystemSimulation(control_system)
- # Set input values
- control_simulation.input[‘Ease of Use’] = 80
- control_simulation.input[‘Satisfaction’] = 2
- control_simulation.input[‘Eficciency’] = 250
- # Compute output values
- control_simulation.compute()
- # Get output values
- output_probabilidad_recomendacion = control_simulation.output[‘Probability of Recomendation]
- output_calidad_ux = control_simulation.output[‘UX Quality’]
- 5.
- Defuzzification
- Weighting: each value of the output variable is multiplied by the corresponding membership function.
- Sum of weighted products: all the products obtained in the previous step are added together.
- Sum of the membership functions: all the membership functions are added together.
- Division: the sum of weighted products is divided by the sum of the membership functions.
6. Results
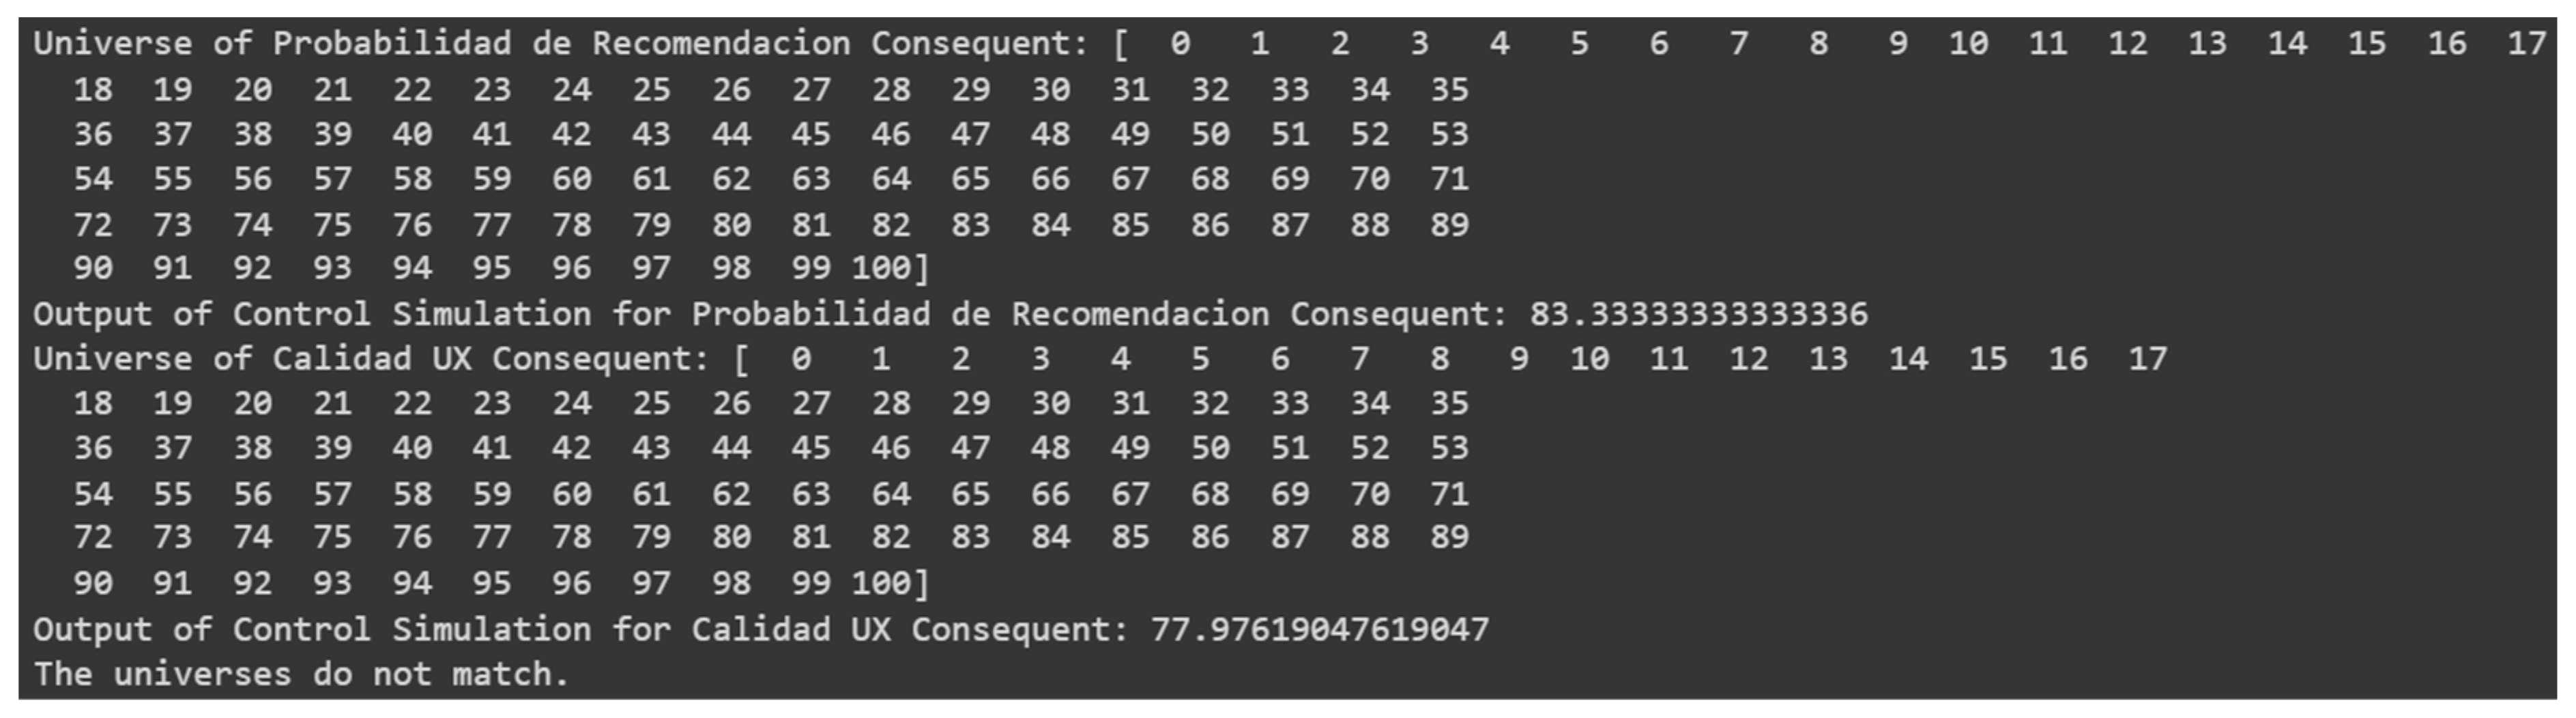
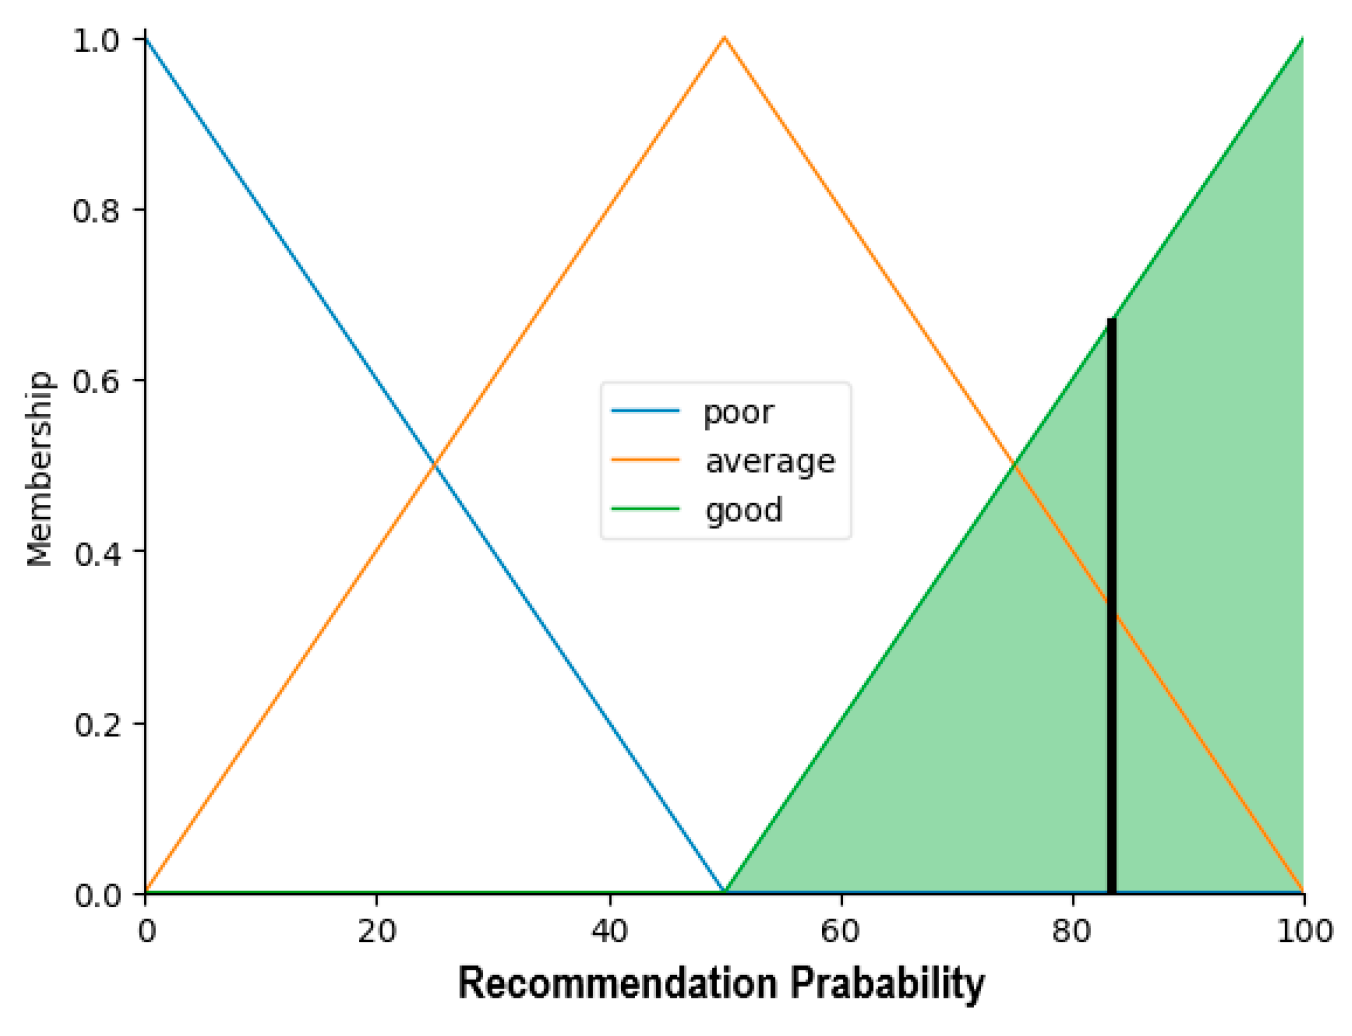
- Figure 15 shows the probability of recommendation (83.33): This value suggests that there is a high probability that users will recommend the mobile interface system for residential energy management. In fuzzy logic, this is deduced from rules that associate inputs of high ease of use and high satisfaction with a high probability of recommendation. Since both ease of use and satisfaction were rated high, the fuzzy inference results in a positive rating. It could be interpreted as an indicator that users are satisfied with the system and willing to share their positive experiences with others.Figure 15. Results of the recommendation probability.
![Applsci 14 01751 g015]()
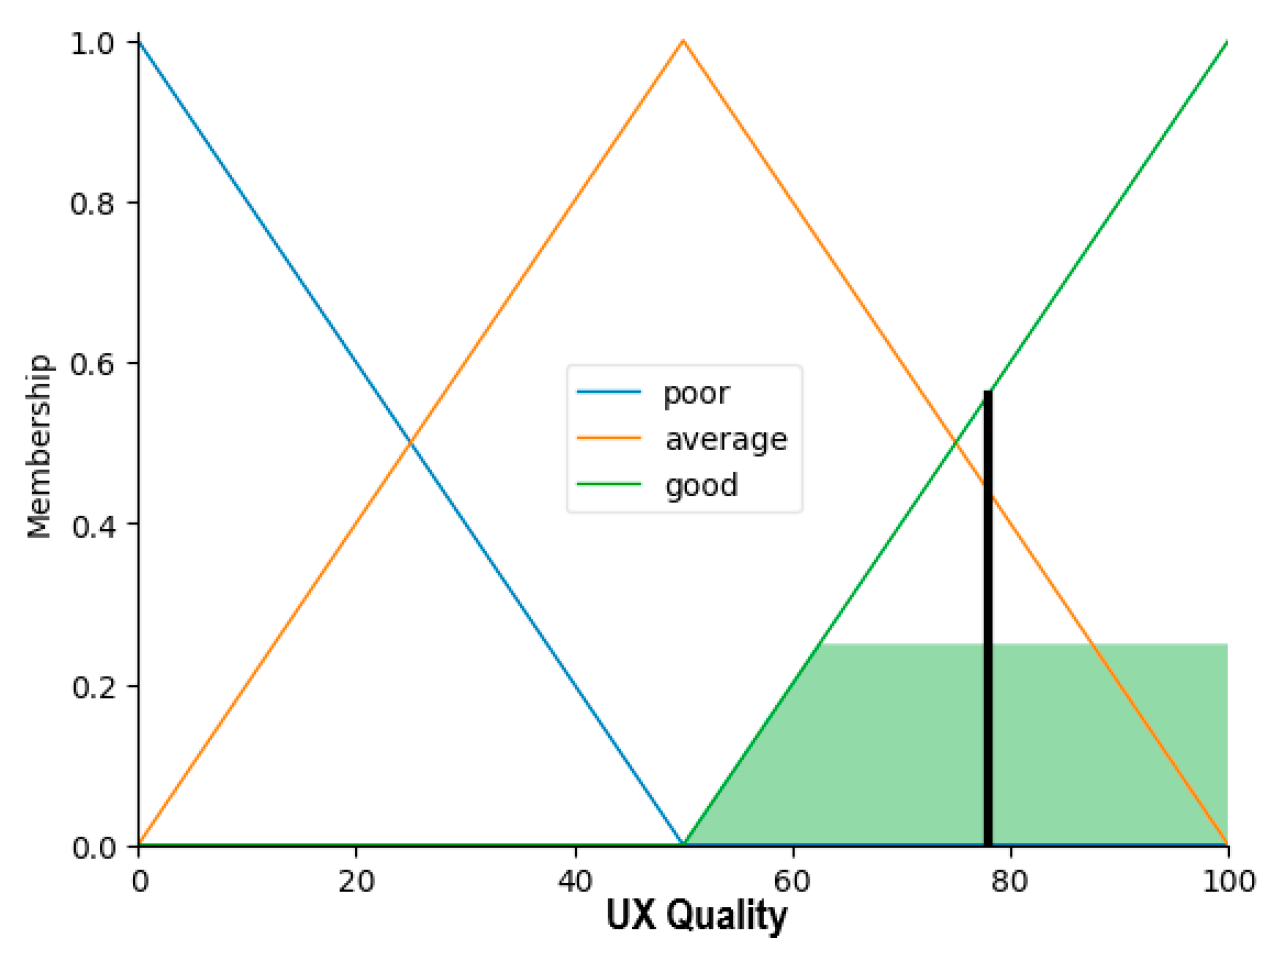
- Figure 16 shows the overall quality of user experience (77.98): This value indicates that the overall quality of user experience with the system is also high. It has been calculated considering ease of use satisfaction and the efficiency of user tasks. It suggests that users find the system easy to use and satisfying and that it allows for efficient interaction.Figure 16. UX quality results.
![Applsci 14 01751 g016]()


7. Discussions
8. Conclusions
Author Contributions
Funding
Institutional Review Board Statement
Informed Consent Statement
Data Availability Statement
Acknowledgments
Conflicts of Interest
References
- Nielsen Norman Group: UX Training, Consulting, & Research; Nielsen Norman Group: Fremont, CA, USA, 2020; Available online: https://www.nngroup.com/ (accessed on 28 August 2023).
- Alturki, R.; Gay, V. Usability Attributes for Mobile Applications: A Systematic Review. In Recent Trends and Advances in Wireless and IoT-Enabled Networks; Jan, M.A., Khan, F., Alam, M., Eds.; EAI/Springer Innovations in Communication and Computing; Springer International Publishing: Cham, Switzerland, 2019; pp. 53–62. [Google Scholar] [CrossRef]
- Silva, R.; Jesus, R.; Jorge, P. Development and Evaluation of a Mobile Application with Augmented Reality for Guiding Visitors on Hiking Trails. Multimodal Technol. Interact. 2023, 7, 58. [Google Scholar] [CrossRef]
- Setiyawati, N.; Bangkalang, D.H. The Comparison of Evaluation on User Experience and Usability of Mobile Banking Applications Using User Experience Questionnaire and System Usability Scale. Proceedings 2022, 82, 87. [Google Scholar] [CrossRef]
- Dietlein, C.S.; Bock, O.L. Development of a Usability Scale Based on the Three ISO 9241-11 Categories “Effectiveness”, “Efficacy” and “Satisfaction”: A Technical Note. Accredit. Qual. Assur. 2019, 24, 181–189. [Google Scholar] [CrossRef]
- ISO 9241-11:2018(en); Ergonomics of Human-System Interaction—Part 11: Usability: Definitions and Concepts. ISO: Geneva, Switzerland, 2018. Available online: https://www.iso.org/obp/ui/#iso:std:iso:9241:-11:ed-2:v1:en (accessed on 15 August 2023).
- Weichbroth, P. Usability of Mobile Applications: A Systematic Literature Study. IEEE Access 2020, 8, 55563–55577. [Google Scholar] [CrossRef]
- Dawood, K.A.; Sharif, K.Y.; Ghani, A.A.; Zulzalil, H.; Zaidan, A.A.; Zaidan, B.B. Towards a Unified Criteria Model for Usability Evaluation in the Context of Open Source Software Based on a Fuzzy Delphi Method. Inf. Softw. Technol. 2021, 130, 106453. [Google Scholar] [CrossRef]
- Gupta, D.; Ahlawat, A.K.; Sharma, A.; Rodrigues, J.J.P.C. Feature Selection and Evaluation for Software Usability Model Using Modified Moth-Flame Optimization. Computing 2020, 102, 1503–1520. [Google Scholar] [CrossRef]
- ISO 9241-210:2019; Ergonomics of Human-System Interaction—Part 210: Human-Centred Design for Interactive Systems. ISO: Geneva, Switzerland, 2019. Available online: https://www.iso.org/standard/77520.html (accessed on 30 August 2023).
- Escanillan-Galera, K.M.P.; Vilela-Malabanan, C.M. Evaluating on User Experience and User Interface (UX/UI) of EnerTrApp a Mobile Web Energy Monitoring System. Procedia Comput. Sci. 2019, 161, 1225–1232. [Google Scholar] [CrossRef]
- Castro, L.A.; Gaytán-Lugo, L.S.; Santana-Mancilla, P.C.; Herskovic, V.; Valderrama Bahamondez, E. del C. Human Computer-Interaction in Latin America. Pers. Ubiquit Comput. 2021, 25, 255–257. [Google Scholar] [CrossRef] [PubMed]
- Díaz-Oreiro, I.; López, G.; Quesada, L.; Guerrero, L.A. UX Evaluation with Standardized Questionnaires in Ubiquitous Computing and Ambient Intelligence: A Systematic Literature Review. Adv. Hum.-Comput. Interact. 2021, 2021, 5518722. [Google Scholar] [CrossRef]
- Chawla, P.; Bathla, R. Unconventional Content Strategy and Hierarchical Taxonomy for Modern Web and Mobile App Design. In Proceedings of the 2019 2nd International Conference on Power Energy, Environment and Intelligent Control (PEEIC), Greater Noida, India, 18–19 October 2019; pp. 84–87. [Google Scholar] [CrossRef]
- Zhang, L.; Qu, Q.-X.; Chao, W.-Y.; Duffy, V.G. Investigating the Combination of Adaptive UIs and Adaptable UIs for Improving Usability and User Performance of Complex UIs. Int. J. Hum.–Comput. Interact. 2020, 36, 82–94. [Google Scholar] [CrossRef]
- Johnson, J. Designing with the Mind in Mind: The Psychological Basis of User Interface Design Guidelines. In Proceedings of the Extended Abstracts of the 2021 CHI Conference on Human Factors in Computing Systems, CHI EA ’21, Yokohama, Japan, 8–13 May 2021; Association for Computing Machinery: New York, NY, USA, 2021; pp. 1–2. [Google Scholar] [CrossRef]
- Alghamdi, A.M.; Riasat, H.; Iqbal, M.W.; Ashraf, M.U.; Alshahrani, A.; Alshamrani, A. Intelligence and Usability Empowerment of Smartphone Adaptive Features. Appl. Sci. 2022, 12, 12245. [Google Scholar] [CrossRef]
- Ahram, M.M.S.; Francisco Rebelo Tareq, Z. (Eds.) Handbook of Usability and User-Experience: Research and Case Studies; CRC Press: Boca Raton, FL, USA, 2022. [Google Scholar] [CrossRef]
- Chanchí-Golondrino, G.E.; Ospina-Alarcón, M.A.; Campo-Muñoz, W.Y. Proposal of a Tool for the Analysis of Usability Heuristic Evaluations Using Fuzzy Logic. Ing. Y Compet. 2022, 24. [Google Scholar] [CrossRef]
- Berendes, S.; Hilpert, S.; Günther, S.; Muschner, C.; Candas, S.; Hainsch, K.; van Ouwerkerk, J.; Buchholz, S.; Söthe, M. Evaluating the Usability of Open Source Frameworks in Energy System Modelling. Renew. Sustain. Energy Rev. 2022, 159, 112174. [Google Scholar] [CrossRef]
- Tongsubanan, S.; Kasemsarn, K. Sustainability at Home: The Development of an Efficient Framework for Home Energy-Saving Applications. Designs 2023, 7, 101. [Google Scholar] [CrossRef]
- Muhyidin, M.A.; Sulhan, M.A.; Sevtiana, A. Perancangan Ui/Ux Aplikasi My Cic Layanan Informasi Akademik Mahasiswa Menggunakan Aplikasi Figma. J. Digit. 2020, 10, 208–219. [Google Scholar] [CrossRef]
- Paniagua, A.; Bedoya, D.; Mera, C. Un método para la evaluación de la accesibilidad y la usabilidad en aplicaciones móviles. TecnoLógicas 2020, 23, 98–116. [Google Scholar] [CrossRef]
- Janoskova, P.; Stofkova, K.R.; Kovacikova, M.; Stofkova, J.; Kovacikova, K. The Concept of a Smart City Communication in the Form of an Urban Mobile Application. Sustainability 2021, 13, 9703. [Google Scholar] [CrossRef]
- Avila, M.; Méndez, J.I.; Ponce, P.; Peffer, T.; Meier, A.; Molina, A. Energy Management System Based on a Gamified Application for Households. Energies 2021, 14, 3445. [Google Scholar] [CrossRef]
- Khune, A.; Pasricha, S. Mobile Network-Aware Middleware Framework for Cloud Offloading: Using Reinforcement Learning to Make Reward-Based Decisions in Smartphone Applications. IEEE Consum. Electron. Mag. 2019, 8, 42–48. [Google Scholar] [CrossRef]
- Baumgartner, J.; Ruettgers, N.; Hasler, A.; Sonderegger, A.; Sauer, J. Questionnaire Experience and the Hybrid System Usability Scale: Using a Novel Concept to Evaluate a New Instrument. Int. J. Hum.-Comput. Stud. 2021, 147, 102575. [Google Scholar] [CrossRef]
- Hernandez, T.; Lara, A.; Lopez, G.; Quesada, L. Smart Home Interface Design: An Information Architecture Approach. In Proceedings of the 15th International Conference on Ubiquitous Computing & Ambient Intelligence (UCAmI 2023), Riviera Maya, Mexico, 28–29 November 2023; Bravo, J., Urzáiz, G., Eds.; Lecture Notes in Networks and Systems. Springer Nature: Cham, Switzerland, 2023; pp. 90–101. [Google Scholar] [CrossRef]
- Lopez, G.; Gaytan-Lugo, L.S.; Collazos, C.; Garcia Luna, V.M.; Lopez, C.; Prietch, S.S.; Wong-Villacres, M. Todo Cambia: Desafios y Oportunidades En HCI En LATAM. In Proceedings of the XI Latin American Conference on Human Computer Interaction, CLIHC ’23, Puebla, Mexico, 30 October–1 November 2023; Association for Computing Machinery: New York, NY, USA, 2024; pp. 1–3. [Google Scholar] [CrossRef]
- Losana, P.; Castro, J.W.; Ferre, X.; Villalba-Mora, E.; Acuña, S.T. A Systematic Mapping Study on Integration Proposals of the Personas Technique in Agile Methodologies. Sensors 2021, 21, 6298. [Google Scholar] [CrossRef]
- Hassan, A.; Sulaiman, R.; Abdulgabber, M.A.; Kahtan, H. Towards User-Centric Explanations for Explainable Models: A Review. J. Inf. Syst. Technol. Manag. 2021, 6, 36–50. [Google Scholar] [CrossRef]
- Sandesara, M.; Bodkhe, U.; Tanwar, S.; Alshehri, M.D.; Sharma, R.; Neagu, B.-C.; Grigoras, G.; Raboaca, M.S. Design and Experience of Mobile Applications: A Pilot Survey. Mathematics 2022, 10, 2380. [Google Scholar] [CrossRef]
- Mata-Serrano, J.C.; Díaz-Oreiro, I.; López, G.; Guerrero, L.A. Comparing Written and Voice Captured Responses of the User Experience Questionnaire (UEQ). In Information Technology and Systems; Rocha, Á., Ferrás, C., Méndez Porras, A., Jimenez Delgado, E., Eds.; Lecture Notes in Networks and Systems; Springer International Publishing: Cham, Switzerland, 2022; pp. 519–529. [Google Scholar] [CrossRef]
- Ramadhani, M.; Susanto, A.A.; Mustofa, F.; Tauda, V.S. Design and User Experience Evaluation of Bersii Android-Based Mobile Application User Interface. J. Comput. Sci. Inf. Technol. 2022, 14, 41–49. [Google Scholar] [CrossRef]
- Hinderks, A.; Meiners, A.-L.; Mayo, F.; Thomaschewski, J. Interpreting the Results from the User Experience Questionnaire (UEQ) Using Importance-Performance Analysis (IPA). In Proceedings of the 15th International Conference on Web Information Systems and Technologies, Vienna, Austria, 18–20 September 2019; SCITEPRESS—Science and Technology Publications: Vienna, Austria, 2019; pp. 388–395. [Google Scholar] [CrossRef]
- Blattgerste, J.; Behrends, J.; Pfeiffer, T. A Web-Based Analysis Toolkit for the System Usability Scale. In Proceedings of the 15th International Conference on PErvasive Technologies Related to Assistive Environments, PETRA ’22, Corfu, Greece, 29 June–1 July 2022; Association for Computing Machinery: New York, NY, USA, 2022; pp. 237–246. [Google Scholar] [CrossRef]
- Sujito, F.; Arifudin, R.; Arini, F.Y. An Analysis of User Interface and User Experience Using System Usability Scale and GOMS Method. J. Adv. Inf. Syst. Technol. 2019, 1, 65–73. [Google Scholar] [CrossRef]
- Gao, M.; Kortum, P.; Oswald, F.L. Multi-Language Toolkit for the System Usability Scale. Int. J. Hum.–Comput. Interact. 2020, 36, 1883–1901. [Google Scholar] [CrossRef]
- Tor-Carroggio, I.; Segura, D.; Soler-Vilageliu, O. Usability as a Premise of Quality: First Steps Towards the Validation of the System Usability Scale (SUS) into Spanish. J. Audiov. Transl. 2019, 2, 57–71. [Google Scholar] [CrossRef]
- Sevilla-Gonzalez, M.D.R.; Loaeza, L.M.; Lazaro-Carrera, L.S.; Ramirez, B.B.; Rodríguez, A.V.; Peralta-Pedrero, M.L.; Almeda-Valdes, P. Spanish Version of the System Usability Scale for the Assessment of Electronic Tools: Development and Validation. JMIR Hum. Factors 2020, 7, e21161. [Google Scholar] [CrossRef] [PubMed]
- Kaya, A.; Ozturk, R.; Altin Gumussoy, C. Usability Measurement of Mobile Applications with System Usability Scale (SUS). In Industrial Engineering in the Big Data Era; Calisir, F., Cevikcan, E., Camgoz Akdag, H., Eds.; Lecture Notes in Management and Industrial Engineering; Springer International Publishing: Cham, Switzerland, 2019; pp. 389–400. [Google Scholar] [CrossRef]
- Grobelny, J.; Michalski, R. Scatter Plots Based on Fuzzy Logic in Supporting the Design of Graphical Interfaces. In Artificial Intelligence in HCI; Degen, H., Ntoa, S., Eds.; Lecture Notes in Computer Science; Springer Nature: Cham, Switzerland, 2023; pp. 506–518. [Google Scholar] [CrossRef]
- Hrehová, S.; Husár, J.; Knapčíková, L. The Fuzzy Logic Predictive Model for Remote Increasing Energy Efficiency. Mob. Netw. Appl. 2022. [Google Scholar] [CrossRef]
- Serrano-Guerrero, J.; Romero, F.P.; Olivas, J.A. Fuzzy Logic Applied to Opinion Mining: A Review. Knowl.-Based Syst. 2021, 222, 107018. [Google Scholar] [CrossRef]
- Mittal, K.; Jain, A.; Vaisla, K.S.; Castillo, O.; Kacprzyk, J. A Comprehensive Review on Type 2 Fuzzy Logic Applications: Past, Present and Future. Eng. Appl. Artif. Intell. 2020, 95, 103916. [Google Scholar] [CrossRef]
- Sánchez-Gálvez, L.A.; Fernández-Luna, J.M.; Anzures-García, M. A Groupware Usability-Oriented Evaluation Methodology Based on a Fuzzy Linguistic Approach. In Human-Computer Interaction; Ruiz, P.H., Agredo-Delgado, V., Eds.; Communications in Computer and Information Science; Springer International Publishing: Cham, Switzerland, 2019; pp. 1–16. [Google Scholar] [CrossRef]
- Zúñiga, P.I.V.; Cedeño, R.J.C.; Palacios, I.A.M. Metodología de la investigación científica: Guía práctica. Cienc. Lat. Rev. Cient. Multidiscip. 2023, 7, 9723–9762. [Google Scholar] [CrossRef]
- Peláez, C.A.; Solano, A.; Granollers, T.; Collazos, C. Methodologies and Trends in Multimedia Systems: A Systematic Literature Review. In Social Computing and Social Media. Design, Human Behavior and Analytics; Meiselwitz, G., Ed.; Lecture Notes in Computer Science; Springer International Publishing: Cham, Switzerland, 2019; pp. 109–127. [Google Scholar] [CrossRef]
- Li, J.W.; Tigwell, G.; Shinohara, K. Accessibility of High-Fidelity Prototyping Tools. In Proceedings of the 2021 CHI Conference on Human Factors in Computing Systems, CHI ’21, Yokohama, Japan, 8–13 May 2021; Association for Computing Machinery: New York, NY, USA, 2021; pp. 1–17. [Google Scholar] [CrossRef]
- Kravchenko, T.; Bogdanova, T.; Shevgunov, T. Ranking Requirements Using MoSCoW Methodology in Practice. In Cybernetics Perspectives in Systems; Silhavy, R., Ed.; Lecture Notes in Networks and Systems; Springer International Publishing: Cham, Switzerland, 2022; pp. 188–199. [Google Scholar] [CrossRef]
- Nuñez, I.; Cano, E.E.; Cruz, E.; Rovetto, C. Designing a Comprehensive and Flexible Architecture to Improve Energy Efficiency and Decision-Making in Managing Energy Consumption and Production in Panama. Appl. Sci. 2023, 13, 5707. [Google Scholar] [CrossRef]
- Poniszewska-Maranda, A.; Kaczmarek, D.; Kryvinska, N.; Xhafa, F. Studying Usability of AI in the IoT Systems/Paradigm through Embedding NN Techniques into Mobile Smart Service System. Computing 2019, 101, 1661–1685. [Google Scholar] [CrossRef]
- Nikou, S.A.; Economides, A.A. A Comparative Study between a Computer-Based and a Mobile-Based Assessment: Usability and User Experience. Interact. Technol. Smart Educ. 2019, 16, 381–391. [Google Scholar] [CrossRef]
- Tiong, E.; Seow, O.; Camburn, B.; Teo, K.; Silva, A.; Wood, K.L.; Jensen, D.D.; Yang, M.C. The Economies and Dimensionality of Design Prototyping: Value, Time, Cost, and Fidelity. J. Mech. Des. 2019, 141, 031105. [Google Scholar] [CrossRef]
- Schrepp, M.; Kollmorgen, J.; Thomaschewski, J. A Comparison of SUS, UMUX-LITE, and UEQ-S. J. User Exper. 2023, 18, 86–104. [Google Scholar]
- He, S. Applying Stepped Task in Remote Unmoderated Test: A Case Report. In HCI International 2021—Posters; Stephanidis, C., Antona, M., Ntoa, S., Eds.; Communications in Computer and Information Science; Springer International Publishing: Cham, Switzerland, 2021; pp. 33–40. [Google Scholar] [CrossRef]
- Osada, K.; Zihisire Muke, P.; Piwowarczyk, M.; Telec, Z.; Trawiński, B. Remote Usability Testing of Data Input Methods for Web Applications. In Intelligent Information and Database Systems; Nguyen, N.T., Jearanaitanakij, K., Selamat, A., Trawiński, B., Chittayasothorn, S., Eds.; Lecture Notes in Computer Science; Springer International Publishing: Cham, Switzerland, 2020; pp. 622–635. [Google Scholar] [CrossRef]
- Nemeth, A.; Bekmukhambetova, A. Achieving Usability: Looking for Connections between User-Centred Design Practices and Resultant Usability Metrics in Agile Software Development. Period. Polytech. Soc. Manag. Sci. 2023, 31, 135–143. [Google Scholar] [CrossRef]
- Kraus, M.; Angerbauer, K.; Buchmüller, J.; Schweitzer, D.; Keim, D.A.; Sedlmair, M.; Fuchs, J. Assessing 2D and 3D Heatmaps for Comparative Analysis: An Empirical Study. In Proceedings of the 2020 CHI Conference on Human Factors in Computing Systems, CHI ’20, Honolulu, HI, USA, 25–30 April 2020; Association for Computing Machinery: New York, NY, USA, 2020; pp. 1–14. [Google Scholar] [CrossRef]
- Słomska-Przech, K.; Panecki, T.; Pokojski, W. Heat Maps: Perfect Maps for Quick Reading? Comparing Usability of Heat Maps with Different Levels of Generalization. ISPRS Int. J. Geo-Inf. 2021, 10, 562. [Google Scholar] [CrossRef]
- Somrak, A.; Pogačnik, M.; Guna, J. Suitability and Comparison of Questionnaires Assessing Virtual Reality-Induced Symptoms and Effects and User Experience in Virtual Environments. Sensors 2021, 21, 1185. [Google Scholar] [CrossRef]
- Juric, M.; Pehar, F.; Pavlović, N.P. Translation, Psychometric Evaluation, and Validation of the Croatian Version of the User Experience Questionnaire (UEQ). Int. J. Hum.–Comput. Interact. 2022, 38, 1–14. [Google Scholar] [CrossRef]
- Nurlifa, A.; Dewi, A.M.; Haryoko, A. Perancangan ui/ux aplikasi fishline menggunakan metode design thinking. JATI (J. Mhs. Tek. Inform.) 2023, 7, 3521–3529. [Google Scholar] [CrossRef]
- Rodríguez-Rodríguez, J.; Reguant-Álvarez, M. Calcular la fiabilidad de un cuestionario o escala mediante el SPSS: El coeficiente alfa de Cronbach. REIRE Rev. D’innovació I Recer. En Educ. 2020, 13, 1–13. [Google Scholar] [CrossRef]
- Haba, D. Data Augmentation with Python Enhance Deep Learning Accuracy with Data Augmentation Methods for Image, Text, Audio, and Tabular Data, 1st ed.; Packt Publishing Limited: Birmingham, UK, 2023. [Google Scholar]
- Raschka, S.; Patterson, J.; Nolet, C. Machine Learning in Python: Main Developments and Technology Trends in Data Science, Machine Learning, and Artificial Intelligence. Information 2020, 11, 193. [Google Scholar] [CrossRef]
- Yan, S.-R.; Pirooznia, S.; Heidari, A.; Navimipour, N.J.; Unal, M. Implementation of a Product-Recommender System in an IoT-Based Smart Shopping Using Fuzzy Logic and Apriori Algorithm. IEEE Trans. Eng. Manag. 2022, 71, 4940–4954. [Google Scholar] [CrossRef]
- Martín, J.C.; Indelicato, A. Comparing a Fuzzy Hybrid Approach with Invariant MGCFA to Study National Identity. Appl. Sci. 2023, 13, 1657. [Google Scholar] [CrossRef]
- Soetedjo, A.; Nakhoda, Y.I.; Saleh, C. Embedded Fuzzy Logic Controller and Wireless Communication for Home Energy Management Systems. Electronics 2018, 7, 189. [Google Scholar] [CrossRef]
- Gardas, B.B.; Heidari, A.; Navimipour, N.J.; Unal, M. A Fuzzy-Based Method for Objects Selection in Blockchain-Enabled Edge-IoT Platforms Using a Hybrid Multi-Criteria Decision-Making Model. Appl. Sci. 2022, 12, 8906. [Google Scholar] [CrossRef]


| Attributes | Concept | Metrics |
|---|---|---|
| Effectiveness | Related to the accuracy and completeness with which users achieve specific objectives through the application. Key indicators include the quality of the solution and the rate of errors committed. | Tasks solved in a limited time Percentage of tasks completed on the first attempt Number of functions learned |
| Efficiency | Represents the relationship between effectiveness and the effort or resources invested to achieve the objectives. Relevant indicators are task completion time and learning time. Greater efficiency is achieved with less effort or resources. | Time taken to complete a task Number of taps per task Time spent on each screen Relative efficiency compared to an expert user Productive time |
| Satisfaction | Reflects the degree to which the user experiences satisfaction and positive attitudes when using the application to meet specific objectives. Being a subjective attribute, it is evaluated using attitude rating scales. | Difficulty level Likes or dislikes Preference |
| Ease of Learning | The user’s ability to achieve goals in their first interaction with the application. | Time used to complete a task the first time Learning curve |
| Errors | The occurrence and severity of errors made by users. It is essential to minimize errors and provide effective recovery mechanisms. | Number of errors |
| Content | It involves the layout and format of the information presented to the user. | Number of words per screen Number of screens |
| Portability | The ability of the application to be moved between different platforms or environments. | Configuration level |
| Context | Refers to the factors and variables of the environment in which the application is used. | Degree of connectivity Location Device characteristics |
| Security | Evaluates the application’s ability to handle risks and protect stored data. | User control Several security rules |
| Pragmatic Quality | obstructive | O O O O O O O | supportive | 1 |
| complicated | O O O O O O O | easy | 2 | |
| inefficient | O O O O O O O | efficient | 3 | |
| confusing | O O O O O O O | clear | 4 | |
| Hedonic Quality | boring | O O O O O O O | exciting | 5 |
| not interesting | O O O O O O O | interesting | 6 | |
| conventional | O O O O O O O | inventive | 7 | |
| usual | O O O O O O O | Leading edge | 8 |
| (+) Positive | (−) Negative | |||
|---|---|---|---|---|
| 5 | 4 | 3 | 2 | 1 |
| Strongly Agree | Somewhat Agree | Neither Agree nor Disagree | Somewhat Disagree | Strongly Disagree |
| System Usability Scale (SUS) | ||||
| Q1: I think I would like to use this application frequently. | ||||
| Q2: I find this application unnecessarily complex. | ||||
| Q3: I think the application is easy to use. | ||||
| Q4: I think I would need support to use the application. | ||||
| Q5: I find the various functions of the application well integrated. | ||||
| Q6: I have found too much inconsistency in this application. | ||||
| Q7: I think most people would learn to use the application quickly. | ||||
| Q8: I have found the app quite cumbersome to use. | ||||
| Q9: I feel very confident using the app. | ||||
| Q10: I would need to learn many things before operating the app. | ||||
| Triangular Function | Trapezoidal Function |
|---|---|
 |  |
| Gender | Age | Type of House | |||
|---|---|---|---|---|---|
 |  |  | |||
| Number of persons living in the household | |||||
 | |||||
| Mobile Device | Operating System | ||||
 |  | ||||
| Experience with mobile applications | Do you consider it appropriate to have a mobile application that allows you to manage your household electricity consumption effectively? | ||||
 |  | ||||
| Characteristic | Description | Complexity |
|---|---|---|
| Dashboard | The main screen provides a real-time overview of energy consumption, device status, and essential alerts or messages. | 1, high |
| History and Analysis | Allows users to review their past and present energy consumption through detailed statistics and graphs. | 1, high |
| Control and Automation | Facilitates remote control of connected devices and energy systems at home. Allows certain behaviors or responses to be automated based on preferences or environmental conditions. | 2, medium |
| Settings and Preferences | Section where users can customize their profiles, alert settings, energy-saving preferences, and other general aspects. | 3, low |
| Tips and Recommendations | Provides energy-saving tips based on analysis of user behavior and energy system performance. | 3, low |
| Functions | It encompasses several additional functionalities that the interface could offer, such as consumption calculators and maintenance notifications. | 3, low |
| Help and Support | Offers user assistance through FAQs, guides, and possibly live support or a ticketing system for inquiries and troubleshooting. | 3, low |
| Metrics |
|---|
|
| Statistics | Time (s) | Errors |
|---|---|---|
| Mean | 797.51 s | 2.19 |
| Median | 759.28 s | 2.00 |
| Mode | 0:10.62 s | 0 |
| Standard deviation | 531.25 s | 1.77 |
| Task times | Minimum: 10.62 s Maximum: 29 min, 54.5 s | 0 |
| Erroneous click rate | 0 | 65% |
| Short UEQ Scales | |
|---|---|
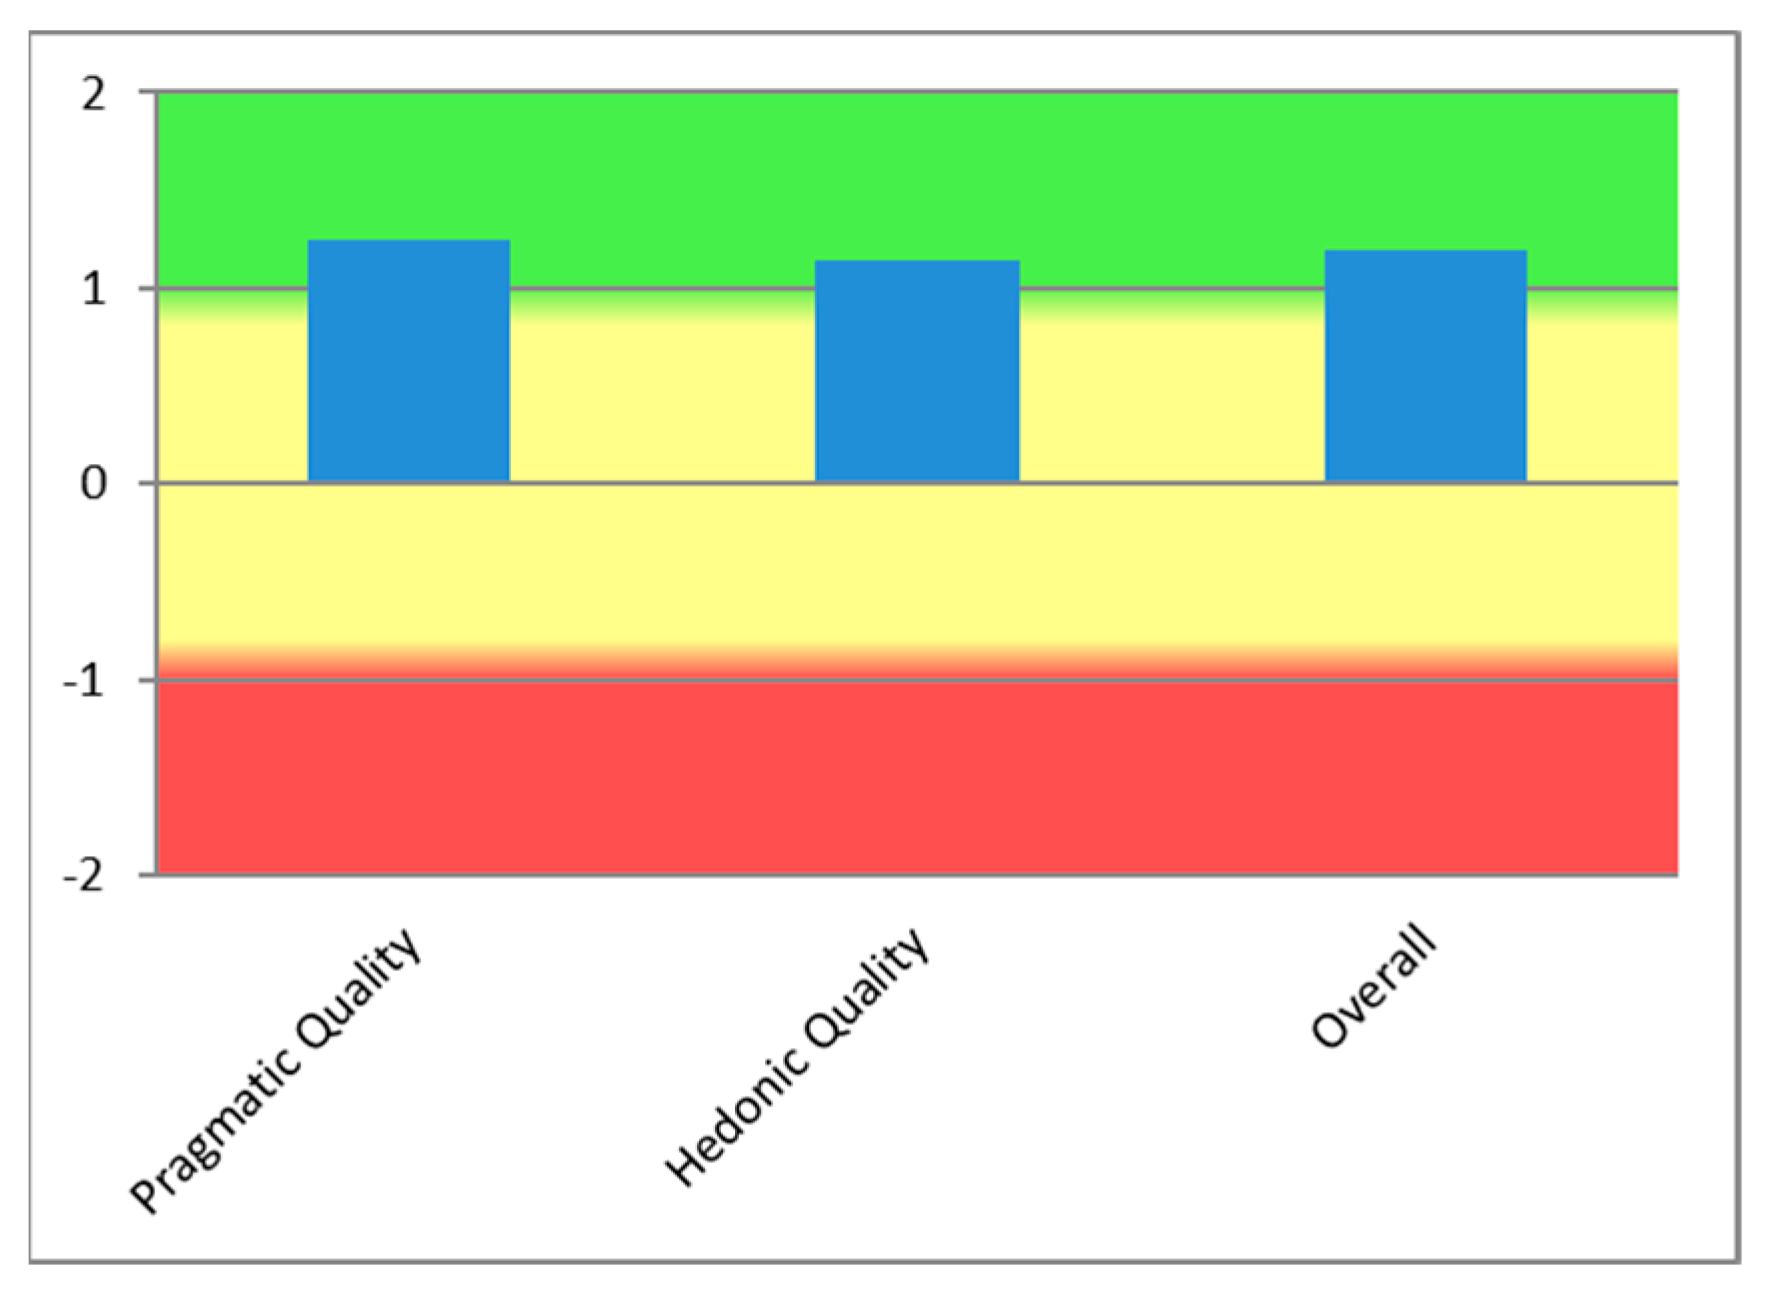
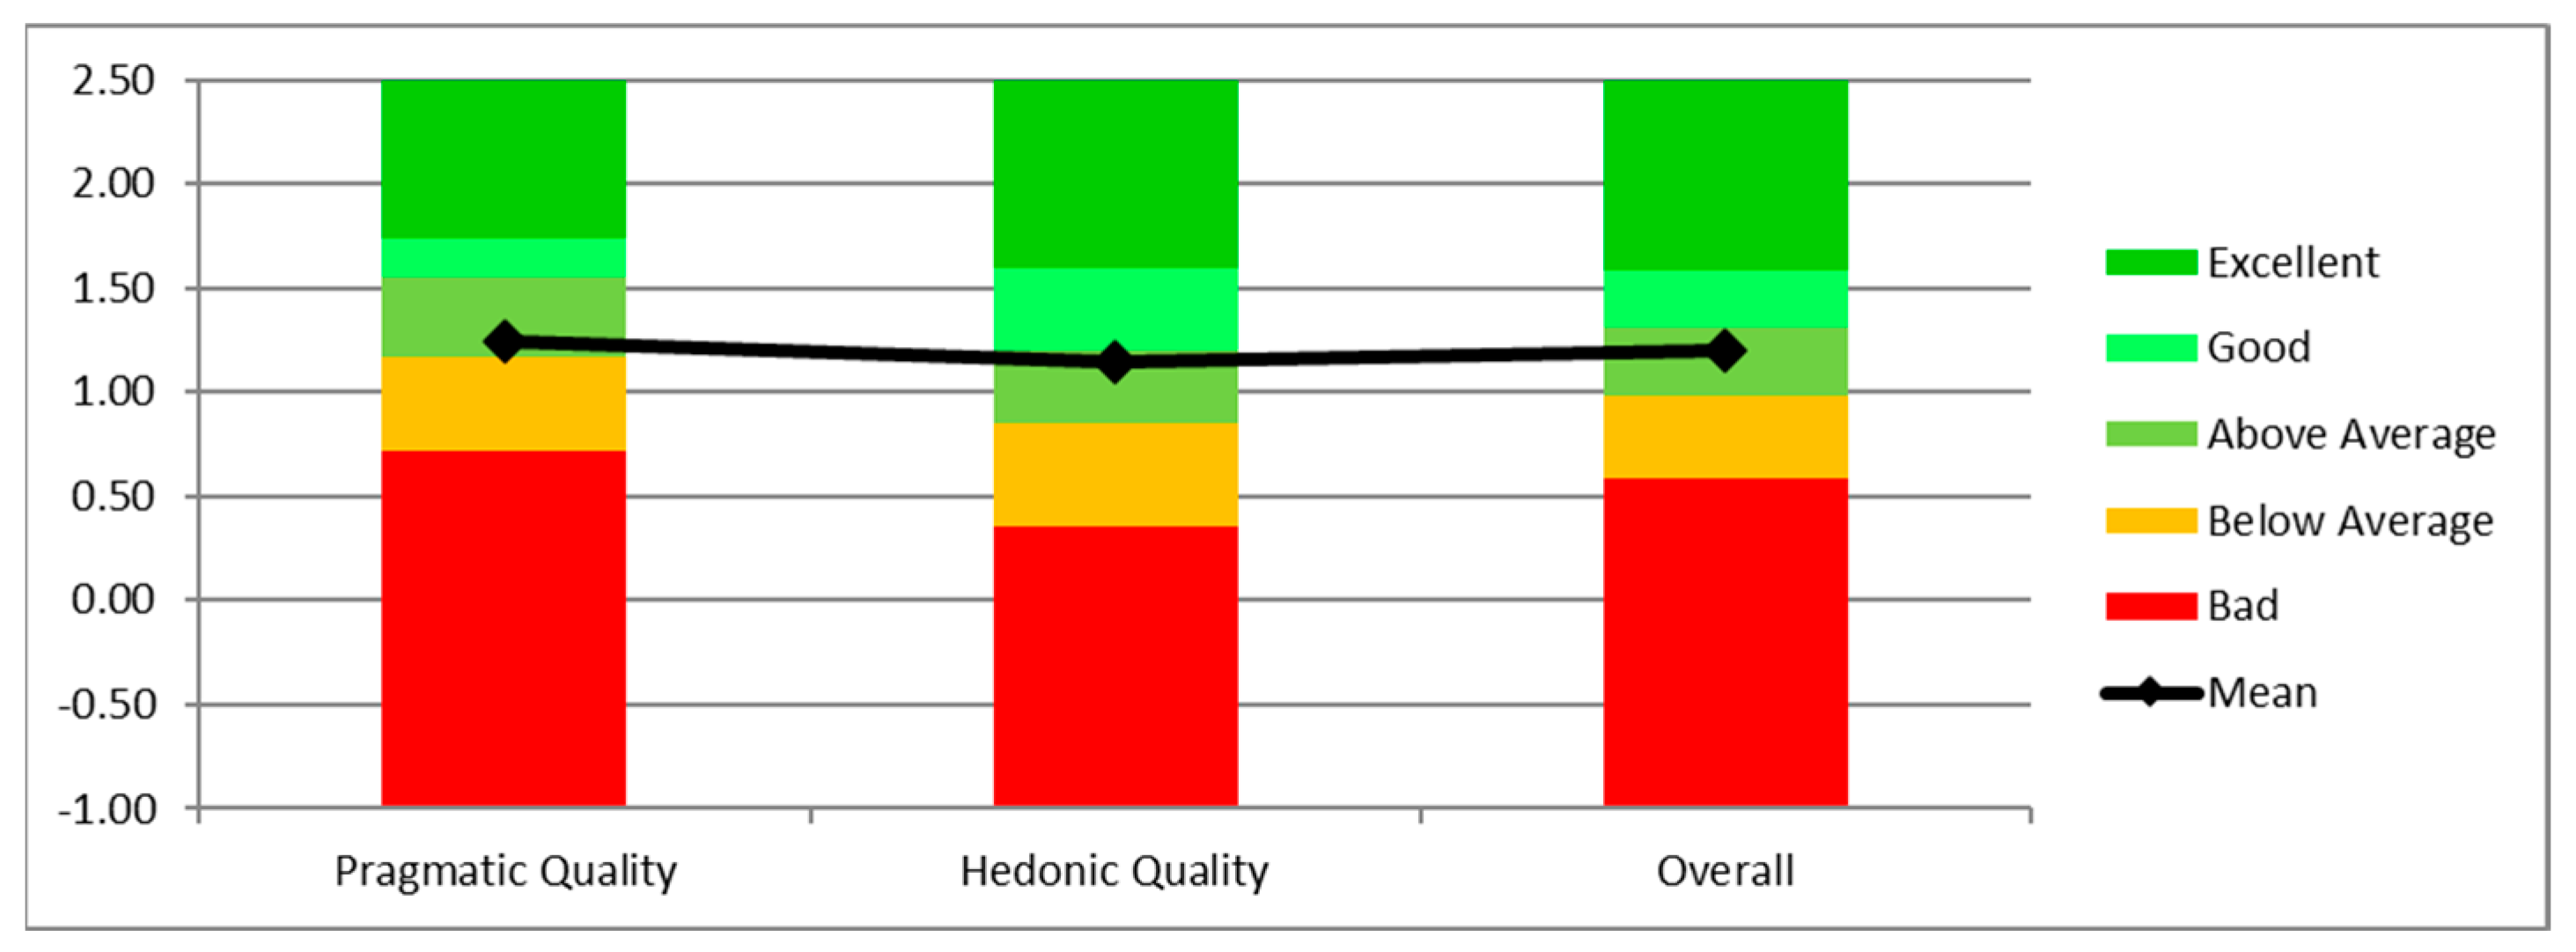
| Pragmatic Quality |  1.244 1.244 |
| Hedonic Quality |  1.144 1.144 |
| Overall |  1.194 1.194 |
| Pragmatic Quality | Hedonic Quality | ||
|---|---|---|---|
| Items | Correlation | Items | Correlation |
| 1.2 | 0.35 | 5.6 | 0.69 |
| 1.3 | 0.68 | 5.7 | 0.23 |
| 1.4 | 0.52 | 5.8 | 0.53 |
| 2.3 | 0.53 | 6.7 | 0.47 |
| 2.4 | 0.79 | 6.8 | 0.59 |
| 3.4 | 0.53 | 7.8 | 0.54 |
| Average | 0.57 | Average | 0.51 |
| Alpha | 0.84 | Alpha | 0.81 |
| Variables | Label | Description of the Membership Function |
|---|---|---|
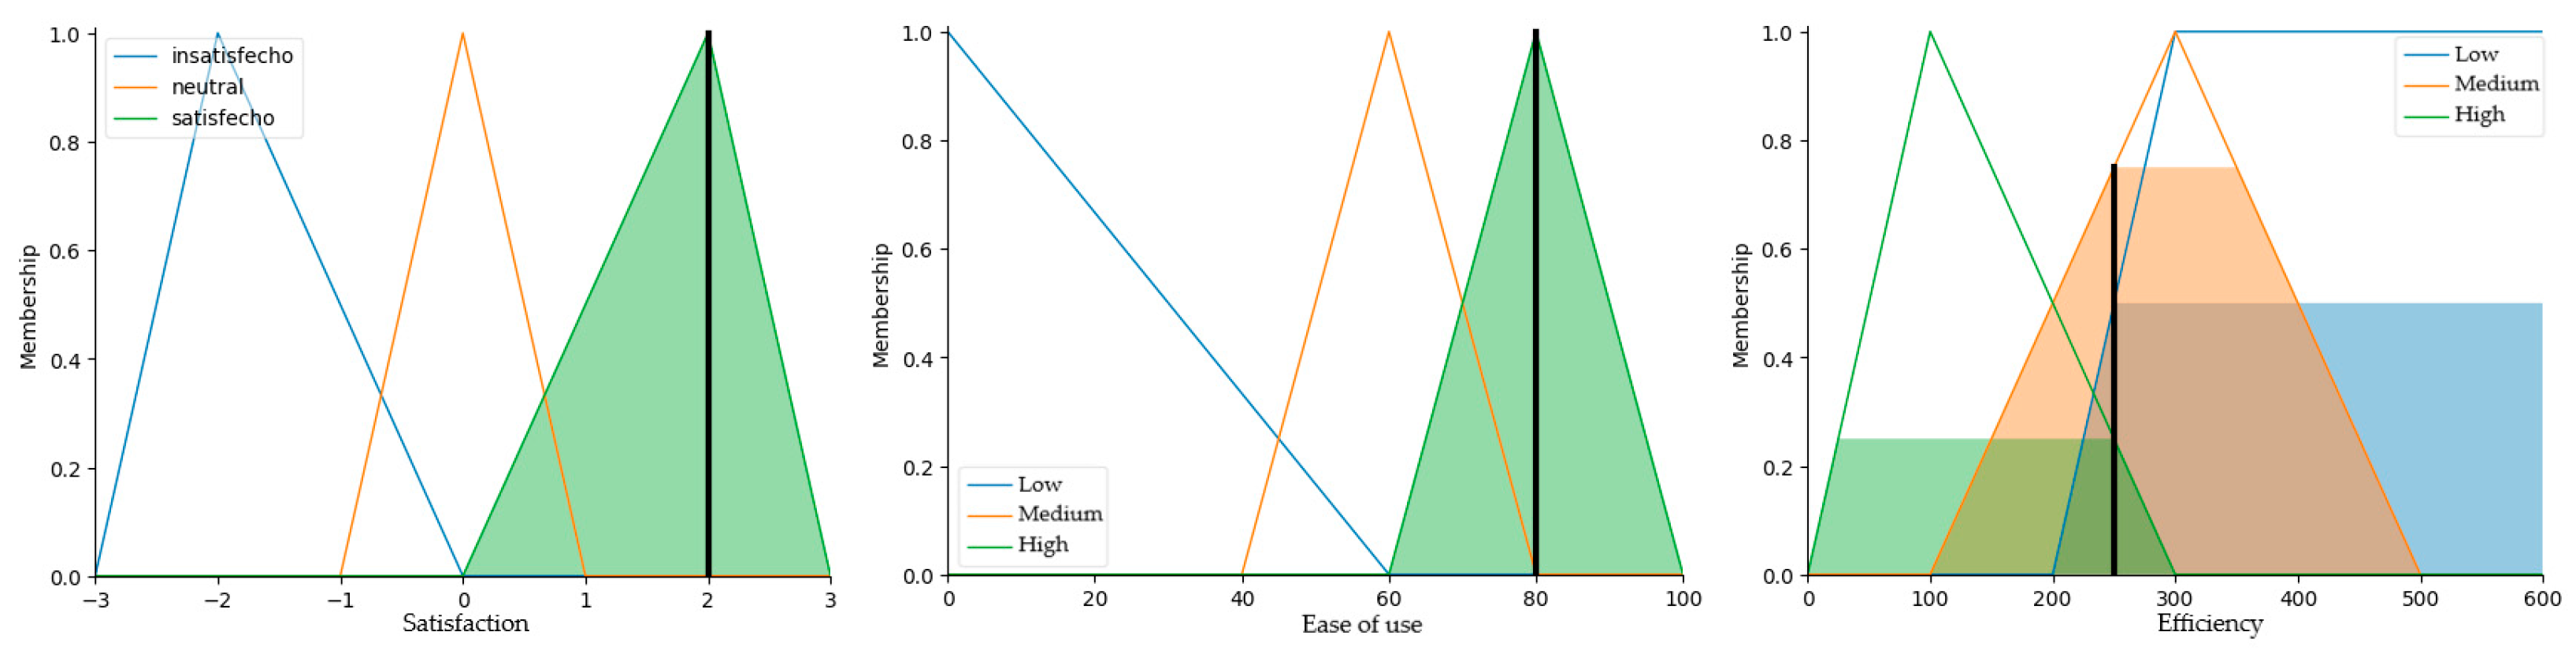
| Ease of Use | Low | It would cover SUS scores from 0 to around 60, with full membership at 0 and decreasing linearly until reaching 60, where membership would be 0. |
| Medium | It would be centered around the average score of 50, starting to increase from 40, peaking at 60, and then decreasing to 80. | |
| High | It increases its degree of membership from around 60 and would reach full membership at 80 and remain so until 100. | |
| Satisfaction | Dissatisfied | Full membership would be at −3 (very dissatisfied) and decrease to 0. |
| Neutral | This function would gradually increase from −1 until reaching full membership at 0 and decreasing again towards 1. | |
| Satisfied | It would start to increase at 0 and reach full membership at 2 and would be maintained until 3. | |
| Efficiency | Low | A long time to complete a task (say more than 200 s) would have a high membership at low efficiency. |
| Medium | A moderate task time (between 100 and 500 s) would be associated with medium efficiency. | |
| High | A short task time (less than 300 s) would indicate high efficiency. | |
| Probability of Recommendation | Low | If ease of use and/or satisfaction are low, the likelihood of recommendation would be low. |
| Medium | If both ease of use and satisfaction are moderate, the likelihood of recommendation would be medium. | |
| High | If both ease of use and satisfaction are high, the likelihood of recommendation would be high. | |
| Overall Quality of User Experience | Low | Low ease of use, satisfaction, and efficiency scores would lead to low overall quality. |
| Medium | Medium scores in these areas would result in a medium overall quality of experience. | |
| High | High scores in ease of use, satisfaction, and efficiency would indicate a high overall quality of user experience. |
| Entry Value | Ease of Use (Low) | Ease of Use (Medium) | Ease of Use (High) | Satisfaction (Dissatisfied) | Satisfaction (Neutral) | Satisfaction (Satisfied) | Efficiency (Low) | Efficiency (Medium) | Efficiency (High) |
|---|---|---|---|---|---|---|---|---|---|
| 80 | 0 | 0.5 | 0.5 | 0 | 0 | 1 | 0 | 0.75 | 0.25 |
| 2 | 0 | 0.5 | 0 | 0 | 0.5 | 0 | 0 | 0.5 | 0 |
| 250 | 0 | 0.5 | 0 | 0 | 0 | 0 | 0 | 0.75 | 0.25 |
| Fuzzy Set | Degree of Membership (Probability of Recommendation) | Degree of Membership (Quality of UX) |
|---|---|---|
| Low | 0.2 | 0.6 |
| Medium | 0.8 | 0.3 |
| High | 0.5 | 0.9 |
| Aspect | Quantitative Data | Qualitative Data |
|---|---|---|
| Usability | The average score of the Usability Evaluation System (SUS) was 80, indicating a very satisfactory user experience. | Users expressed high satisfaction with the ease of use of the interface, highlighting the simplicity and clarity of the functions. |
| User Experience | The average User Experience Quality Scale (UEQ-S) score was 1.194, indicating a positive experience in both pragmatic and hedonic aspects. | Users reported an emotionally satisfying experience, highlighting the visual appeal and novelty of the interface. In addition, they found the interface efficient and easy to use in their daily tasks. |
| Reliability | The internal consistency of the pragmatic and hedonic quality scales, assessed by Cronbach’s Alpha coefficient, was high (0.84 for pragmatic quality and 0.81 for hedonic quality), indicating reliability of the results. | Users demonstrated consistency in their responses in both pragmatic and hedonic aspects, which supports the consistency of the findings obtained through different evaluation methods. |
Disclaimer/Publisher’s Note: The statements, opinions and data contained in all publications are solely those of the individual author(s) and contributor(s) and not of MDPI and/or the editor(s). MDPI and/or the editor(s) disclaim responsibility for any injury to people or property resulting from any ideas, methods, instructions or products referred to in the content. |
© 2024 by the authors. Licensee MDPI, Basel, Switzerland. This article is an open access article distributed under the terms and conditions of the Creative Commons Attribution (CC BY) license (https://creativecommons.org/licenses/by/4.0/).
Share and Cite
Nuñez, I.; Cano, E.E.; Cruz, E.; Concepción, D.; Navarro, N.; Rovetto, C. Improving Usability in Mobile Apps for Residential Energy Management: A Hybrid Approach Using Fuzzy Logic. Appl. Sci. 2024, 14, 1751. https://doi.org/10.3390/app14051751
Nuñez I, Cano EE, Cruz E, Concepción D, Navarro N, Rovetto C. Improving Usability in Mobile Apps for Residential Energy Management: A Hybrid Approach Using Fuzzy Logic. Applied Sciences. 2024; 14(5):1751. https://doi.org/10.3390/app14051751
Chicago/Turabian StyleNuñez, Ivonne, Elia Esther Cano, Edmanuel Cruz, Dimas Concepción, Nila Navarro, and Carlos Rovetto. 2024. "Improving Usability in Mobile Apps for Residential Energy Management: A Hybrid Approach Using Fuzzy Logic" Applied Sciences 14, no. 5: 1751. https://doi.org/10.3390/app14051751