
Deformation Behavior and Dynamic Recrystallization of Mg-1Li-1Al Alloy
by

Xiaoyan Feng
1, 
Xue Pang
1,
Xu He
1,
Ruihong Li
1,*,
Zili Jin
1,
Huiping Ren
1 and
Tingting Liu
2,* 1
School of Materials and Metallurgy, Inner Mongolia University of Science and Technology, Baotou 014010, China
2
School of Materials and Energy, Southwest University, Chongqing 400715, China
*
Authors to whom correspondence should be addressed.
Metals 2021, 11(11), 1696; https://doi.org/10.3390/met11111696
Submission received: 18 September 2021
/
Revised: 12 October 2021
/
Accepted: 21 October 2021
/
Published: 25 October 2021
(This article belongs to the Special Issue Microstructure Evolution and Mechanical Properties of Magnesium Alloys)
Abstract
:In this paper, the hot workability of Mg-1Li-1Al (LA11) alloy is assessed through a uniaxial compression test in a temperature range from 200 to 400 °C and a strain rate, έ, of 1–0.01 s−1. The present study reveals that flow stress increases when the strain rate increases and deformation temperature decreases. Based on the hyperbolic sine equation, the flow stress constitutive equation of this alloy under high-temperature deformation is established. The average activation energy was 116.5 kJ/mol. Avrami equation was employed to investigate the dynamic recrystallization (DRX). The DRX mechanism affected by the deformation conditions and Zener–Hollomon parameters is revealed. Finally, the relationship between DRX volume fraction and deformation parameter is verified based on microstructure evolution, which is consistent with the theoretical prediction.
1. Introduction
Magnesium (Mg) alloys are ideal for transportation and aerospace industries due to their low density, high specific strength, high specific stiffness and good damping capacity [1,2]. However, magnesium alloys have poor deformability at room temperature because of the lack of sufficient independent slip systems during plastic deformation, which is attributed to the hexagonal close-packed (HCP) structure [3,4]. Alloying is an effective approach to enhancing the ductility of Mg alloys. Generally, the axial ratio c/a of Mg alloys is 1.6236, which makes the critical resolved shear stress (CRSS) of the basal plane much lower than that of prismatic and pyramidal planes [5,6]. The Li element is found to be effective in decreasing the axial ratio <c/a> of the Mg lattice, which would activate more slip systems, and hence, improve the ductility of the magnesium alloy as well [7,8]. According to the binary phase diagram of the Mg-Li alloy, there are three types of structures with different lithium contents, which are α-Mg phase (less than 5.7 wt% Li), β-Li phase (more than 10.3 wt% Li), and duplex (α-Mg+β-Li phase) structures between 5.7 wt% and 10.3 wt% Li. When the content of lithium is less than 5.7%, the HCP structural Mg-Li alloy has lower c/a, thus improving the deformation ability at room temperature [9,10,11]. Unfortunately, the applications of Mg-Li alloys are limited due to their low strength and poor corrosion resistance. To achieve a moderate strength for Mg-Li alloys, both alloying and plastic deformation are commonly used as effective approaches [12,13]. For example, alloying with Al, Zn and rare earth (RE) elements could effectively ameliorate the mechanical properties of Mg-Li alloys due to the precipitation strengthening [10,13].
Generally speaking, due to the low basal stacking fault energy during high-temperature deformation of Mg-Li alloys, the dynamic recrystallization (DRX) process easily occurs, which has an obvious influence on the microstructure and mechanical properties [3,14,15]. Therefore, controlling DRX by optimizing the plastic deformation process can efficiently improve the comprehensive properties of Mg-Li alloys [3,16]. At present, the hot deformation behavior of α+β phase Mg-Li alloys has been more studied than α-phase Mg-Li alloys. Based on the method of constitutive analysis, the hot workability of materials can be represented by the hyperbolic sine function as well. The activation energy (Q) is generally regarded as a significant physical parameter in the hot working process, which is the potential energy barrier for dynamic softening (dynamic recovery and dynamic recrystallization) to occur. Li et al. [17] studied the thermal deformation behavior of as-cast Mg-5Li-3Al-2Zn (LAZ532) alloys and obtained the value of Q as 159.8 kJ/mol. According to the authors, discontinuous dynamic recrystallization (DDRX) was the main DRX mechanism. Moreover, Duan et al. [8] researched the Q-value and the DRX kinetics of an AZ80A magnesium alloy through hot deformation implemented at temperatures ranging from 350 °C to 450 °C and strain rates from 0.001 to 1 s−1. The Q-value of this alloy was 173.8 kJ/mol. Xu et al. [3] investigated the hot compression deformation behavior of an AZ61 magnesium alloy. They also applied the hyperbolic sine equation to find the constitutive model, and the average apparent Q-value was determined to be 173.66 kJ/mol. Li et al. [18] studied the thermal deformability of an Mg-6Li alloy by a calculated model and found that the model can predict the DRX process. It is found that DRX can modify the final microstructure and texture of Mg alloys during hot deformation and thus enhance the mechanical properties of Mg alloy.
However, the hot deformation behavior of HCP structural Mg-Li-Al alloys with a coarse grain structure has not been studied. Consequently, it is very important to discuss the DRX kinetics of an Mg-1Li-1Al (LA11) alloy during hot processing. In this study, the thermal deformation behavior and DRX behavior of an LA11 alloy under different deformation conditions were investigated by isothermal compression tests. The constitutive equation of high-temperature flow behavior and a DRX kinetics model of an LA11 alloy during hot deformation were established, and the rheological softening behavior at high temperatures was predicted. By observing the microstructure, the performance of DRX was further analyzed.
2. Materials and Experimental
The experimental material in this research was Mg-1Li-1Al (LA11) alloy, which was obtained by Vacuum electromagnetic induction casting. A cast cylinder with a diameter of 100 mm and a height of 150 mm was received, whose chemical composition is Li: 1.219, Al: 1.036 and balance Mg (all in wt.%). Then, the as-cast LA11 alloy was homogenized at 350 °C for 5 h and then cooled in water. Cylindrical specimens for compression tests were machined from the as-solution ingot with a diameter of 8 mm and a height of 12 mm. The hot compression tests were carried out on a Gleeble-3800 thermal simulation machine (Date Science International, INC, St. Paul, MN, USA). The deformation experimental temperatures were 200 °C, 300 °C and 400 °C, and the strain rates were 0.01, 0.1 and 1 s−1, respectively. Each specimen was held for at least 180 s at the testing temperature to allow for equilibration before beginning the compression test, and the true strain was approaching 0.6. In order to ensure the accuracy of the experiment, three groups of parallel experiments were made under the same conditions. Note that graphite sheets were used to minimize the friction between specimens.
For microstructure examination, samples were sectioned along the compression direction (CD)–transverse direction (TD) plane from the middle region of the cylinder-deformed compression specimen. Optical microscopy (OM) was applied by normal preparing, grinding and polishing, followed by etching using a solution containing 5 g picric acid, 10 mL acetic acid and 95 mL ethyl alcohol. In addition, the phase structure of the as-cast alloy was detected by X-ray diffraction (XRD) using Cu-Kα radiation at a scan rate of 5°/min between 20° and 90°, with a step size of 0.02°. Electron backscatter diffraction (EBSD) characterization was performed in Gemini Sigma 300 SEM (Carl Zeiss Jena GmbH, Jena, Germany) to further analyze the DRX of the hot deformed LA11 alloy, which was operated at an accelerating voltage of 20 KV. The EBSD sampl Please check that the intended meaning has been retained. es were electropolished with iso-propyl alcohol (100 mL) + ethyl alcohol (800 mL) + distilled water (18.5 mL) + 8-Hydroxyquinoline (10 g) + citric acid (75 g) + sodium sulfocyanate (41.5 g) + perchloric acid (15 mL) under −30 °C for 1 min. The data of the EBSD were analyzed by the channel 5 software (Oxford Instruments, UK).
3. Results and Discussion
3.1. Microstructure of Homogenized LA11 Alloy
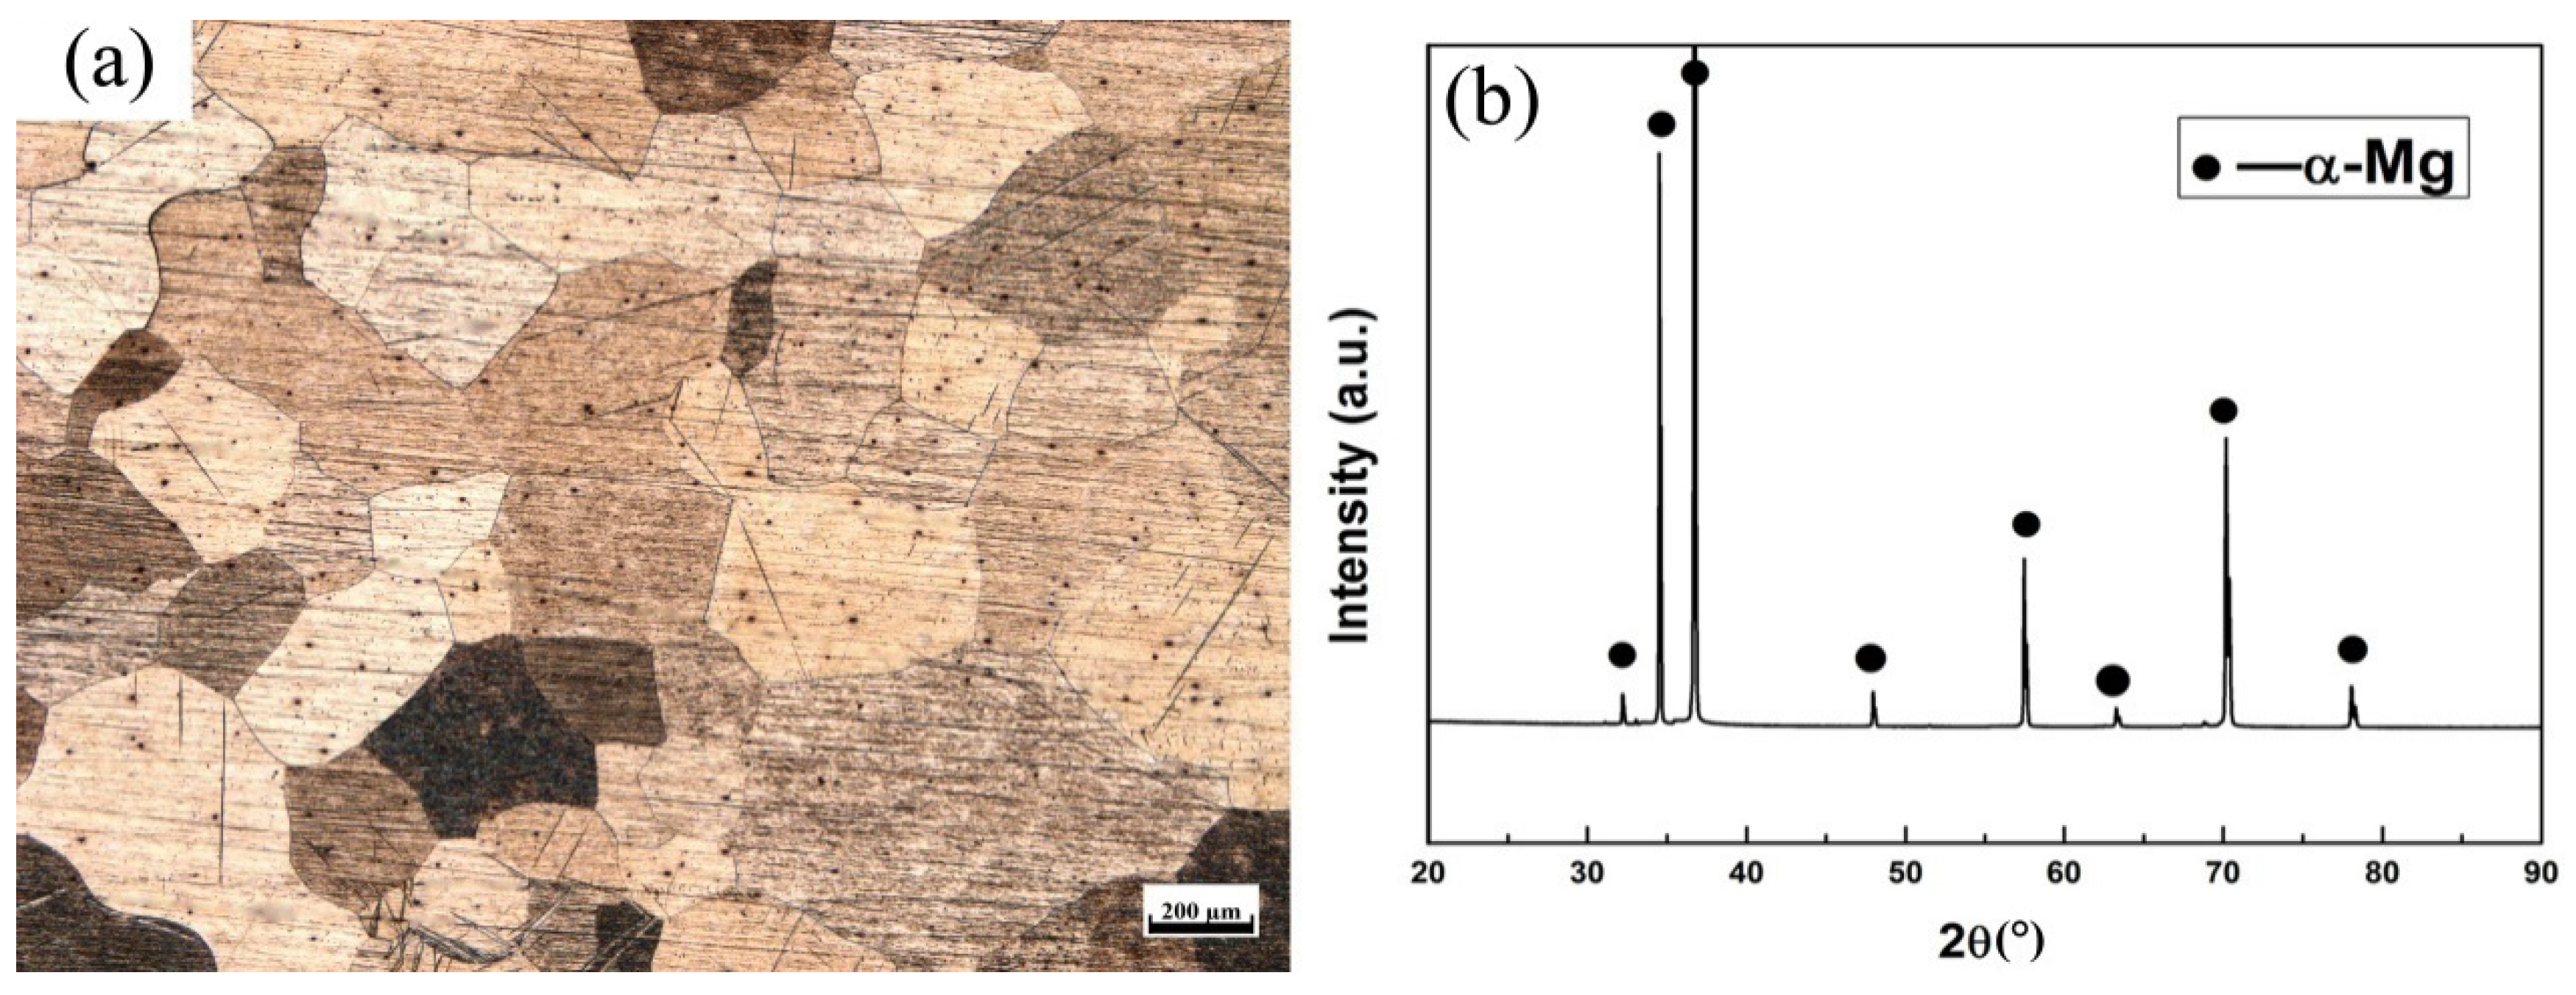
The initial microstructure of the homogenized LA11 alloy is shown in Figure 1a. The LA11 alloy has a coarse structure with an average grain size of 352 ± 3 μm. The LA11 alloy composed of only the α-Mg phase, as confirmed by the XRD pattern in Figure 1b. As a result, the effect of the second particles on the hot working properties of the LA11 alloy can be overlooked.
3.2. Flow Stress-Strain Behavior
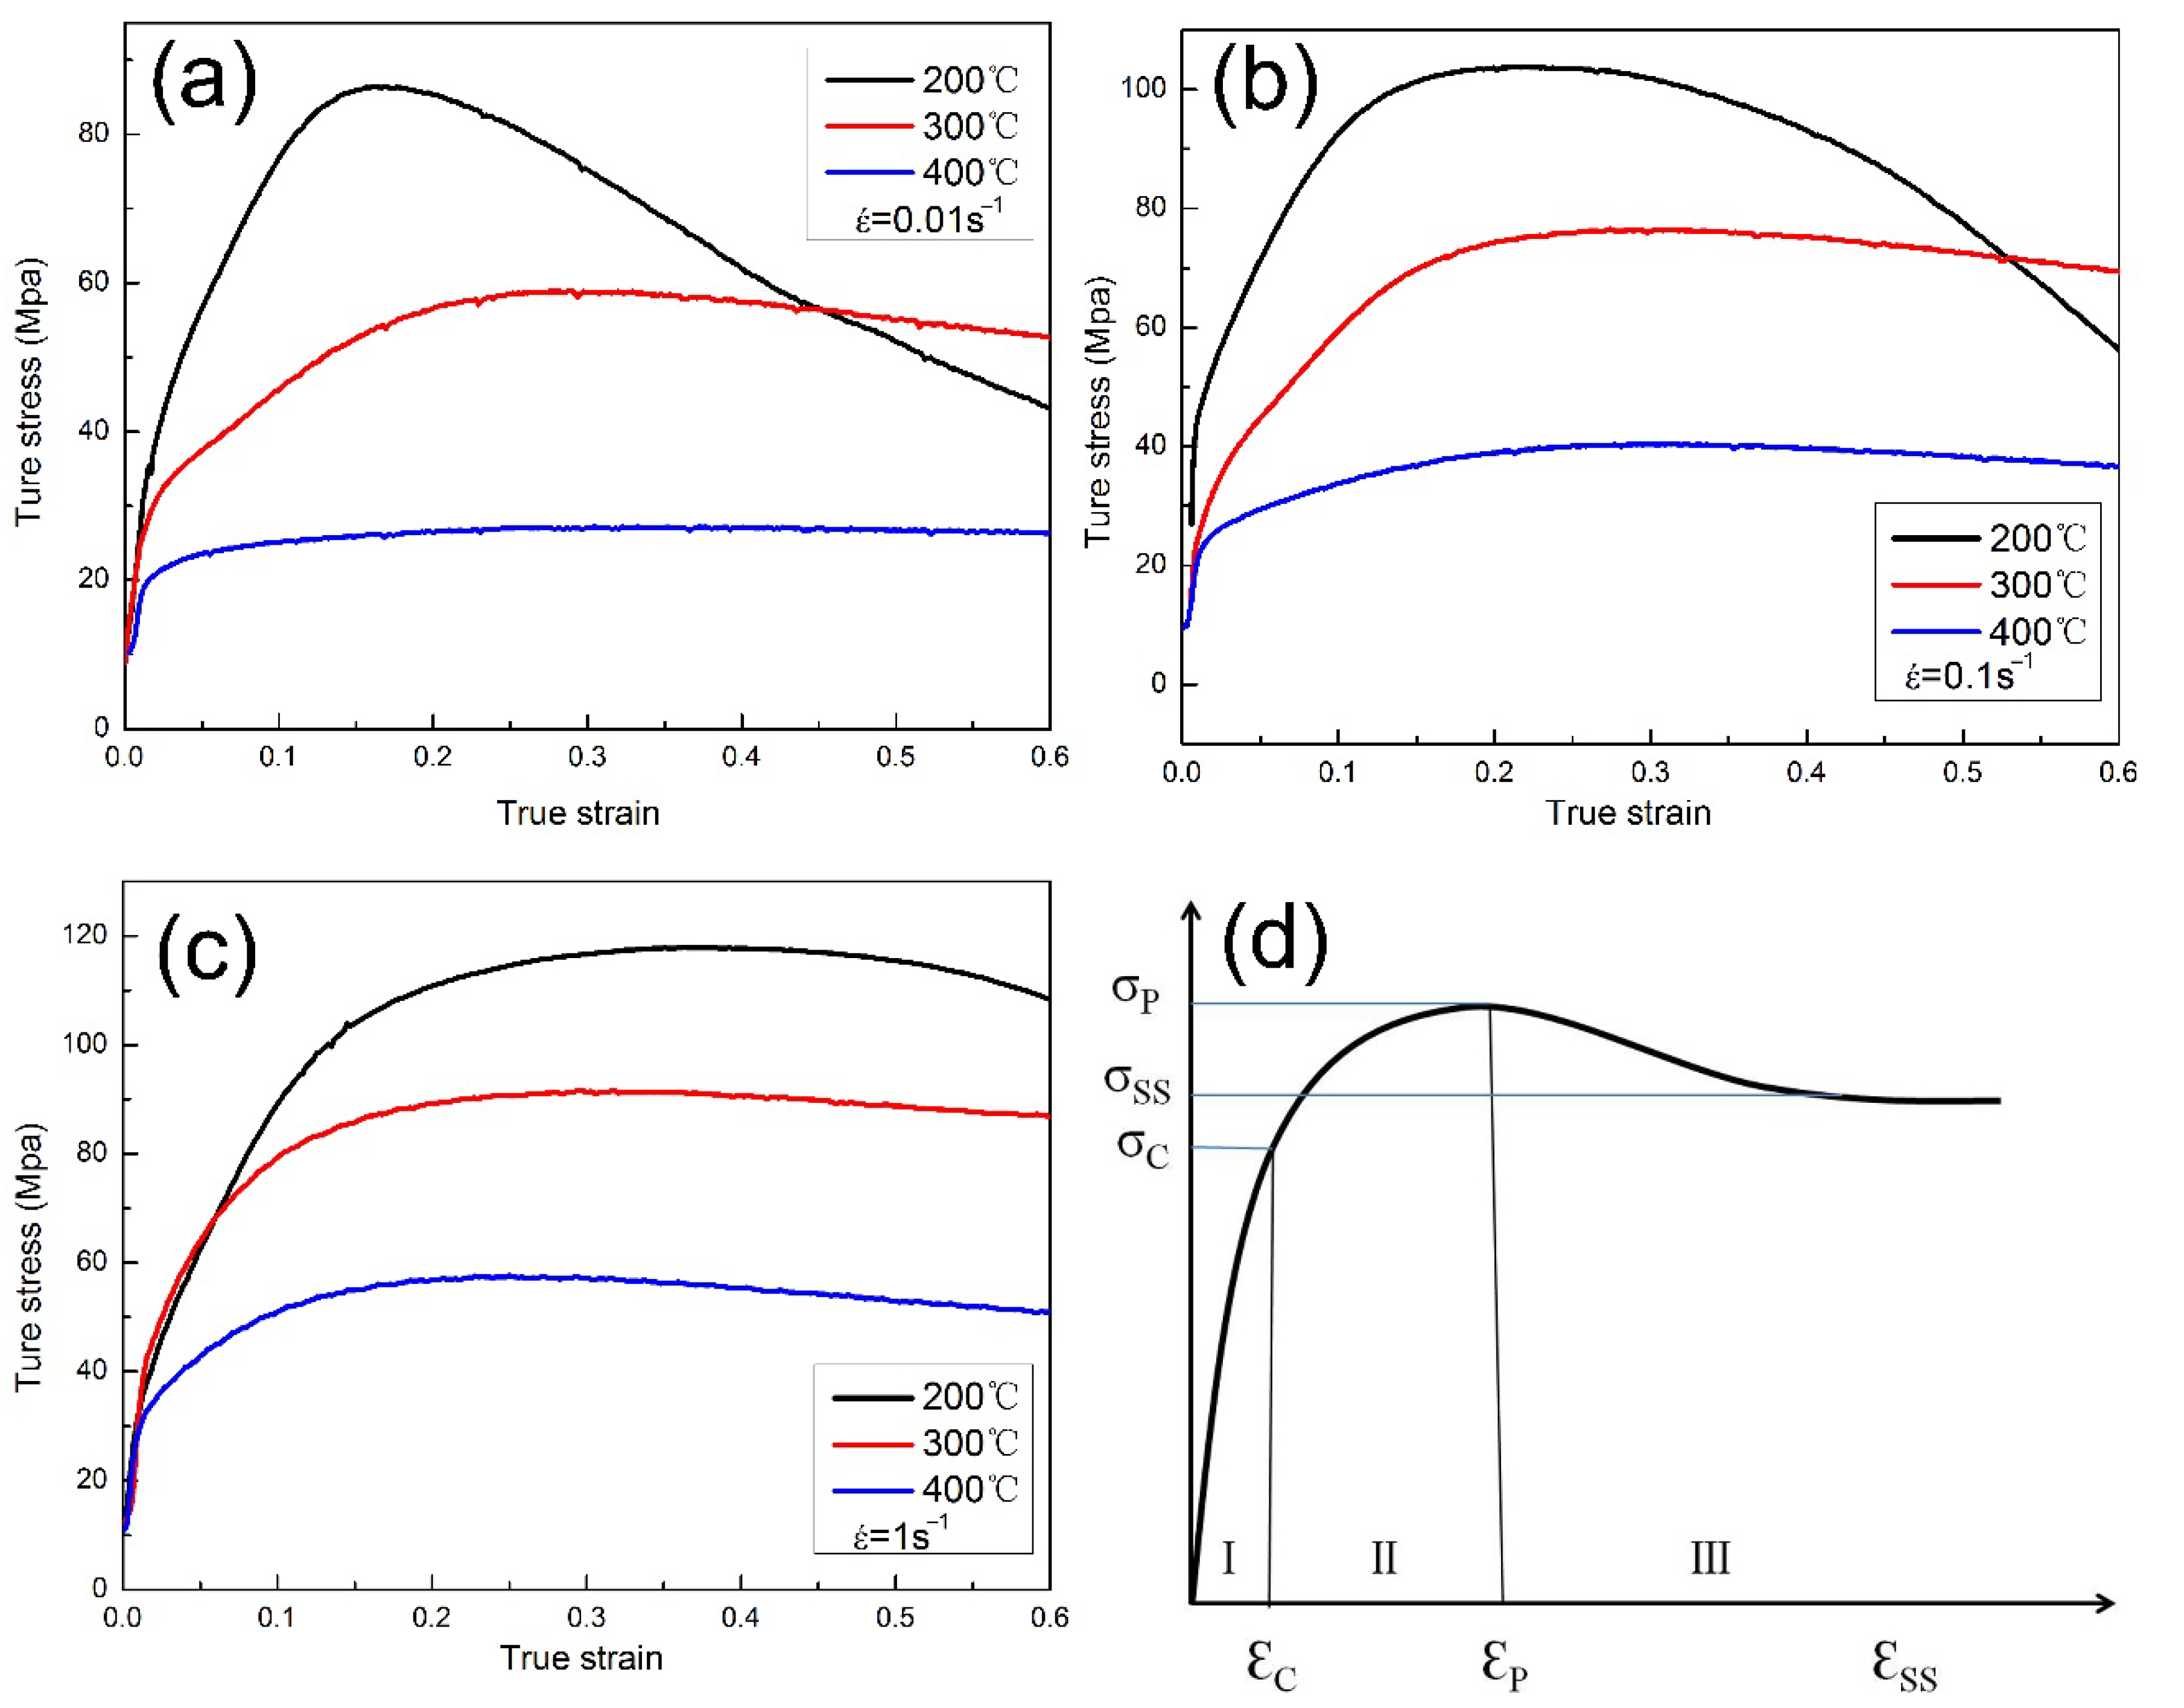
The typical compression true stress–strain curves of the homogenized LA11 alloy under different deformations, i.e., strain rates and temperatures, are shown in Figure 2. A schematic sketch of the flow stress curves with DRX is also displayed in Figure 2d. In general, the true stress–strain curves can be divided into three stages (Figure 2d). First, the flow stress increases sharply with the increase in strain at the beginning of deformation, and work hardening plays a dominant role in this stage. Dynamic recovery also occurred in this stage. When the stress reaches a critical value (σc), it is the beginning of DRX. At the second stage, the DRX softening and work hardening gradually reach a dynamic balance, and the flow stress reaches the peak stress (σp). Subsequently, the DRX softening gradually becomes predominant until there is a dynamic balance again between work hardening and DRX softening, and then a steady-state flow is exhibited [19,20,21].
3.3. Constitutive Model
In order to further understand the relationship between flow stress and deformation parameters (i.e., temperature and strain rate), the Arrhenius-type equation of flow behavior modified by Sellars and Tegart is usually established to describe this relationship, as below [8]:
At the same time, it can be expressed by two other equations as follows:
where, A, A1, A2, n, n1, α and β are material constants, and έ, σ, T, Q and R refera to strain rate (s−1), flow stress (MPa), absolute temperature (K), apparent activation energy (KJ/mol) and universal gas constant (8.314 J/mol·K), respectively.
Further, the α parameter can be estimated from the following equation:
α = β/n1
By taking natural logarithms of both sides of Equations (2) and (3):
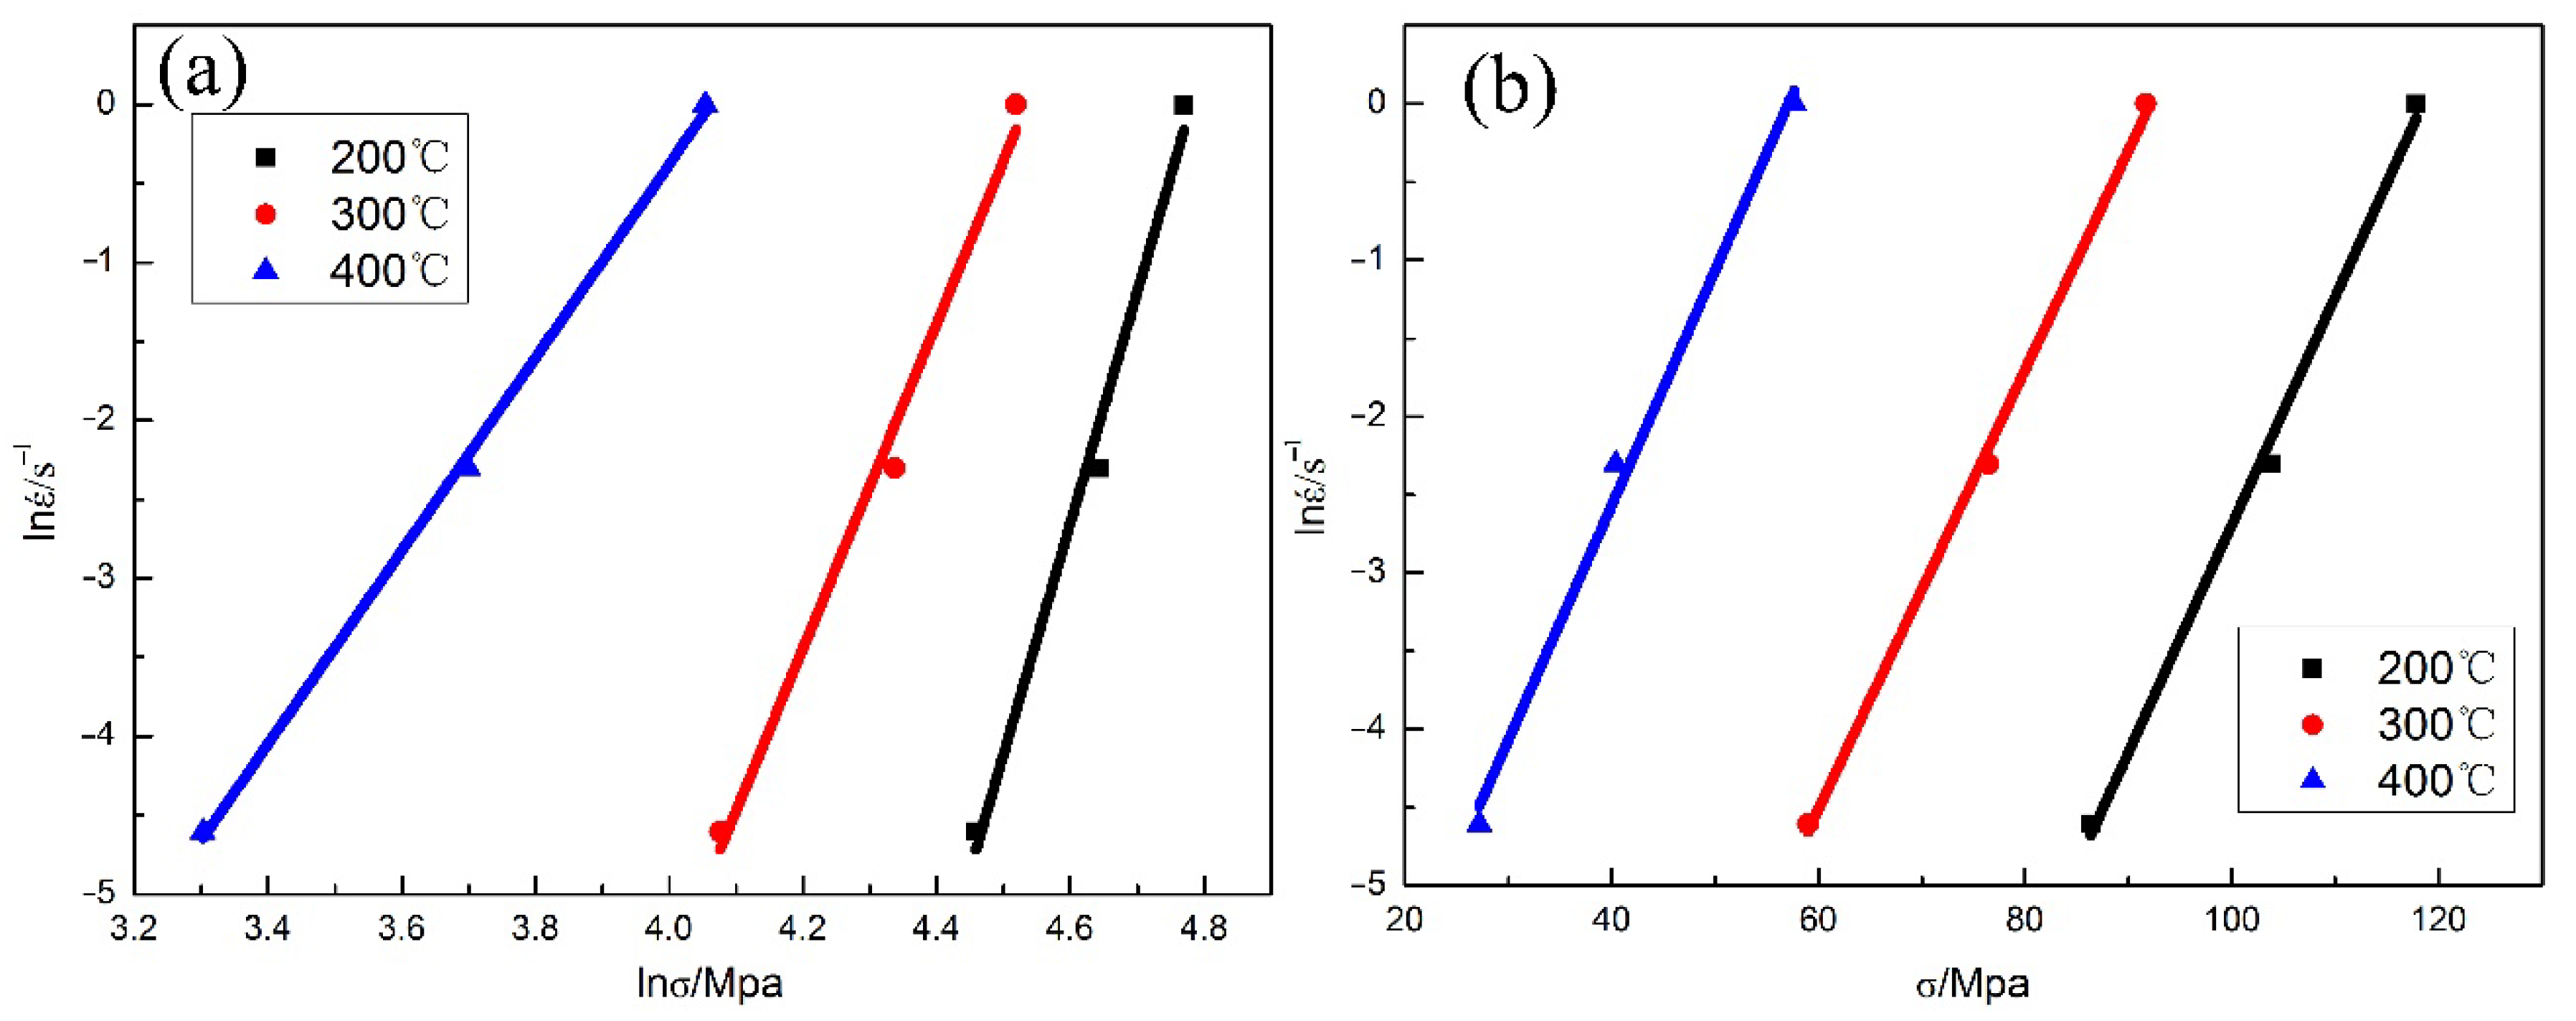
According to Equations (5) and (6), n1, β and α can be calculated. The relationship between lnέ − lnσ and lnέ − σ are plotted in Figure 3, and the slopes of the curves give the value of n1 and β, respectively. The calculated value of α is 0.014 from Equation (4).
Zener and Hollomon proposed and verified that in the isothermal deformation process of materials, the function relationship between temperature and deformation rate can be expressed by the Z-parameter, which is presented as:
By taking natural logarithms of both sides of Equation (1):
Taking the differential equation for Equation (8), the apparent activation energy Q can be expressed by the following equation:
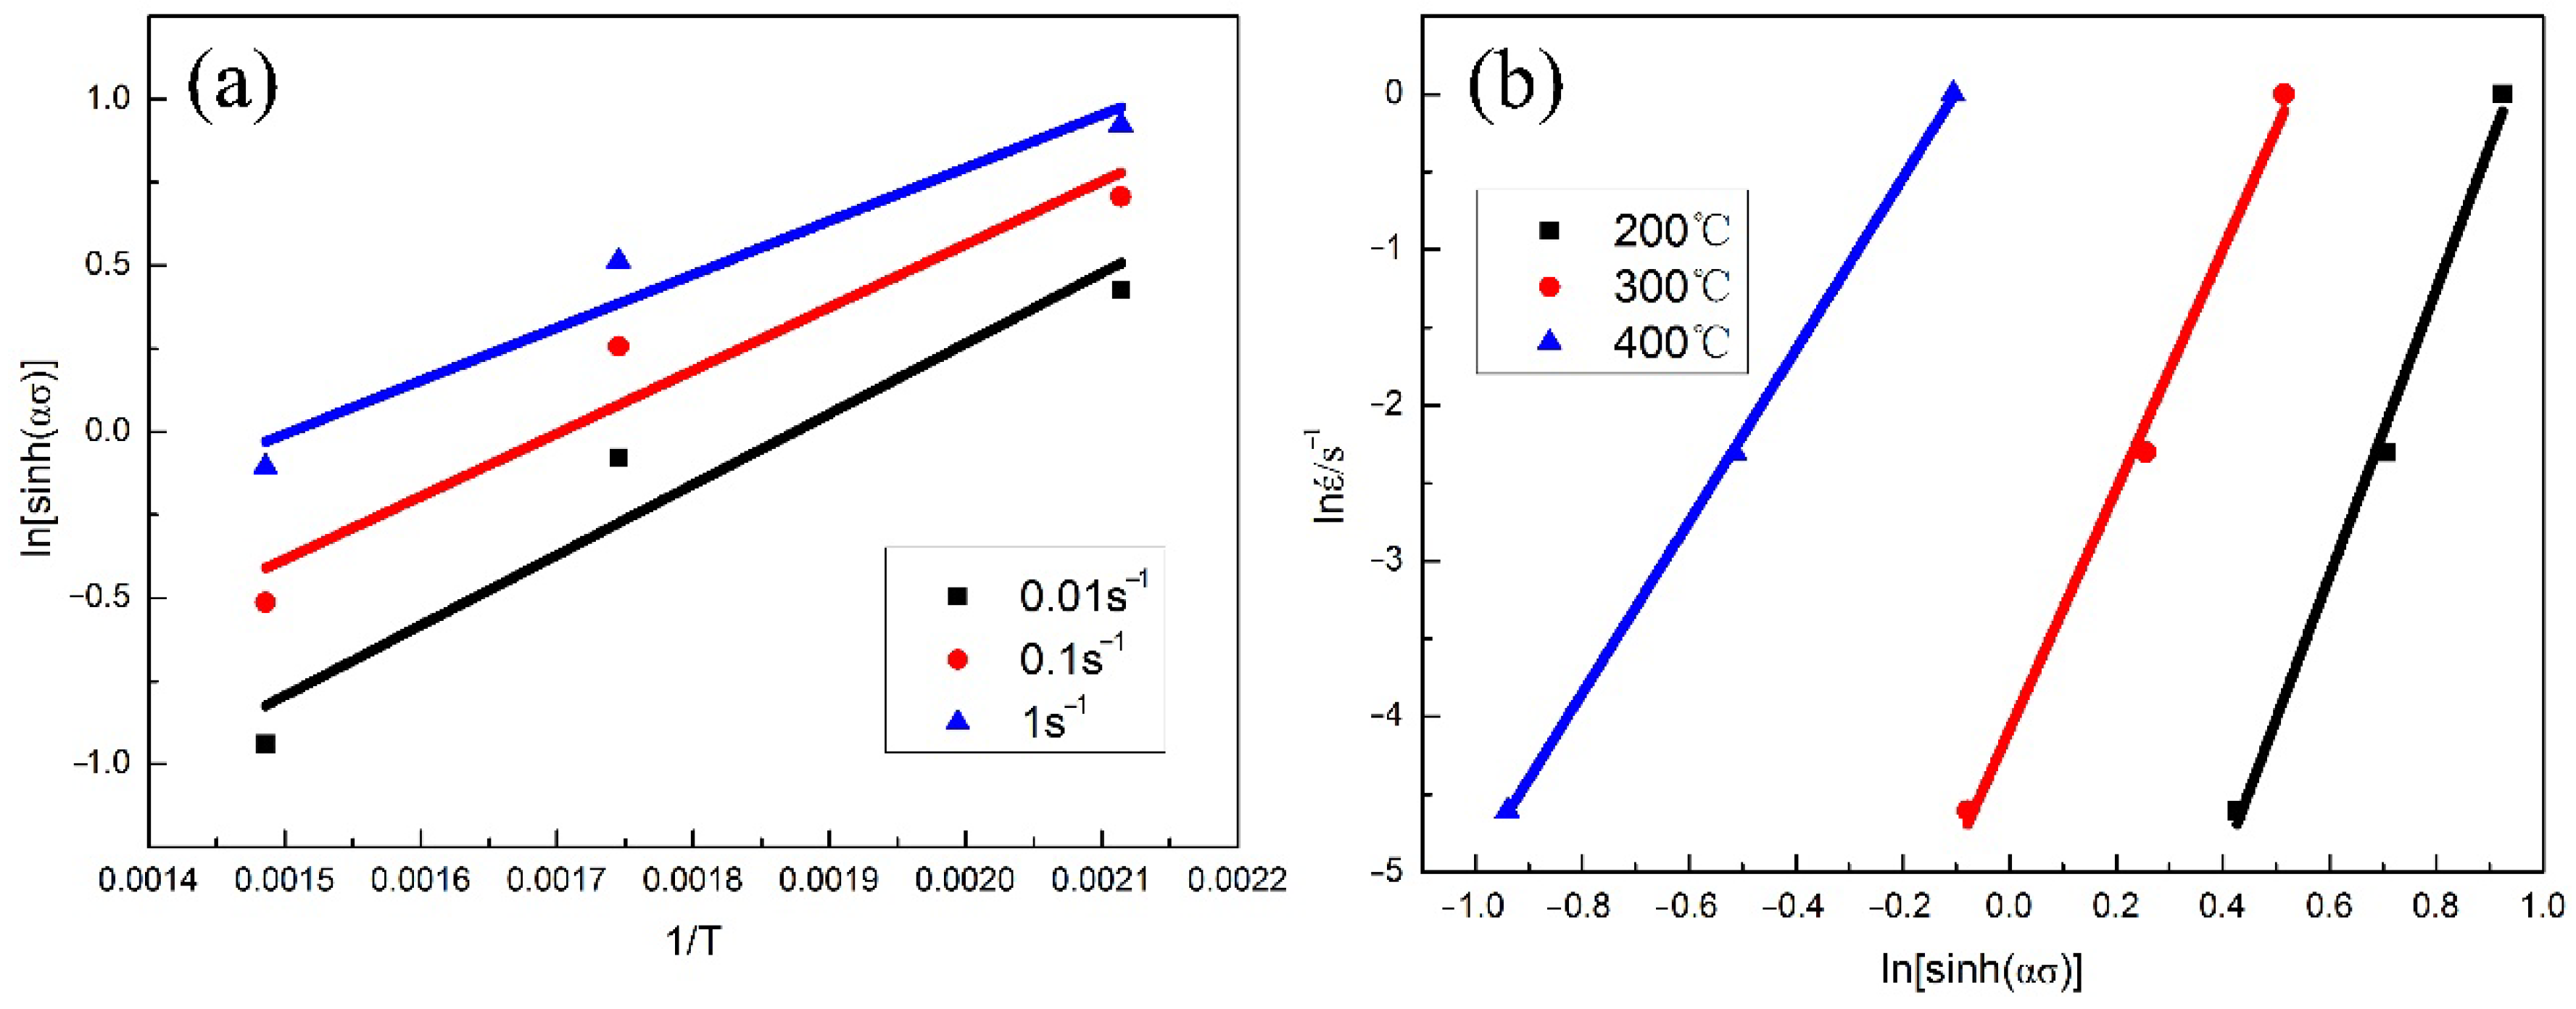
In this equation, the first item and the second item are taken from the slopes of the plots of ln[sinh(ασ)] − (1/T) at different T, and lnέ − ln[sinh(ασ)] at various έ, respectively, according to Equation (1). Figure 4 shows the ln[sinh(ασ)] − (1/T) and lnέ − ln[sinh(ασ)] curves at different temperatures, respectively. The average values of the slopes in Figure 4 are 1872.16 and 7.48, respectively. In general, the Q-value of t-he magnesium alloy is calculated to predict the deformation opening force of the alloy and the best processing conditions [22,23]. The difficulty of metal deformation at room temperature increases with the increase in Q-value [20]. Consequently, the apparent Q-value and the strain rate sensitivity parameter 1/n are 116.483 kJ/mol and 0.134, respectively. The obtained value of Q for LA11 in this study is smaller than that of the conventional AZ80 [2] (215.82 kJ/mol) and Mg-5Y binary alloy [24] (200.93 kJ/mol). Moreover, others reported the Q-value of the as-cast β-phase Mg-Li alloy was 95 kJ/mol [25], and that of the rolled α-phase Mg-Li alloy was 211 kJ/mol [26]. Meanwhile, Li alloying can decrease the c/a of the common Mg alloy, which can lower the activation energy of the non-basal slip and make it activated, thus ameliorating the deformation performance of the Mg-Li alloy. In addition, the Q-value usually depends on the grain size, the state and the compounds of the alloys.
Taking the natural logarithm on both sides of Equation (7) gives:
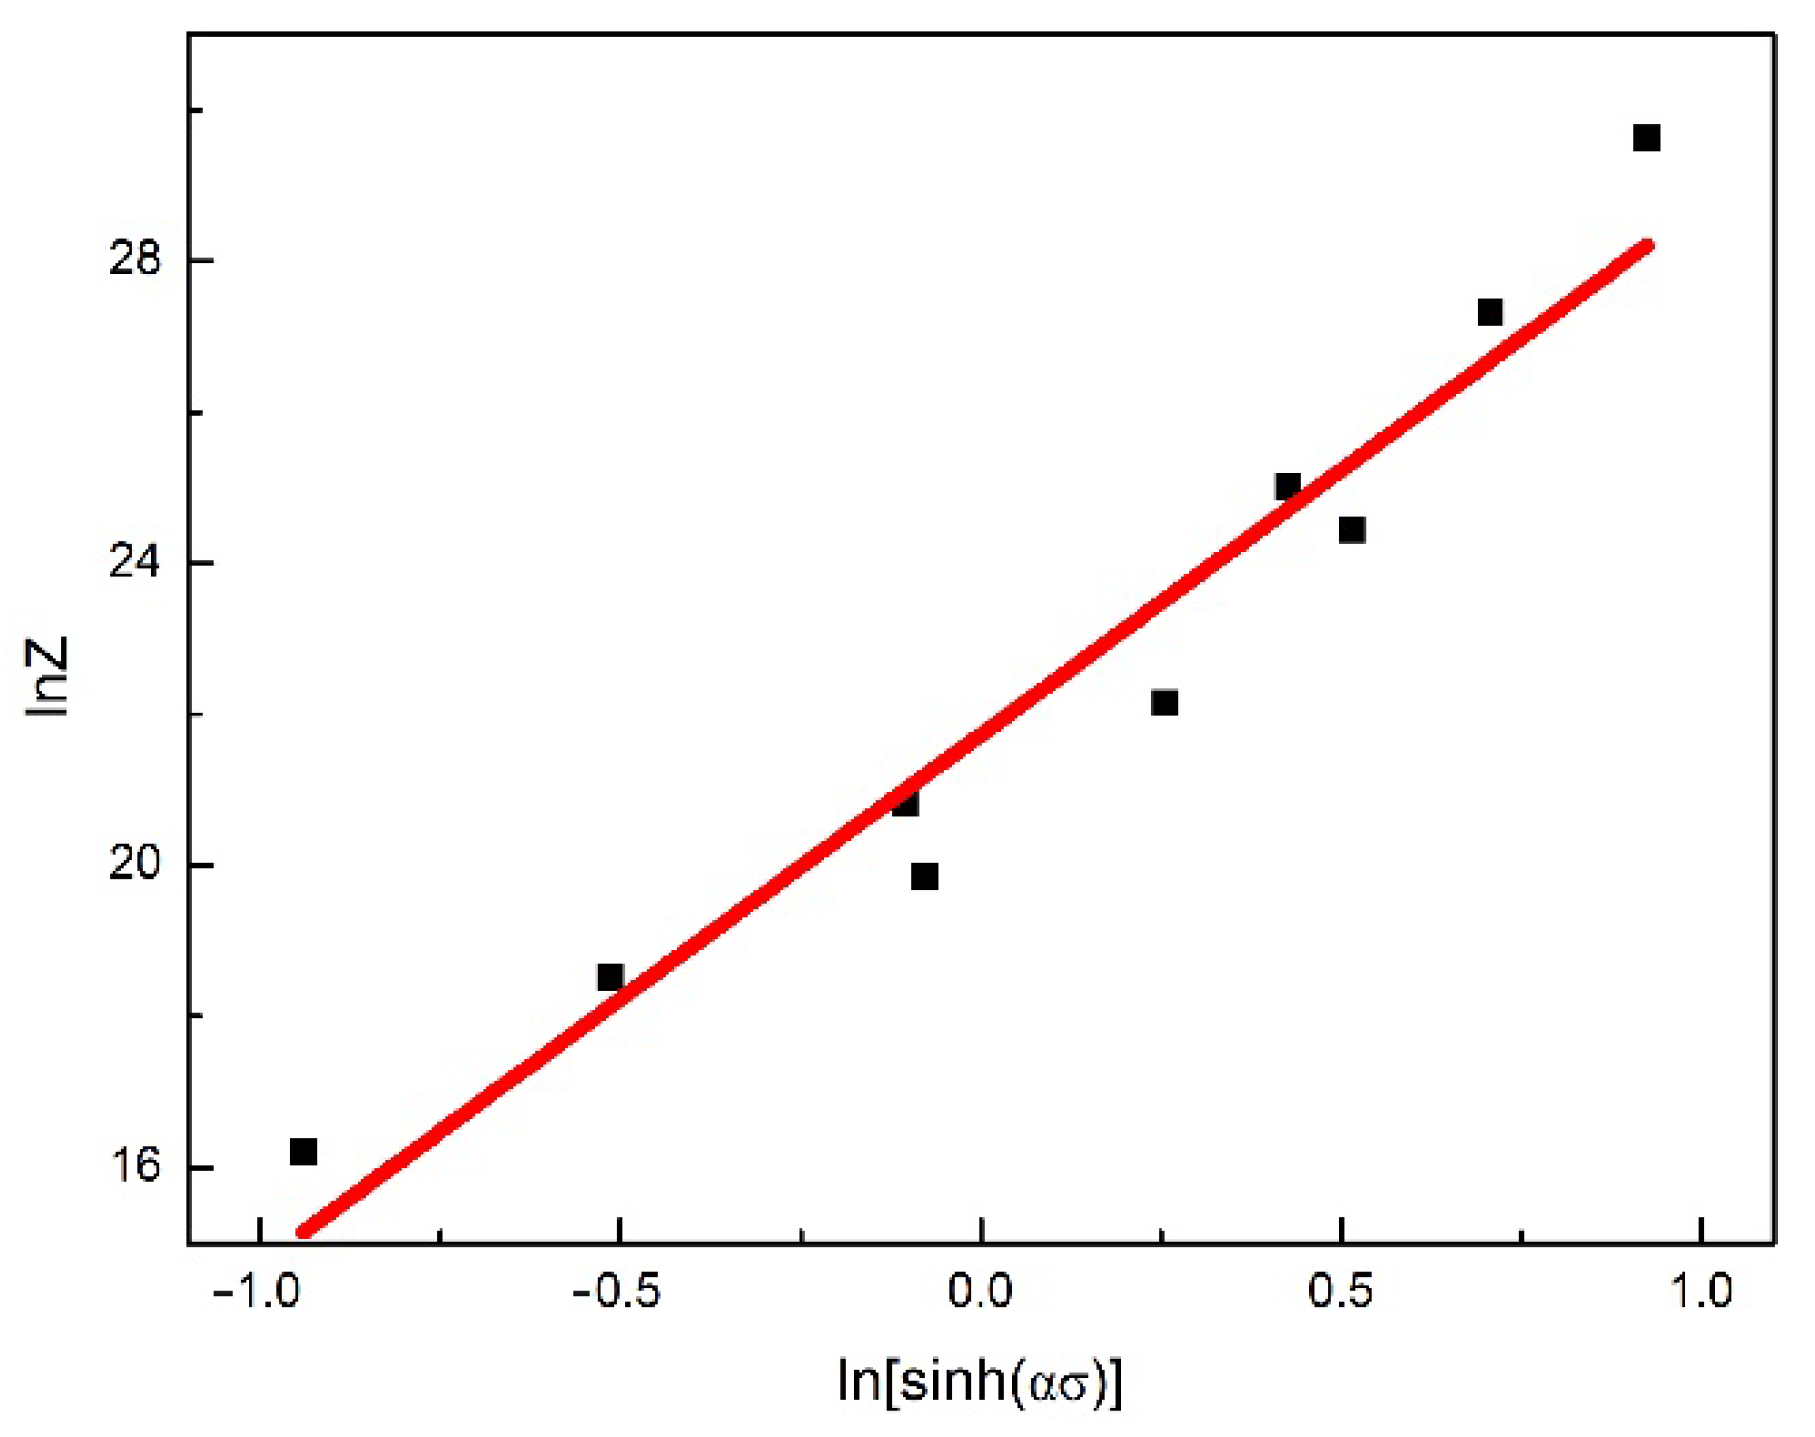
According to Q-value, the Z-parameters at different deformation conditions can be obtained from Equation (10). The fitting the relationship between lnZ and ln[sinh(ασ)] is shown in Figure 5, and the regression analysis shows that lnA = 21.73 and n = 7.004. The correlation coefficient (R) value of the fitted line is 0.94, which represents that the hyperbolic sine model is adaptive for depicting the hot compression deformation behavior of this alloy.
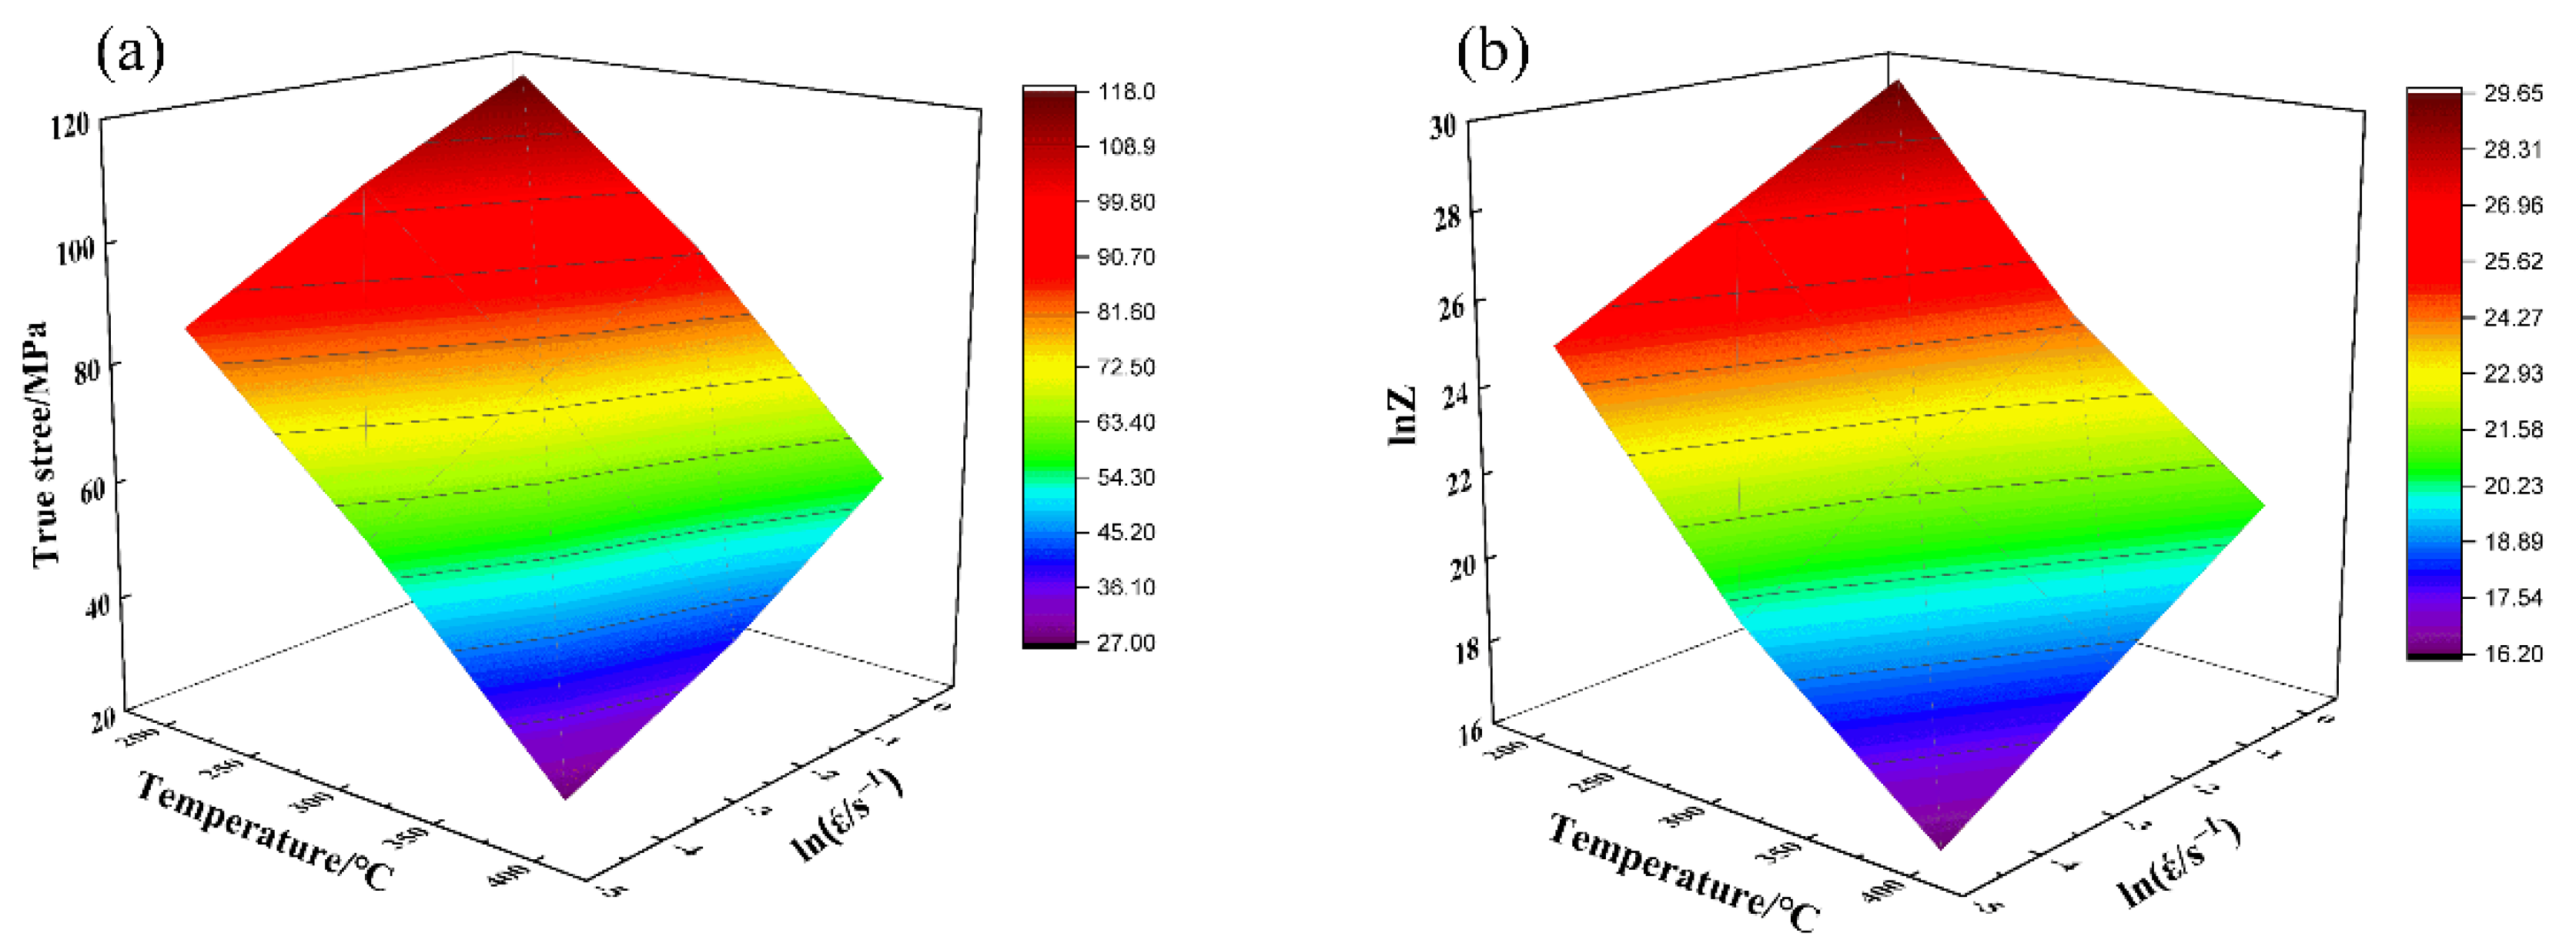
Generally speaking, both strain rate and temperature can influence the flow stress behavior. Figure 6a illustrates the peak stress of the LA11 alloy at different deformation temperatures and strain rates. As expected, the peak stress increases with increasing the deformation temperature and decreasing the strain rate. This is attributed to the major deformation mechanisms of the Mg alloy, such as twinning and slipping [7,22]. When the strain rate is at a specific range, the peak stress decreases with the increasing deformation temperature [27,28]. At a higher temperature, thermal activation energy is enhanced, which resulted in ample energy for dislocation movement and a decrease in the critical shear stress among atoms. In fact, flow softening is dominant at higher temperatures, which leads to a decrease in peak stress [29]. In addition, the non-basal slip of Mg alloys is initiated at higher temperatures. In this condition, the dislocation movement moves faster, and the deformation of each grain is more coordinated, causing nucleation and the combination of more sub-grains. This will accelerate the DRX process. At a constant temperature, increasing the strain rate leads to an increase in the peak stress. For example, deformation at lower strain rates in the present alloy, where the nucleation and growth of DRX grains are completed entirely, results in the elimination of dislocations. An increase in strain rate will contribute to insufficient DRX, rapid pile-up and tangling of dislocation and enhanced work hardening effects; thereby, the deformation resistance is increased [30,31]. Values of Z and lnZ under different deformation conditions are estimated and displayed in Figure 6b. As expected, the Z-value increases with the decreasing deformation temperature and increasing strain rate, which can also affect the work hardening rate [9]. The work hardening rate increases with the increase in the Z-value. According to the aforesaid analyses, the Z-value is positively correlated with peak stress and can reflect the movement of dislocation and slip.
Substituting all the above values into Equation (1), the constitutive equation of isothermal deformation of the LA11 alloy can be expressed as:
3.4. DRX Kinetics
The relationship between the work hardening rate and flow stress in the process of hot compression can be obtained through the stress–strain curve and expressed as [2]:
θ = dσ/dε
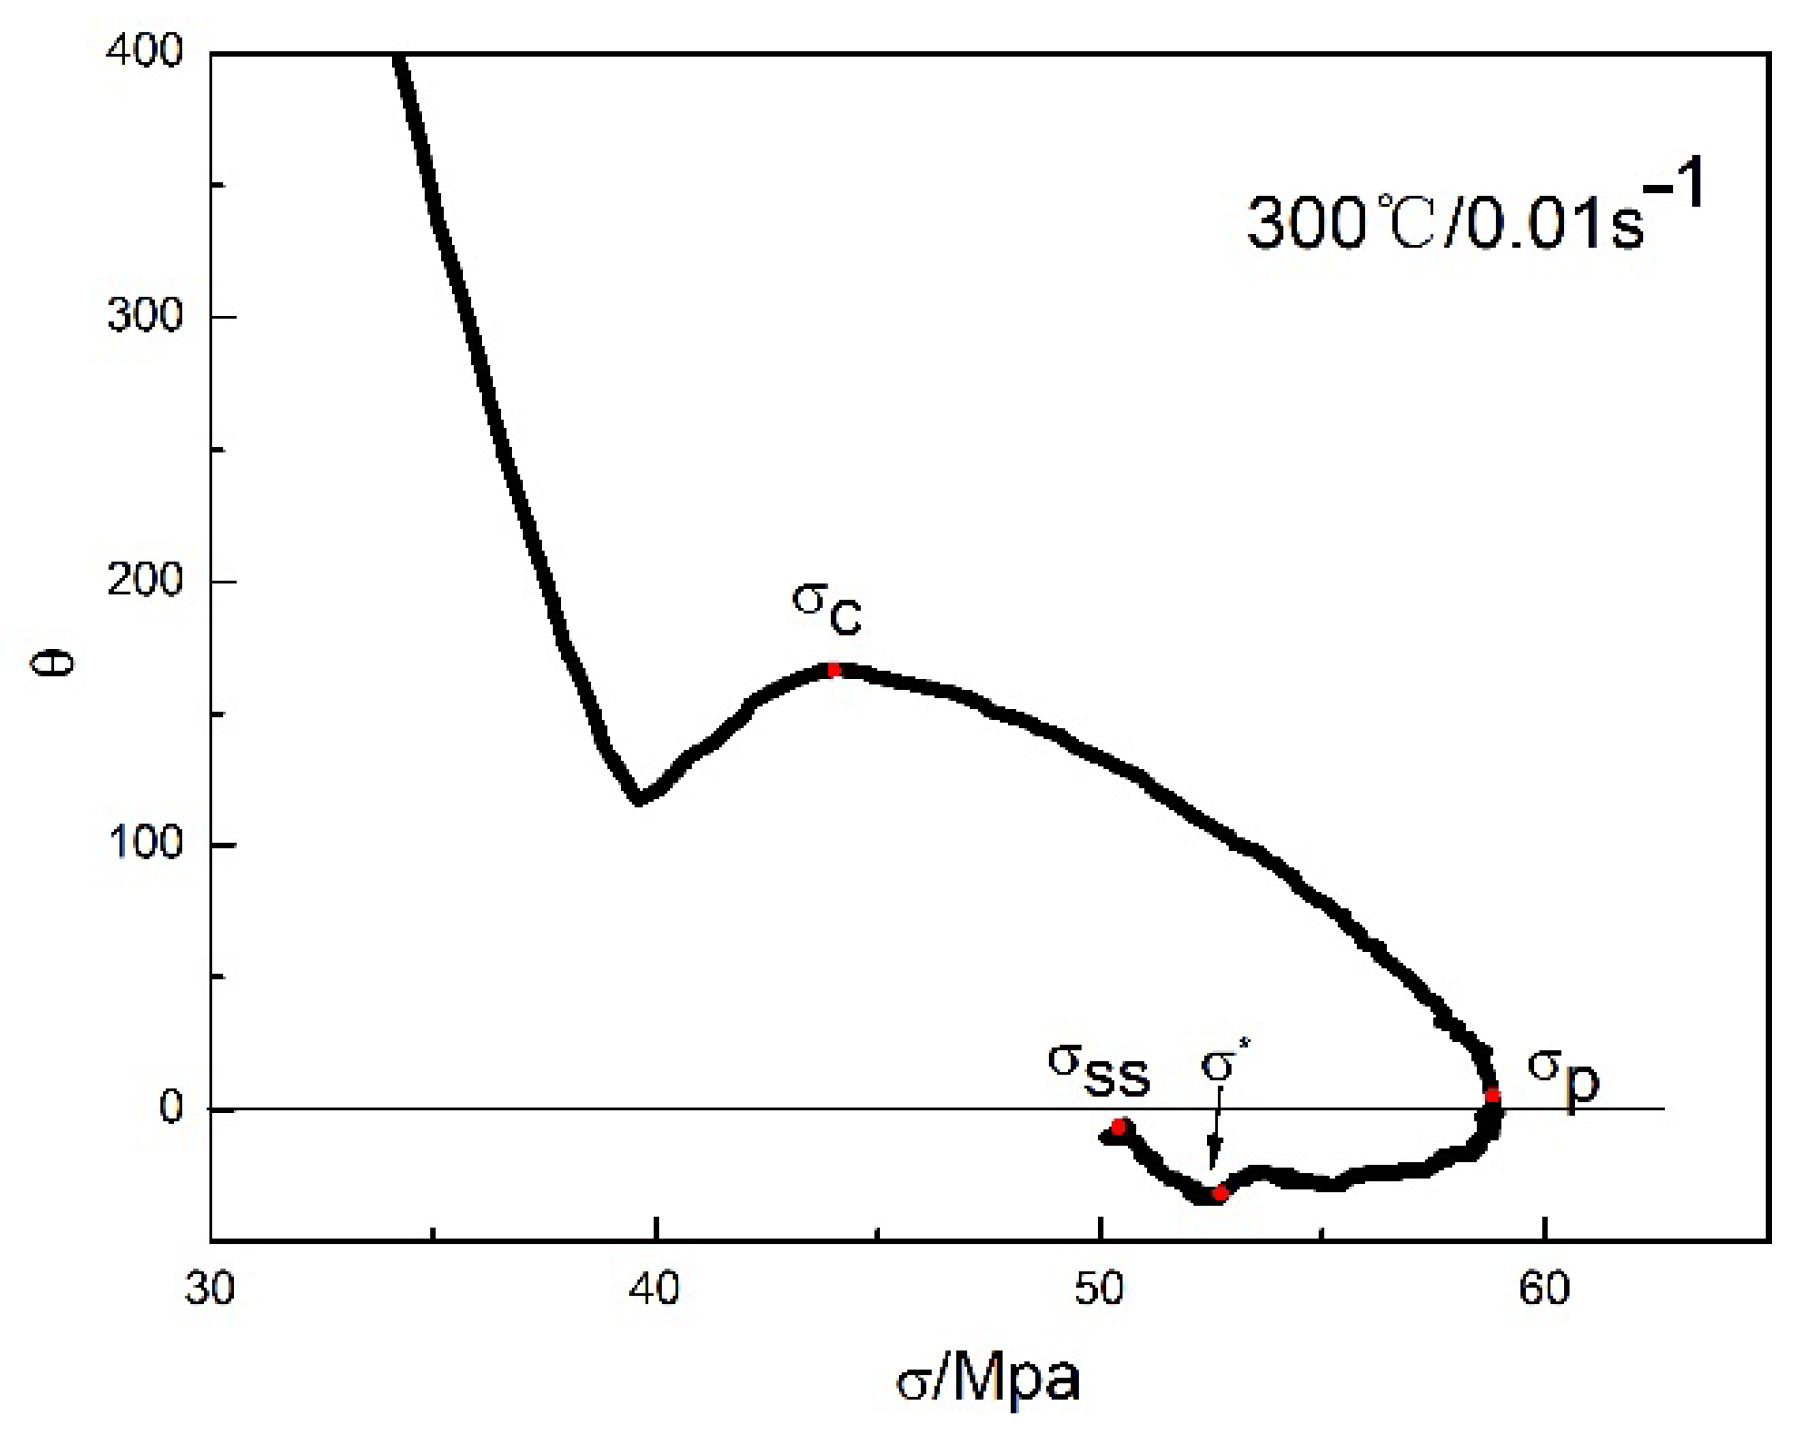
It is well known that the θ–σ curve is very important to investigate the DRX mechanism and the critical condition of DRX. A typical θ–σ plot obtained by deformation at 300 °C and 0.01 s−1 is presented in Figure 7. The dynamic softening stage is generally divided into three stages [19]. In stage I, θ drops sharply with the increase in flow stress, probably owing to dynamic recovery. Critical stress (σc) was observed at the inflection point of the θ–σ curve. In stage II, with increasing flow stress from σc to σp, θ remains positive at this stage, indicating that both dynamic recovery and DRX are enhanced and finally balanced with the work hardening effect (σp, θ = 0). Afterward, the θ continuously drops off to the smallest value in stage III, representing that softening rate stress (σ*) reaches the maximum value. At last, the flow stress approaches the stable stress (σss), which is generally considered a constant [2].
According to the above method, σc, σp, σ*, σss and the corresponding εc, εp, ε* and εss values can be confirmed under different deformation conditions.
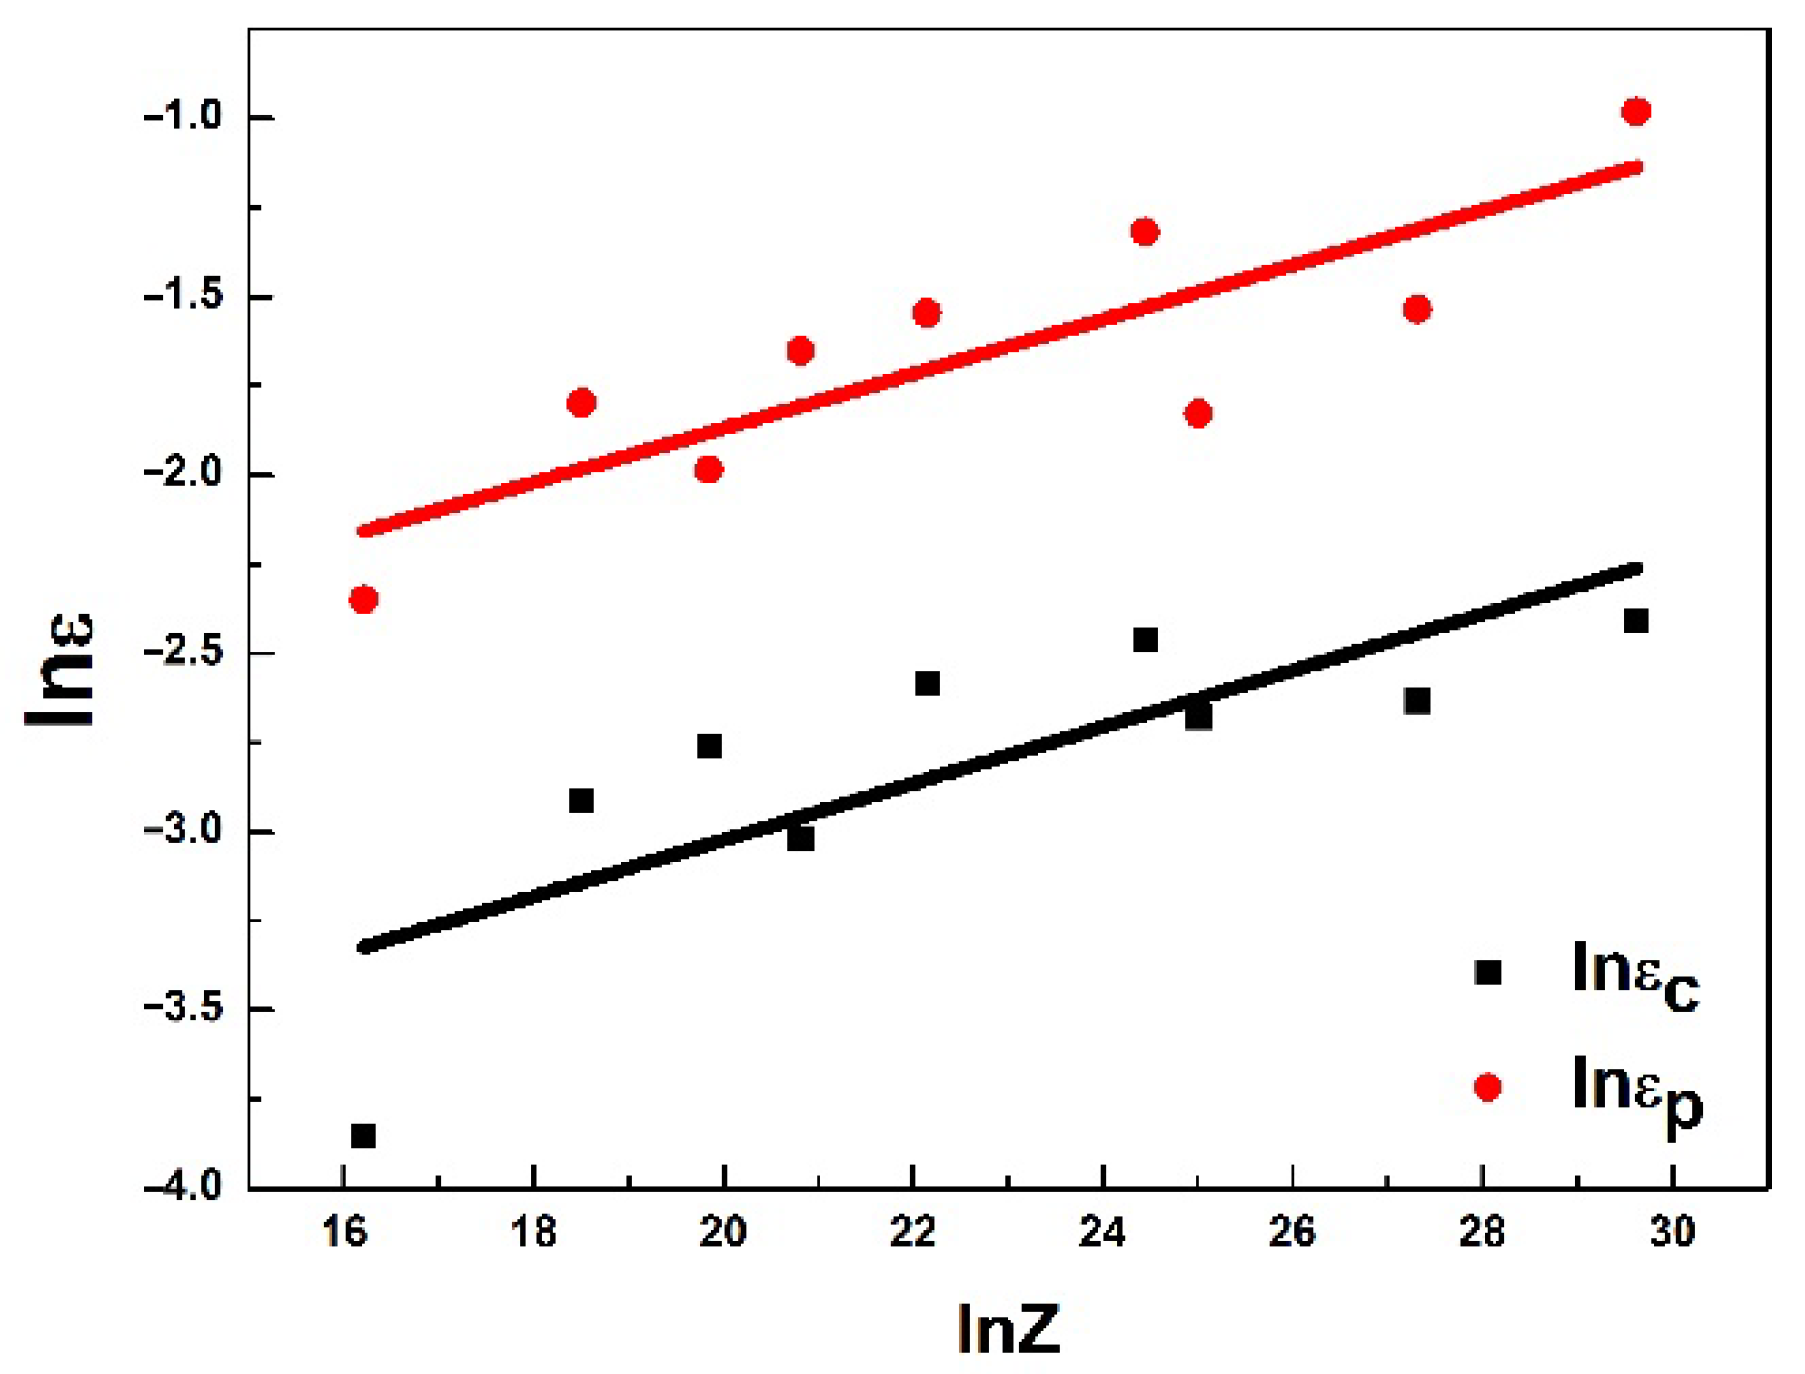
The critical condition model of DRX was established by Sellars [32]. The corresponding relationships of εc and εp as a function of the dimensionless parameter Z are presented in Figure 8. The simplified forms are expressed as:
where A and n are constants, , the relationship between lnε-lnZ was linearly fitted, and the simplified forms are expressed as
ε = AZn
εc = 0.009997Z0.07915
εp = 0.033607Z0.07623
It has been generally accepted that at higher deformation temperatures, cross slip and dislocation climbing can occur easily due to a thermally activated mechanism. The occurrence of DRX is mainly related to the dislocation density. When the dislocation density increases to a certain amount during the hot deformation of the alloy, the DRX nucleation mainly formed along the initial grain boundaries [33]. When both deformation temperature and strain rate are constants, the DRX kinetics model can be expressed by the Avrami equation [8].
where m and p are experimentally derived material constants, and XDRX is the volume fraction of DRX. Therefore, the flow stress of materials can be expressed by determining XDRX as follows:
σ − σp = XDRX (σp − σss)
Equation (13) can also be written by
Taking the natural logarithm on both sides of Equation (13), the following equation can be obtained:
ln[−ln(1 − X)] = lnp + mln[(ε − εc)/εp]
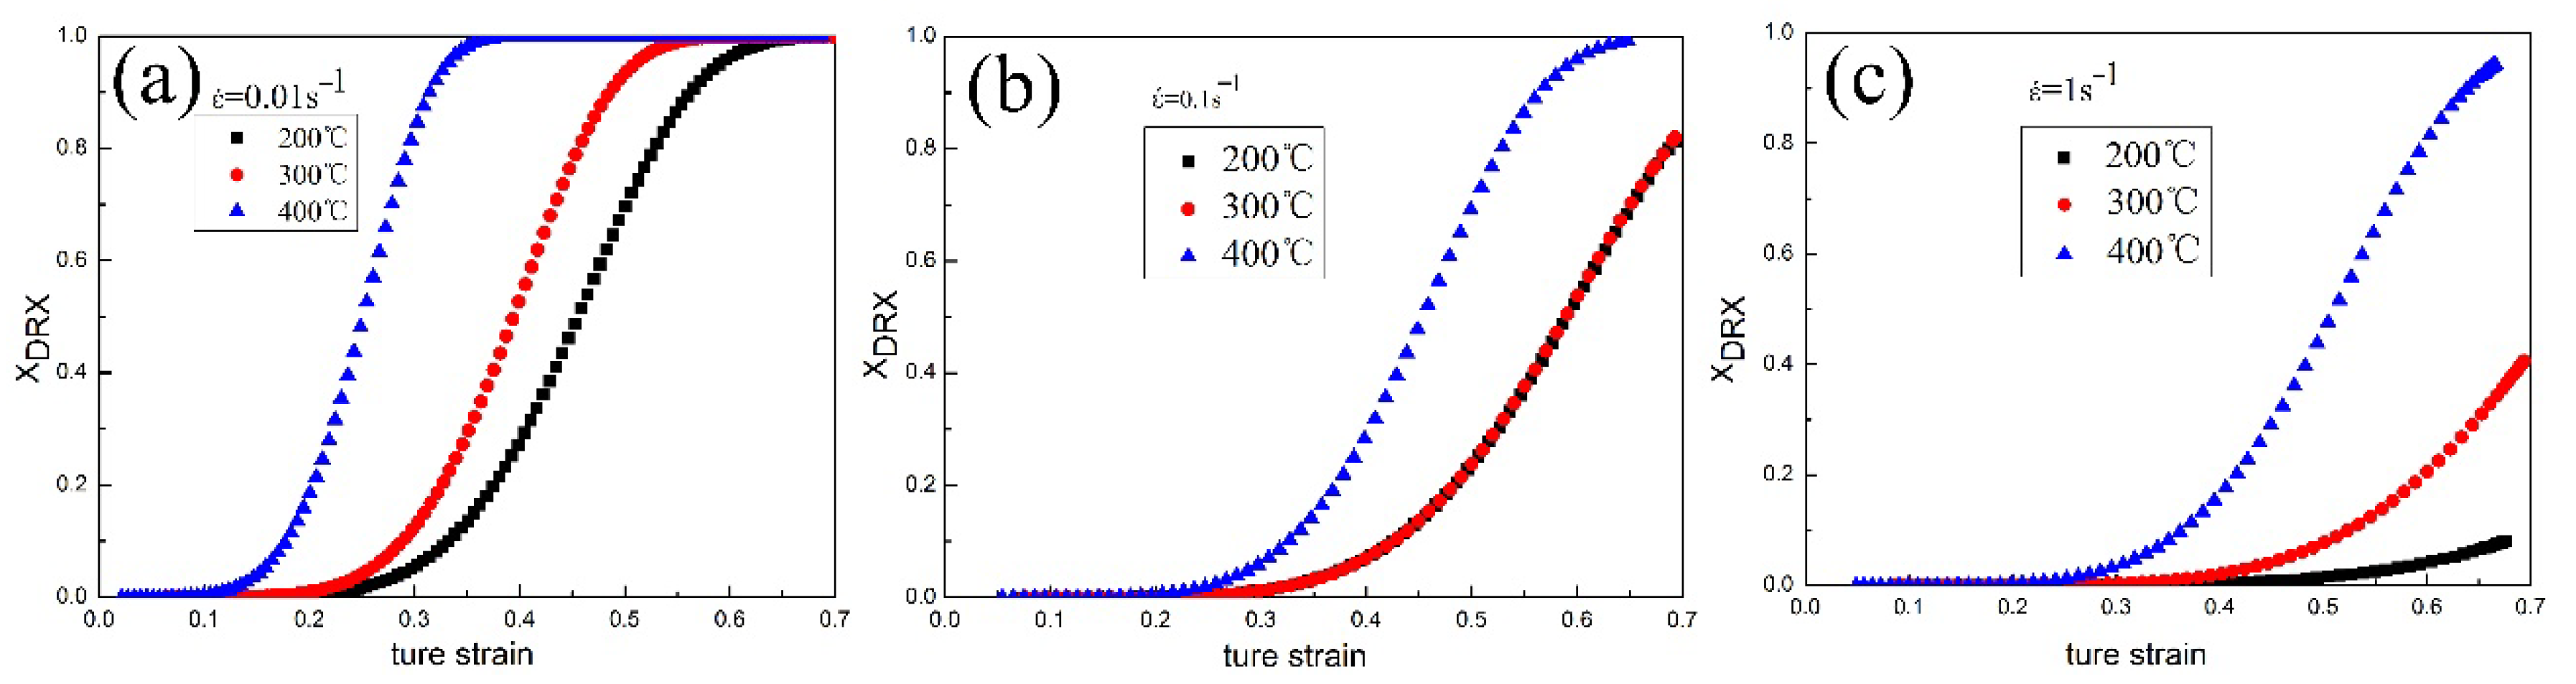
XDRX is a useful and important parameter of the material, which can be calculated using Equations (13) and (15). By taking the intercept and slope of the ln[−ln(1 − X)] and ln[(ε − εc)/εp] plots, the values of p and m are derived to be 4.91136 and 0.009257, respectively. Therefore, the kinetic model of DRX can be described as follow:
Figure 9a–c present a series of DRX kinetics curves of LA11 alloy under the investigated deformation conditions, and they exhibit typical “S-shape” curves. When the strain rate and strain are constant, the XDRX increases with deformation temperature. This is because the high deformed temperature causes atomic diffusion and grain boundary migration to intensify grain nucleation and growth rate [3]. When the deformation temperature and strain amount are constant, increasing the strain rate decreased the XDRX [34]. This trend occurred because the larger strain rate leads to a higher dislocation density in the alloy, which makes the nucleation rate of DRX greater than the growth of DRX grains, and the DRX grains do not have enough time to grow [35,36]. In short, increasing the deformation temperature and decreasing the strain rate during the thermal deformation process is favorable for the occurrence of DRX.
4. DRX of Deformed LA11 Alloy
4.1. Effect of Temperature on DRX Microstructure
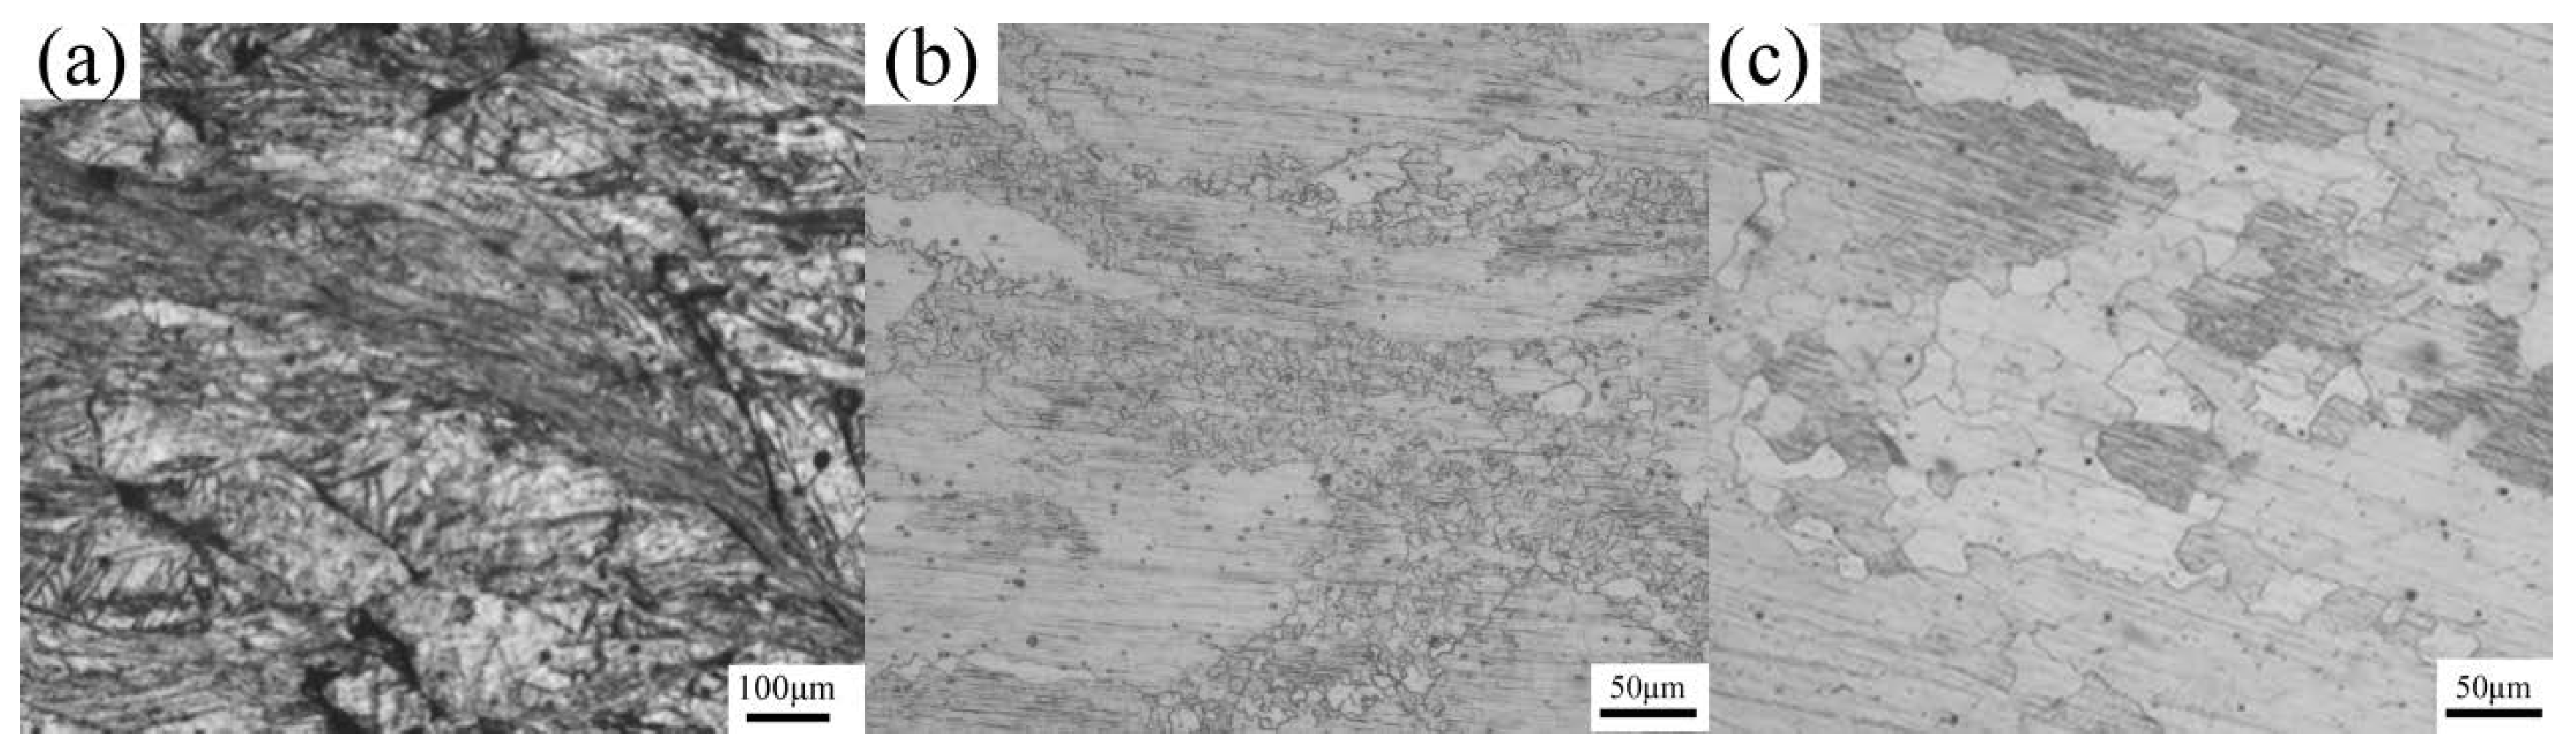
It has been reported that the DRX mechanism and microstructure evolutions during the hot deformation process are closely associated with grain orientation, grain boundary energy, and dislocation activity, which are affected by deformation temperature. In order to further analyze the DRX behavior, microstructures of LA11 alloy at different deformation conditions are shown in Figure 10. It can be seen from Figure 10a that there are a large number of the shear bands in the LA11 alloy, and fine DRX grains are produced in the center of the shear band when deformed at 200 °C and 0.01 s−1. Figure 10b displays the evidence of the formation of new DRX grains at the original grain boundary with a “necklace” microstructure. This is in accordance with the DRX kinetics curve with the deformation condition of 300 °C and 0.01 s−1. When deformed at 400 °C and 0.01 s−1, a complete DRX microstructure is obtained, as shown in Figure 10c. Moreover, with the increase in the deformation temperature, the DRX is gradually and sufficiently developed. This is because enough driving force at a high temperature makes dislocation more prone to slip and migration and grain boundary migration, which promotes the nucleation and growth of DRX grains [37,38]. Therefore, the DRX can be effectively improved by increasing the deformation temperature.
4.2. Effect of Strain Rate on DRX Microstructure
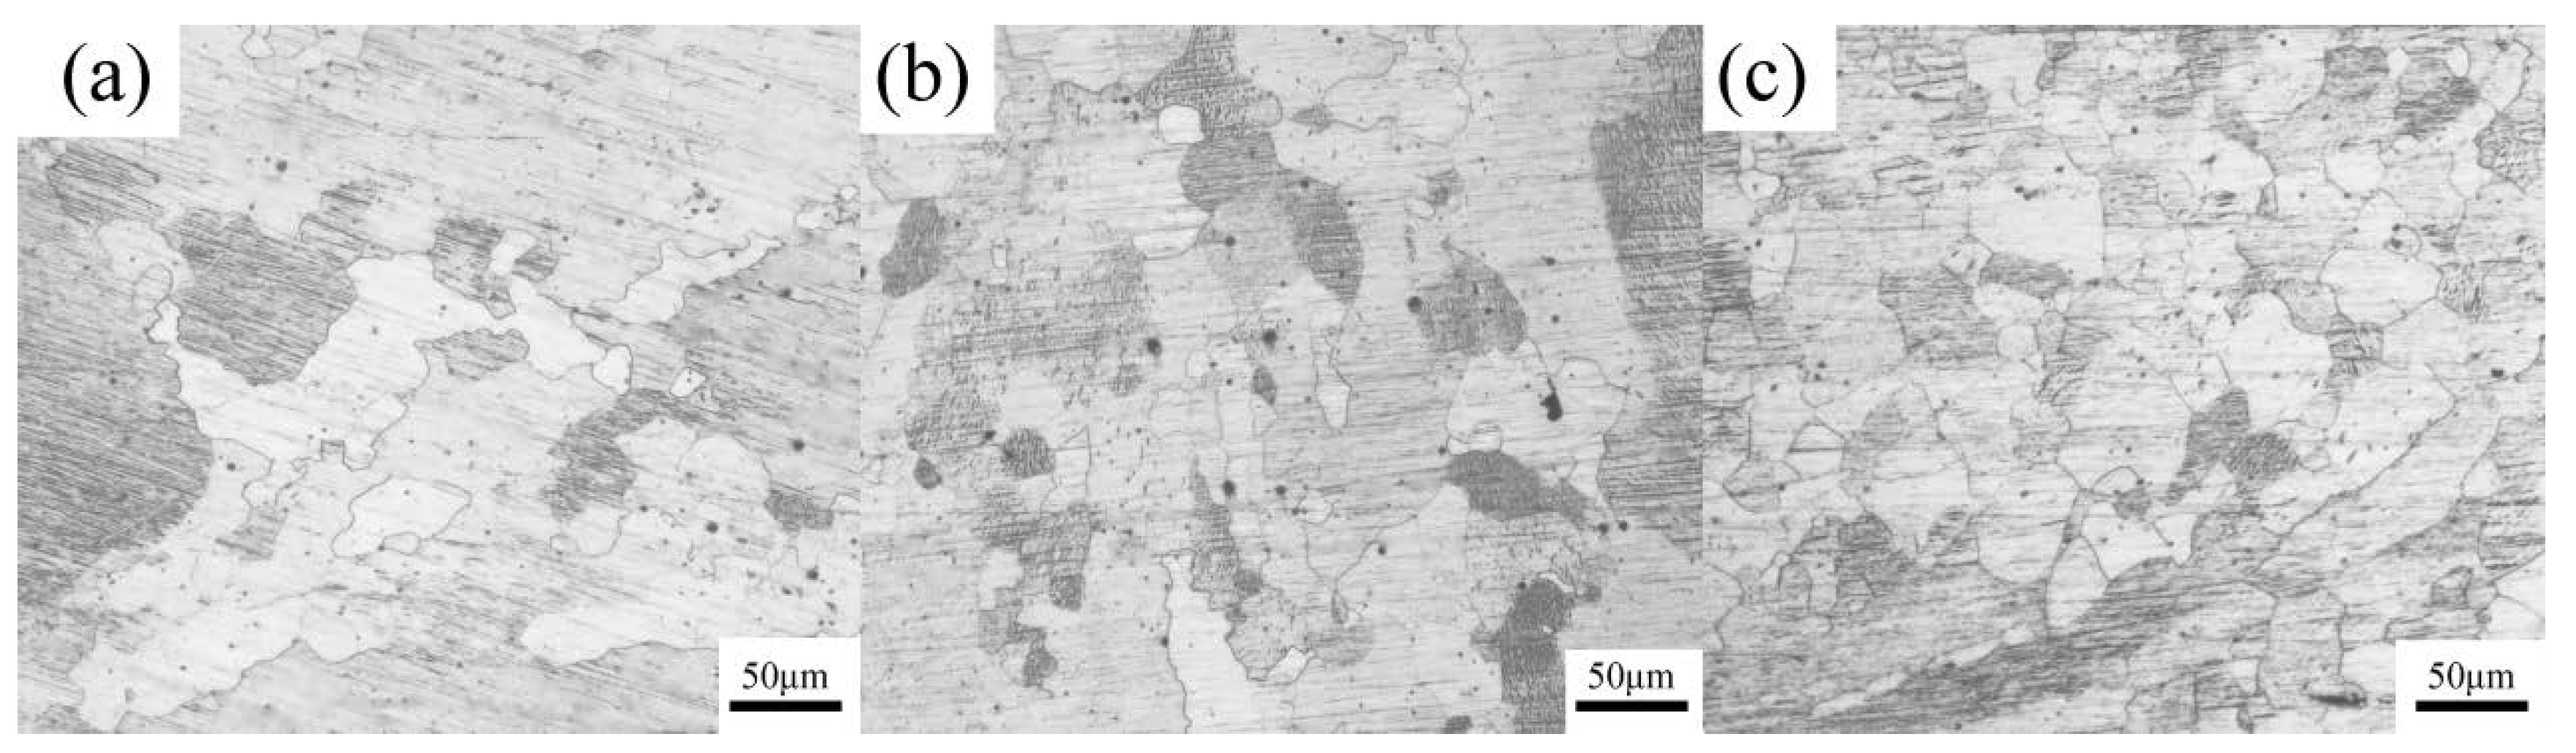
Figure 11 demonstrates the optical microstructure of LA11 alloy obtained under the temperatures of 400 °C and strain rates of 0.01–1 s−1. It is obvious that decreasing the strain rate contributes to a smaller size of DRX grains. When deformed at a strain rate of 1 s−1 (Figure 11c), the DRX grains can be observed around grain boundaries. The DRX grains are preferred to nucleate at grain boundaries because the larger the initial grain size, the higher the strain energy at grain boundaries [15,34,39]. Furthermore, the dislocations have enough time to slip and climb as the strain rate decreases, resulting in enough time for the DRX grains to grow up [33,40]. Thus, a large number of recrystallized grains are preferentially concentrated along the grain boundaries. With an increase in the strain rate, the XDRX decreases.
4.3. Effect of Z-Values on DRX Microstructure
The Z-parameter is usually introduced to study the influences of the deformation temperature and strain rate on the mechanical behavior of materials during hot working. In the present study, the lnZ values corresponding to Figure 10a–c are 25.02, 19.85 and 16.21, respectively, and the lnZ values corresponding to Figure 11a–c are 16.21, 18.52 and 20.82, respectively. It is obvious that decreasing the Z-value can lead to a higher fraction and larger grain size of DRX grains when the deformation temperature and the strain rate are constants [41]. The trend of Z-values was identical to the peak stress; that is, both increasing the deformation temperature and decreasing the strain rate also result in the decrease in the Z-value. Moreover, a complete DRX happens under the deformation condition of a lower Z-value, which is broadly in line with DRX’s kinetic model. Consequently, the average size of the DRX grains decreases as the Z-value increases. To achieve a more homogeneous and finer microstructure, the deformation temperature and strain rate should be considered.
4.4. EBSD Analysis
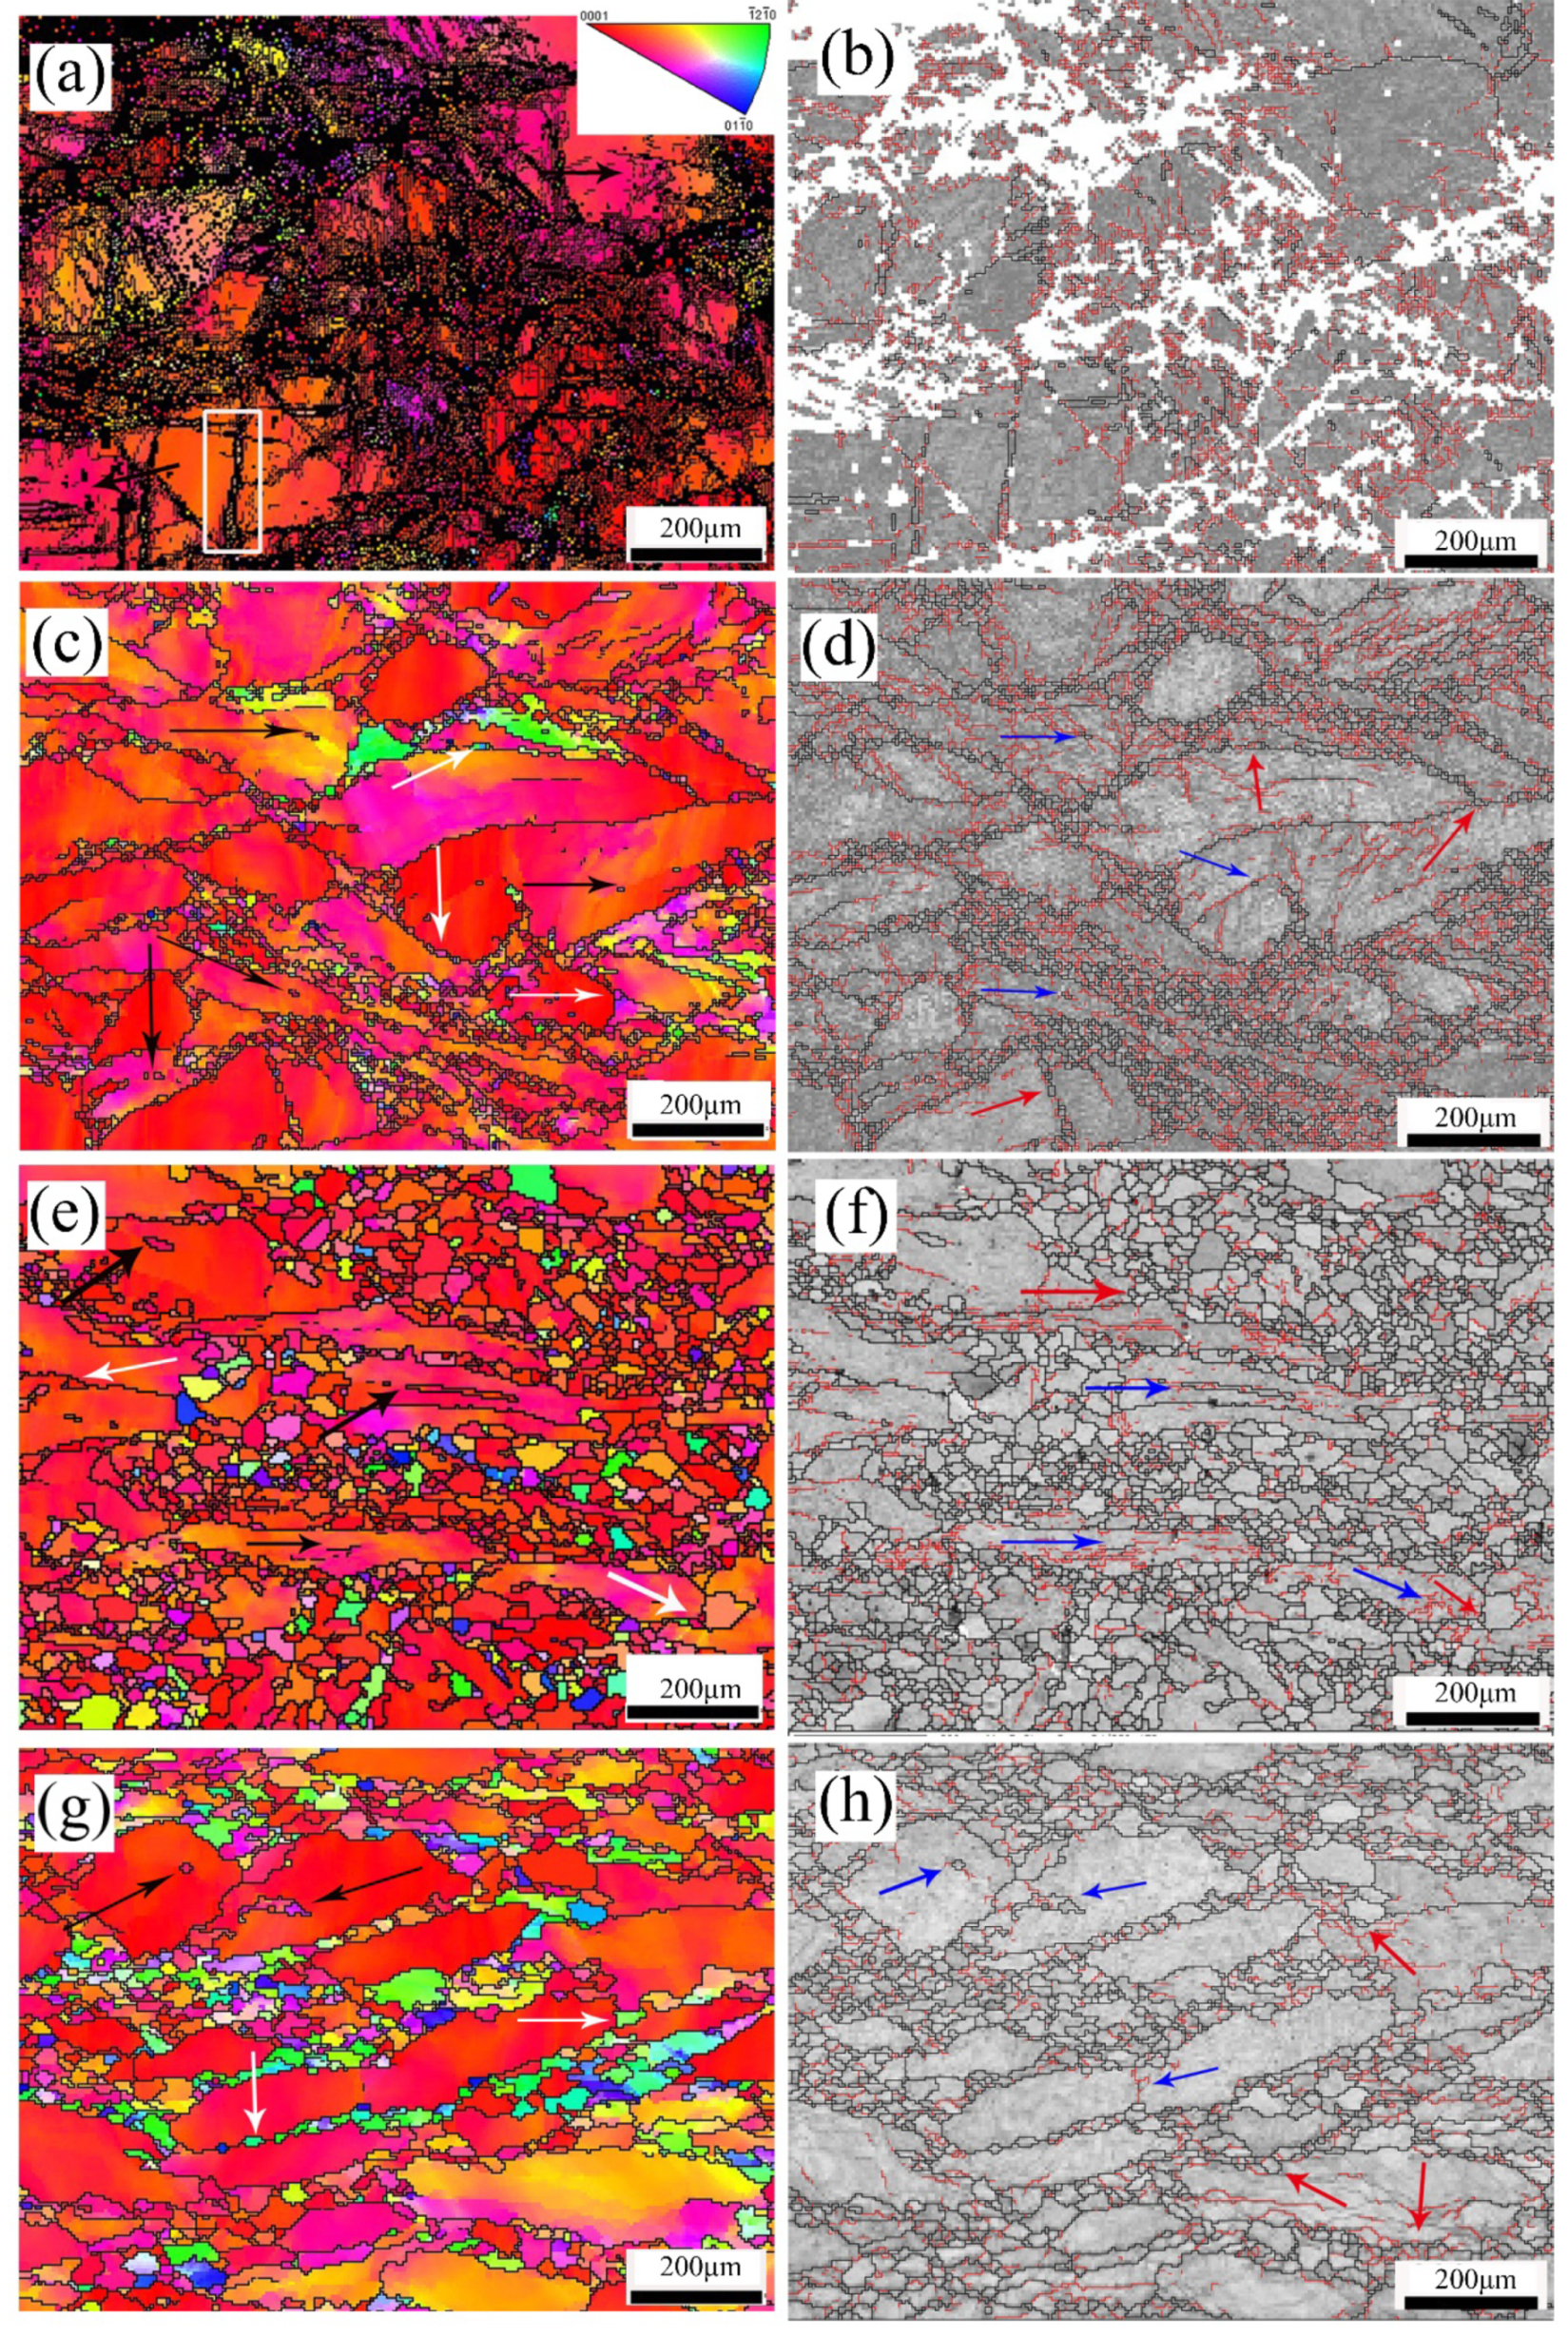
The IPF (inverse pole figure) maps and the grain boundaries of the deformed samples are shown in Figure 12, corresponding to the different deformation conditions. Additionally, in the grain boundary maps, the black lines represent high-angle grain boundaries (HAGBs), and the red lines represent low-angle grain boundaries (LAGBs), respectively. It is obvious that the obtained microstructure represents a typical recovered and deformed structure. The grains are elongated along the vertical direction of compression, with a few sub-grains formed within the grains. Moreover, the microstructure can also be affected by the deformation temperature, another factor of Z. For instance, dislocation entanglements appear, with developed dislocation walls within individual grains, when deformed at low temperature (200 °C/0.01 s−1, lnZ = 25.02) [9,42]. It is obvious that there are numerous recrystallized grains and sub-grains, marked by white rectangles, around grain boundaries and within individual grains (marked by black arrows in Figure 12a,b). A small number of microcracks due to stress concentration at the boundary release at a low deformation temperature. Decreasing the deformation temperature leads to numerous dislocation tangles, which results in more sub-grains (Figure 12d,f) and recrystallized grains, marked by white arrows, around the grain boundaries and within individual grains (indicated by black arrows in Figure 12c,e). The dislocation migration rate and grain boundary mobility increase with the increase in temperature, which promotes the growth of grain nuclei and recrystallized grains near the original grain boundaries. At the same time, some recrystallized grains are observed at a lower deformation temperature. In addition, there are a few adiabatic shear bands distributed around 45° from the compression direction. The main reason is that the lower temperature and higher Z-parameter are not conducive to grain boundary sliding, resulting in a large amount of stress concentrated in the shear band local sliding. As can be seen from Figure 12e,g (lnZ = 16.21, lnZ = 18.52), a lower strain rate and a lower Z-parameter are favorable for recrystallization at a constant temperature. This issue is unsurprising because serious deformation heat transmits insufficiently due to high strain rates, and the slip of dislocation and grain boundary is hard to happen, thereby leading to a local flow of the alloys along the surface of the highest shear stress [43,44].
It is worth noting that the dominant recrystallization mechanism of the common Mg alloy is continuous dynamic recrystallization (CDRX) during hot deformation [39], where increasing the strain rate leads to an increase in the average misalignment angle. Grains with CDRX characteristics in Figure 12b,d,f,h are represented by blue arrows, and they show that the proportion of CDRX decreases with the decrease in lnZ. Moreover, DDRX is another typical DRX mechanism. Grain boundary bulging (BLG) is a typical nucleation mechanism of DDRX, which is characterized by an arch outside grain boundaries. Grains with BLG characteristics were observed under different deformation conditions (blue arrow). In general, at a higher temperature and lower strain rate with smaller lnZ, the dislocation density decreases, and the sub-crystal size increases [17]. Therefore, it can be inferred that the decrease in lnZ values results in the recrystallization mechanism of CDRX developing into DDRX.
Primary deformation mechanisms in magnesium alloys were reported to be: (i) twinning, (ii) basal and non-basal slipping and (iii) dislocation–twin interaction. There are few independent slip systems of the Mg alloy with the HCP structure when deformed at room temperature [17], thereby twinning plays an important part when deformed at lower temperatures and higher strain rates, such as {102} tension twinning and {101} contraction twinning. Both the level of CRSS and Schmid Factor (SF) can influence the deformation mechanisms seriously. The CRSS of base slip is the lowest, while that of the extension twin is only greater than the basal slip [35]. Therefore, the main deformation systems in Mg alloys are basal slip and tension twinning [37,45].
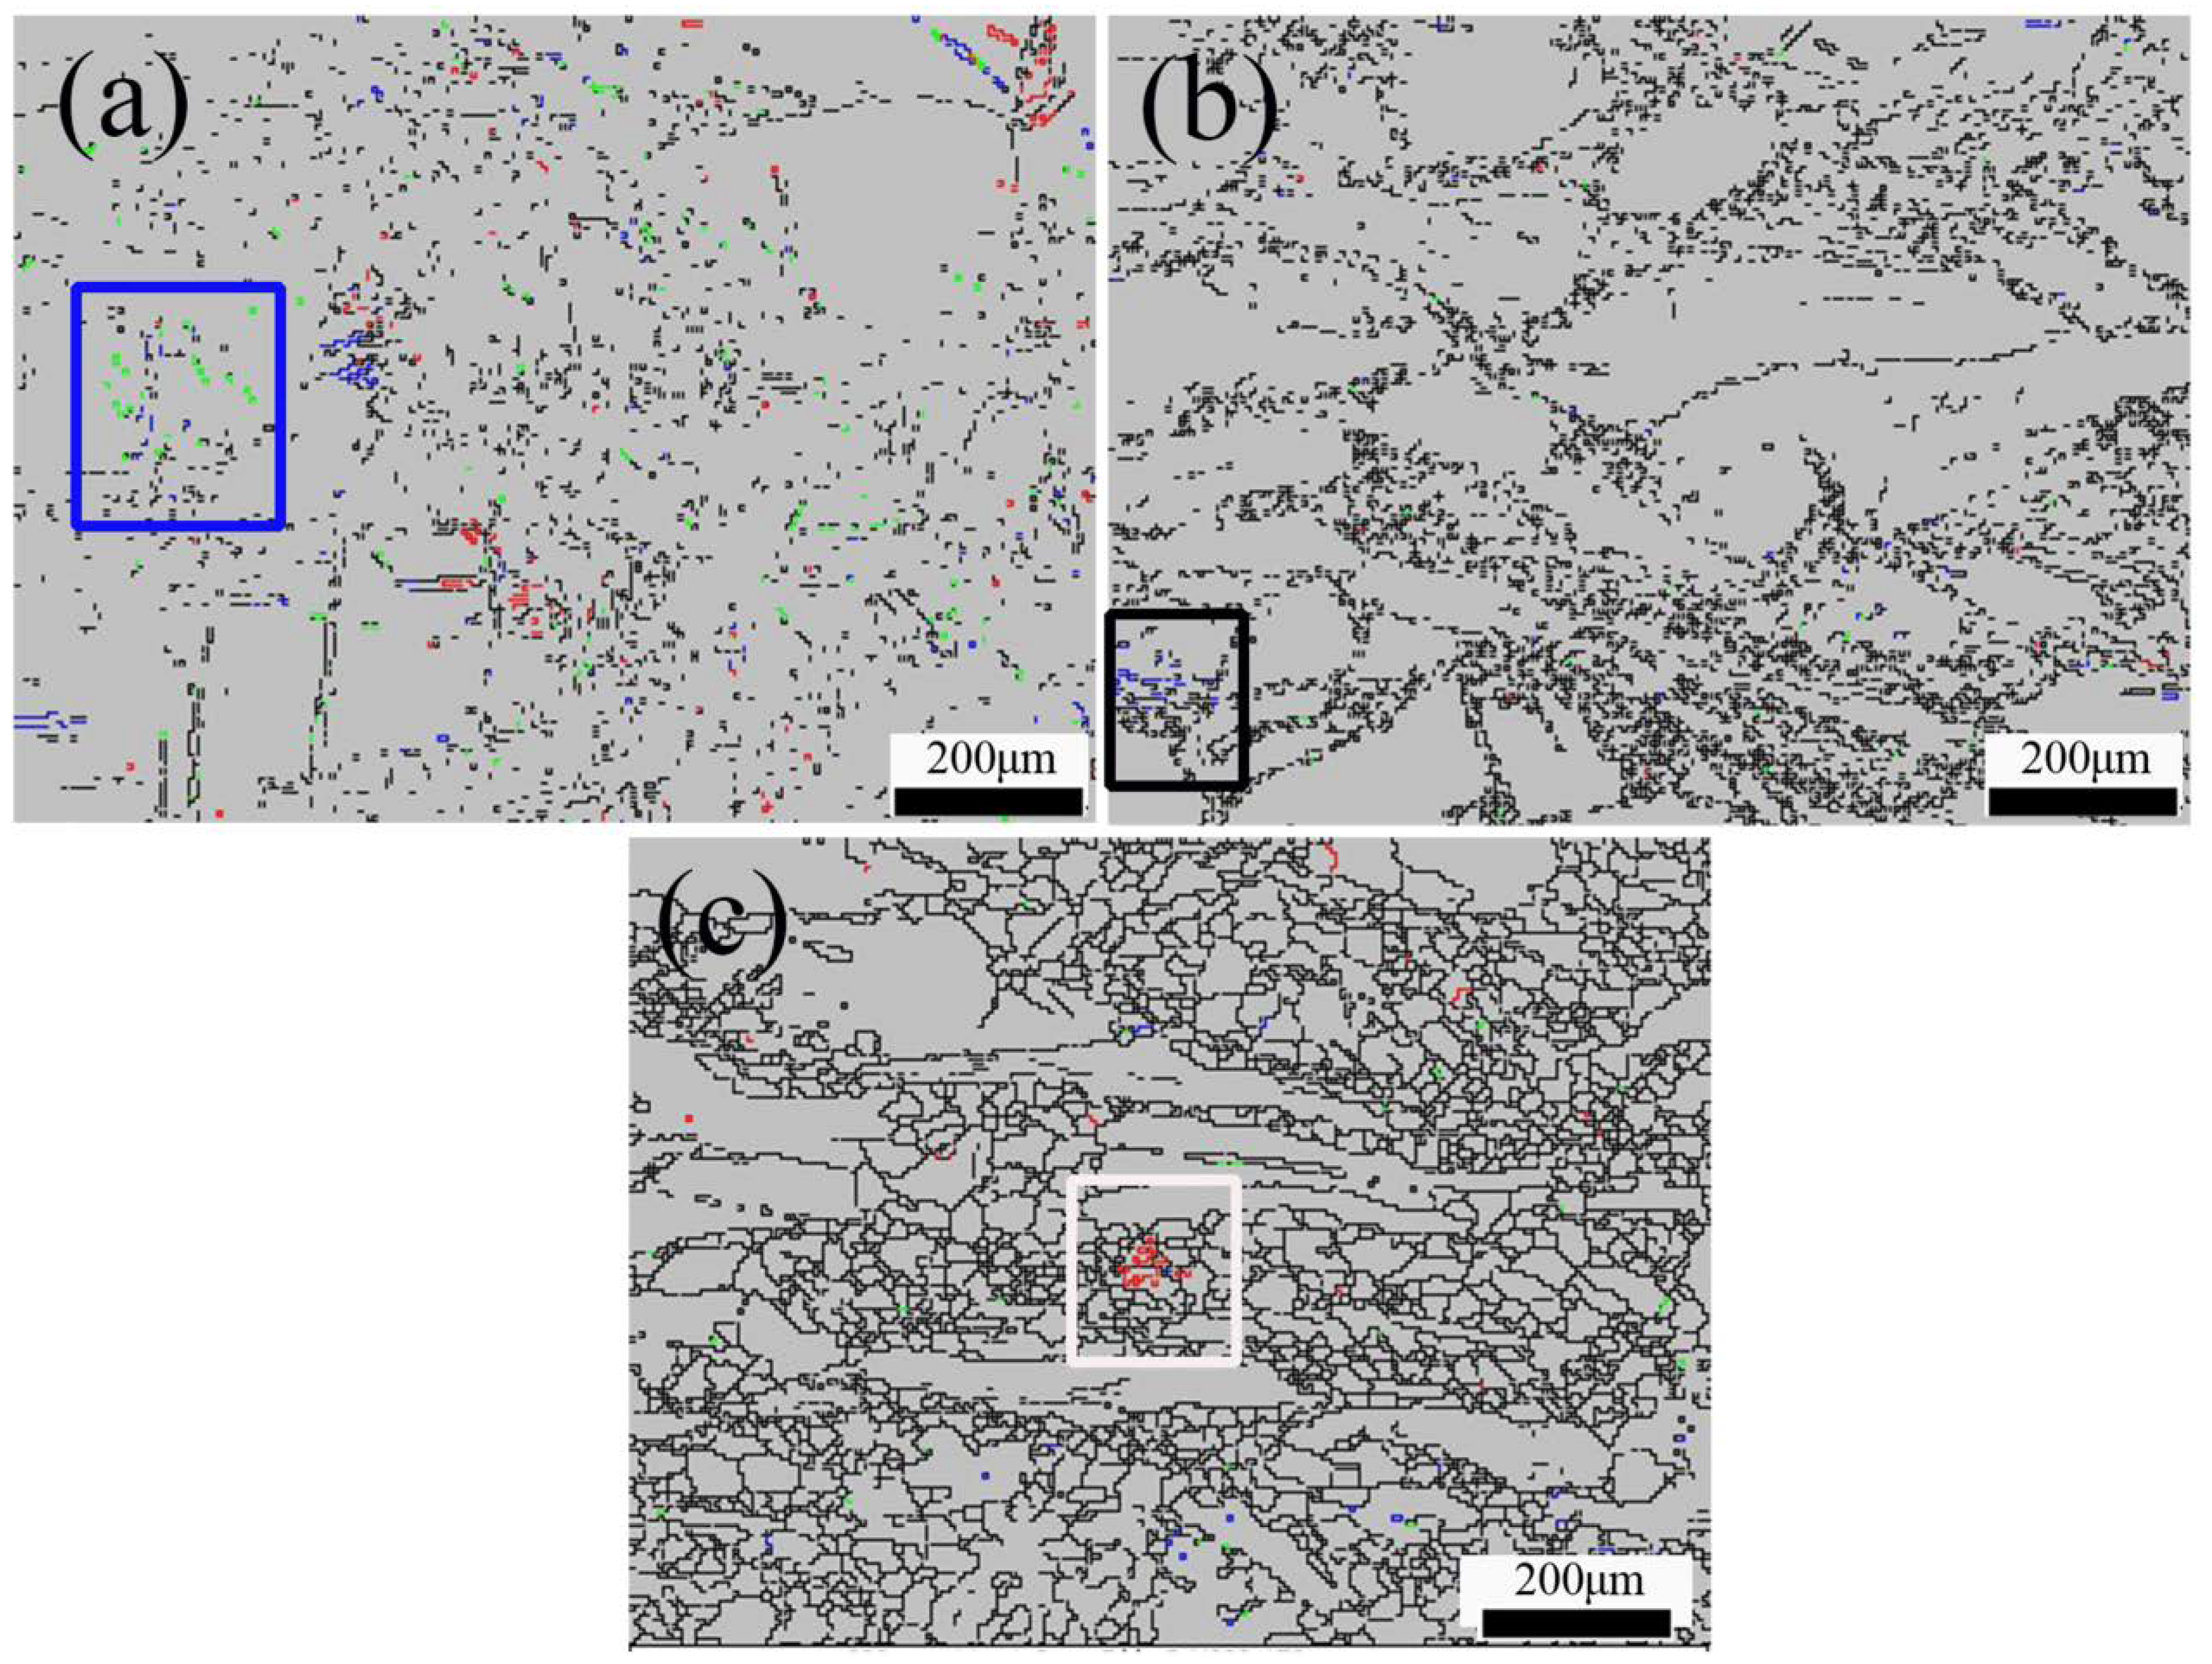
The grain boundary maps of deformed samples are revealed in Figure 13. The red line represents the {102} extension twin, the blue line represents the {101} contraction twin, and the green line represents the {102}–{101} secondary twins, respectively. It can be found in Figure 13a that there are a large number of twins. When the deformation condition is 200 °C and 0.01 s−1, there are more {102}–{101} secondary twins, as indicated by the blue rectangle. When the deformation temperature rises to 300 °C at the same strain rate, there are more {101} contraction twins in the black rectangle. More {102} extension twins appear (at the white rectangle) with a deformation temperature of 400 °C. Generally speaking, there are three processes involved in twinning (nucleation, propagation and growth). In addition, the nucleation of twinning usually generates in the region of stress concentration, such as grain boundaries, and the main twinning type varies with the deformation temperature. At lower temperatures, there are fewer slip systems and more stress concentration in the crystal, which is beneficial to the twin nucleation. The increase in the deformation temperature is conducive to the activation of the slip system but not conducive to the nucleation of twins, so the number of twins decreases [35,46,47]. Some scholars have found that the CRSS required for the nucleation of {102} extension twins is smaller than that of {101} contraction twins [48]. The {101} contraction twin is subjected to elongation strain in the c-axle, which leads to the {101} contraction twin being able to continue producing tensile twinning, thus forming {102}–{101} secondary twins. Because the critical shear stress of the tensile twin is low, the compression twin is easily converted to the secondary twin. In conclusion, twin formation is activated at lower temperatures due to fewer sufficient slip systems and a stronger stress concentration. It can be noticed in Figure 13a, there are a large number of twins and {101} contraction twins and {102}–{101} secondary twins. Some {101} contraction twins are concentrated at grain boundaries, and there are a large number of twins in Figure 13b. A small number of twins and only a smaller number of {102} extension twins are concentrated at grain boundaries, as shown in Figure 13c. Similarly, the strain rate also affects twinning in magnesium alloys, and a higher strain rate is beneficial to twinning formation. The twinning mechanism of magnesium alloys should be clarified in the future.
5. Conclusions
The hot deformation behavior and microstructure evolution of an LA11 alloy were investigated by isothermal compression tests in the temperature range of 200–300 °C and the strain rate range of 0.001–1 s−1. It was found that:
(1) The LA11 alloy exhibits a typical dynamic recrystallization softening under different deformation conditions (200–300 °C, 0.01–1 s−1), which is affected by the temperature and strain rate. The hot deformation activation energy (Q = 116.5 kJ/mol) can be used in the hyperbolic sine function of Z = έ exp (Q/RT) = A[sinh(ασ)]n to describe the peak stress of an LA11 alloy during hot deformation, while the sensitivity coefficient of the strain rate was obtained as 0.134.
(2) The hyperbolic sine function to predict the flow stress of a homogeneous LA11 alloy for the high-temperature deformation is:
(3) The DRX kinetics equation of an LA11 alloy can be described as
(4) Based on microstructure observation, a higher deformation temperature and lower strain rate are beneficial to the occurrence and development of DRX. With the increase in Z values, both the grain size of DRX and the XDRX decrease. On the other hand, the proposed DRX kinetic model can accurately predict the XDRX of an LA11 alloy.
Author Contributions
Conceptualization, X.F.; methodology, R.L. and X.F.; investigation, X.P., X.H., Z.J. and H.R.; resources, R.L. and T.L.; writing—original draft preparation, X.F.; writing—review and editing, R.L. All authors have read and agreed to the published version of the manuscript.
Funding
The authors would like to gratefully acknowledge the financial support of the Natural Science Foundation of Inner Mongolia Autonomous Region (Grant NO. 2019MS05037), Chunhui Program of Ministry of Education of China (Grant NO. CHJH2018), Key Technology Project of Inner Mongolia Autonomous Region (Grant NO. 2021GG0094), Supported by Youth Project of Science and Technology Research program of Chongqing Education Commission of China (KJ201903136636560).
Institutional Review Board Statement
Not applicable.
Informed Consent Statement
Not applicable.
Data Availability Statement
Not applicable.
Conflicts of Interest
The authors declare no conflict of interest.
References
- Lee, W.-S.; Chou, C.-W. Dynamic Deformation Behaviour and Dislocation Substructure of AZ80 Magnesium Alloy over a Wide Range of Temperatures. Eur. Phys. J. Conf. 2018, 183, 03010. [Google Scholar] [CrossRef] [Green Version]
- Quan, G.-Z.; Shi, Y.; Wang, Y.-X.; Kang, B.-S.; Ku, T.-W.; Song, W.-J. Constitutive modeling for the dynamic recrystallization evolution of AZ80 magnesium alloy based on stress–strain data. Mater. Sci. Eng. A 2011, 528, 8051–8059. [Google Scholar] [CrossRef]
- Xu, Y.; Hu, L.; Sun, Y. Deformation behaviour and dynamic recrystallization of AZ61 magnesium alloy. J. Alloys Compd. 2013, 580, 262–269. [Google Scholar] [CrossRef]
- Rao, K.P.; Prasad, Y.V.R.K.; Dzwonczyk, J.; Hort, N.; Kainer, K.U. Hot Deformation Mechanisms in AZ31 Magnesium Alloy Extruded at Different Temperatures: Impact of Texture. Metals 2012, 2, 292–312. [Google Scholar] [CrossRef] [Green Version]
- Chen, F.; Li, K.; Tang, B.; Liu, D.; Zhong, H.; Li, J. Deformation Behavior and Microstructural Evolution of Inconel 625 Superalloy during the Hot Compression Process. Metals 2021, 11, 824. [Google Scholar] [CrossRef]
- Guo, Y.; Xuanyuan, Y.; Lia, C.; Yang, S. Characterization of Hot Deformation Behavior and Processing Maps of Mg-3Sn-2Al-1Zn-5Li Magnesium Alloy. Metals 2019, 9, 1262. [Google Scholar] [CrossRef] [Green Version]
- Zang, M.C.; Niu, H.Z.; Zhang, H.R.; Tan, H.; Zhang, D.L. Cryogenic tensile properties and deformation behavior of a superhigh strength metastable beta titanium alloy Ti–15Mo–2Al. Mater. Sci. Eng. A 2021, 817, 141344. [Google Scholar] [CrossRef]
- Duan, X.; Liu, J.; Li, P.; Liu, B.; Liu, J. Microstructure and texture evolutions in AZ80A magnesium alloy during high-temperature compression. Mater. Res. Express 2021, 8, 016535. [Google Scholar] [CrossRef]
- Li, Y.; Guan, Y.; Zhai, J.; Lin, J. Hot Deformation Behavior of LA43M Mg-Li Alloy via Hot Compression Tests. J. Mater. Eng. Perform. 2019, 28, 7768–7781. [Google Scholar] [CrossRef]
- Ji, Q.; Wang, Y.; Wu, R.; Wei, Z.; Ma, X.; Zhang, J.; Hou, L.; Zhang, M. High specific strength Mg-Li-Zn-Er alloy processed by multi deformation processes. Mater. Charact. 2020, 160, 110135. [Google Scholar] [CrossRef]
- Luo, X.; Liu, J.; Zhang, L.; He, X.; Zhao, K.; An, L. Deformation and failure behavior of heterogeneous Mg/SiC nanocomposite under compression. J. Magnes. Alloy. 2021. [Google Scholar] [CrossRef]
- Hoseini-Athar, M.M.; Mahmudi, R. Effect of Zn content on hot deformation behavior of extruded Mg–Gd–Zn alloys. Mater. Sci. Eng. A 2019, 759, 745–753. [Google Scholar] [CrossRef]
- Ji, H.; Wu, G.; Liu, W.; Sun, J.; Ding, W. Role of extrusion temperature on the microstructure evolution and tensile properties of an ultralight Mg-Li-Zn-Er alloy. J. Alloys Compd. 2021, 876, 160181. [Google Scholar] [CrossRef]
- Zhang, T.; Tokunaga, T.; Ohno, M.; Wu, R.; Zhang, M.; Matsuura, K. Low temperature superplasticity of a dual-phase Mg-Li-Zn alloy processed by a multi-mode deformation process. Mater. Sci. Eng. A 2018, 737, 61–68. [Google Scholar] [CrossRef]
- Shu, D.; Wang, J.; Jiang, M.; Chen, G.; Lu, L.; Zhang, H. Modeling of Dynamic Recrystallization Behavior of As-Extruded AM50 Magnesium Alloy during Hot Compression by a Cellular Automaton Method. Metals 2021, 11, 75. [Google Scholar] [CrossRef]
- Zhang, J.; Wu, C.; Peng, Y.; Xia, X.; Li, J.; Ding, J.; Liu, C.; Chen, X.; Dong, J.; Liu, Y. Hot compression deformation behavior and processing maps of ATI 718Plus superalloy. J. Alloys Compd. 2020, 835, 155195. [Google Scholar] [CrossRef]
- Li, X.; Ren, L.; Le, Q.; Jin, P.; Cheng, C.; Wang, T.; Wang, P.; Zhou, X.; Chen, X.; Li, D. The hot deformation behavior, microstructure evolution and texture types of as-cast Mg–Li alloy. J. Alloys Compd. 2020, 831, 154868. [Google Scholar] [CrossRef]
- Li, G.; Bai, X.; Peng, Q.; Wei, G.; Ma, Z. Hot Deformation Behavior of Ultralight Dual-Phase Mg-6li Alloy: Constitutive Model and Hot Processing Maps. Metals 2021, 11, 911. [Google Scholar] [CrossRef]
- Tang, W.; Liu, S.; Liu, Z.; Kang, S.; Mao, P.; Guo, H. High strain rate compression deformation mechanism and constitutive equation of fine grained Mg–7Gd–5Y–1.2Nd–0.5Zr alloy at different temperatures. Mater. Sci. Eng. A 2020, 780, 139208. [Google Scholar] [CrossRef]
- Mirzadeh, H. Developing constitutive equations of flow stress for hot deformation of AZ31 magnesium alloy under compression, torsion, and tension. Int. J. Mater. Form. 2018, 12, 643–648. [Google Scholar] [CrossRef]
- Xia, X.; Zhang, K.; Ma, M.; Li, T. Constitutive modeling of flow behavior and processing maps of Mg–8.1 Gd–4.5Y–0.3Zr alloy. J. Magnes. Alloy. 2020, 8, 917–928. [Google Scholar] [CrossRef]
- Qing, Z.; Haining, W.; Ying, W.; Ping, L. Hot compression constitutive equation of Mg-5Sm-2Y alloy. J. Phys. Conf. Ser. 2020, 1605, 012164. [Google Scholar] [CrossRef]
- Wang, H.; Ge, J.; Zhang, X.; Chen, C.; Zhou, K. Investigation of the Dynamic Recovery and Recrystallization of Near-β Titanium Alloy Ti-55511 during Two-Pass Hot Compression. Metals 2021, 11, 359. [Google Scholar] [CrossRef]
- Ansari, N.; Tran, B.; Poole, W.J.; Singh, S.S.; Krishnaswamy, H.; Jain, J. High temperature deformation behavior of Mg-5wt.%Y binary alloy: Constitutive analysis and processing maps. Mater. Sci. Eng. A 2020, 777, 139051. [Google Scholar] [CrossRef]
- Sivakesavam, O.; Prasad, Y.V.R.K. Characteristics of superplasticity domain in the processing map forhot working of as-cast Mg–11.5Li–1.5Al alloy. Mater. Sci. Eng. A 2002, 323, 270–277. [Google Scholar] [CrossRef]
- Askariani, S.A.; Pishbin, S.M.H. Hot deformation behavior of Mg-4Li-1Al alloy via hot compression tests. J. Alloys Compd. 2016, 688, 1058–1065. [Google Scholar] [CrossRef]
- Prakash, P.; Toscano, D.; Shaha, S.K.; Wells, M.A.; Jahed, H.; Williams, B.W. Effect of temperature on the hot deformation behavior of AZ80 magnesium alloy. Mater. Sci. Eng. A 2020, 794, 139923. [Google Scholar] [CrossRef]
- Zhang, X.R.; Sun, G.X.; Zai, W.; Jiang, Y.; Jiang, Z.H.; Han, S.; Bi, G.L.; Fang, D.Q.; Lian, J.S. Effects of temperature and strain rate on deformation behaviors of an extruded Mg-5Zn-2.5Y-1Ce-0.5Mn alloy. Mater. Sci. Eng. A 2021, 799, 140141. [Google Scholar] [CrossRef]
- Dong, H.; Pan, F.; Jiang, B.; Zeng, Y. Evolution of microstructure and mechanical properties of a duplex Mg–Li alloy under extrusion with an increasing ratio. Mater. Des. 2014, 57, 121–127. [Google Scholar] [CrossRef]
- Dai, Q.S.; Deng, Y.L.; Tang, J.G.; Wang, Y. Deformation characteristics and strain-compensated constitutive equation for AA5083 aluminum alloy under hot compression. Trans. Nonferr. Met. Soc. China 2019, 29, 2252–2261. [Google Scholar] [CrossRef]
- Hu, L.; Lang, M.; Shi, L.; Li, M.; Zhou, T.; Bao, C.; Yang, M. Study on hot deformation behavior of homogenized Mg-8.5Gd-4.5Y-0.8Zn-0.4Zr alloy using a combination of strain-compensated Arrhenius constitutive model and finite element simulation method. J. Magnes. Alloy. 2021. [Google Scholar] [CrossRef]
- Sellars, C.M.; Whiteman, J.A. Recrystallization and grain growth in hot rolling. Met. Sci. 1979, 13, 187–194. [Google Scholar] [CrossRef]
- Fan, D.G.; Deng, K.K.; Wang, C.J.; Nie, K.B.; Shi, Q.X.; Liang, W. Hot deformation behavior and dynamic recrystallization mechanism of an Mg-5wt.%Zn alloy with trace SiCp addition. J. Mater. Res. Technol. 2021, 10, 422–437. [Google Scholar] [CrossRef]
- Li, X.; Xia, W.; Yan, H.; Chen, J.; Su, B.; Song, M.; Li, Z.; Li, Y. Dynamic recrystallization behaviors of high Mg alloyed Al-Mg alloy during high strain rate rolling deformation. Mater. Sci. Eng. A 2019, 753, 59–69. [Google Scholar] [CrossRef]
- Du, P.; Furusawa, S.; Furushima, T. Continuous observation of twinning and dynamic recrystallization in ZM21 magnesium alloy tubes during locally heated dieless drawing. J. Magnes. Alloy. 2021. [Google Scholar] [CrossRef]
- Yu, H.; Liu, H.; Jiang, B.; Yu, W.; Kang, S.; Cheng, W.; Park, S.; Chen, D.; Yin, F.; Shin, K.; et al. A Comprehensive Study of Dynamic Recrystallization Behavior of Mg Alloy with 3 wt.% Bi Addition. Metals 2021, 11, 838. [Google Scholar] [CrossRef]
- Liu, Y.; Li, Y.; Zhu, Q.; Zhang, H.; Qi, X.; Wang, J.; Jin, P.; Zeng, X. Twin recrystallization mechanisms in a high strain rate compressed Mg-Zn alloy. J. Magnes. Alloy. 2021, 9, 499–504. [Google Scholar] [CrossRef]
- Bai, J.; Yang, P.; Yang, Z.; Sun, Q.; Tan, L. Towards Understanding Relationships between Tension Property and Twinning Boundaries in Magnesium Alloy. Metals 2021, 11, 745. [Google Scholar] [CrossRef]
- Chaudry, U.M.; Kim, T.H.; Kim, Y.S.; Hamad, K.; Ko, Y.G.; Kim, J.-G. Dynamic recrystallization behavior of AZ31-0.5Ca magnesium alloy during warm rolling. Mater. Sci. Eng. A 2019, 762, 138085. [Google Scholar] [CrossRef]
- Gu, B.; Chekhonin, P.; Xin, S.W.; Liu, G.Q.; Ma, C.L.; Zhou, L.; Skrotzki, W. Effect of temperature and strain rate on the deformation behavior of Ti5321 during hot-compression. J. Alloys Compd. 2021, 876, 159938. [Google Scholar] [CrossRef]
- Che, B.; Lu, L.; Kang, W.; Luo, J.; Ma, M.; Liu, L. Hot deformation behavior and processing map of a new type Mg-6Zn-1Gd-1Er alloy. J. Alloys Compd. 2021, 862, 158700. [Google Scholar] [CrossRef]
- Detrois, M.; Antonov, S.; Tin, S.; Jablonski, P.D.; Hawk, J.A. Hot deformation behavior and flow stress modeling of a Ni-based superalloy. Mater. Charact. 2019, 157, 109915. [Google Scholar] [CrossRef]
- Liu, F.; Ma, J.; Peng, L.; Huang, G.; Zhang, W.; Xie, H.; Mi, X. Hot Deformation Behavior and Microstructure Evolution of Cu-Ni-Co-Si Alloys. Materials 2020, 13, 2042. [Google Scholar] [CrossRef]
- Cao, L.; Liao, B.; Wu, X.; Li, C.; Huang, G.; Cheng, N. Hot Deformation Behavior and Microstructure Characterization of an Al-Cu-Li-Mg-Ag Alloy. Crystals 2020, 10, 416. [Google Scholar] [CrossRef]
- Zhang, F.; Liu, Z.; Yang, M.; Su, G.; Zhao, R.; Mao, P.; Wang, F.; Sun, S. Microscopic mechanism exploration and constitutive equation construction for compression characteristics of AZ31-TD magnesium alloy at high strain rate. Mater. Sci. Eng. A 2020, 771, 138571. [Google Scholar] [CrossRef]
- Russell, W.D.; Bratton, N.R.; Paudel, Y.; Moser, R.D.; McClelland, Z.B.; Barrett, C.D.; Oppedal, A.L.; Whittington, W.R.; Rhee, H.; Mujahid, S.; et al. In Situ Characterization of the Effect of Twin-Microstructure Interactions on {1 0 1 2} Tension and {1 0 1 1} Contraction Twin Nucleation, Growth and Damage in Magnesium. Metals 2020, 10, 1403. [Google Scholar] [CrossRef]
- Qin, F.; Li, Y.; Zheng, J. The Activation and Evolution of Twinning during Bending of Friction Stir Welded AZ31 Magnesium Alloys. Metals 2020, 10, 139. [Google Scholar] [CrossRef] [Green Version]
- Zhang, K.; Song, H.Y.; Deng, Q.; Li, Y.L. Interaction mechanism between twin boundary and crystalline/amorphous interface in dual-phase Mg alloys. J. Non-Cryst. Solids 2020, 534, 119954. [Google Scholar] [CrossRef]
Figure 1.
(a) The microstructure and (b) XRD patterns of the LA11 alloy.

Figure 2.
True stress–true strain curves of LA11 alloy under different deformation conditions: (a) έ = 0.01 s−1, (b) έ = 0. 1 s−1, (c) έ = 1 s−1; (d) a schematic sketch of isothermal compression behavior.
Figure 2.
True stress–true strain curves of LA11 alloy under different deformation conditions: (a) έ = 0.01 s−1, (b) έ = 0. 1 s−1, (c) έ = 1 s−1; (d) a schematic sketch of isothermal compression behavior.

Figure 3.
The linear relationship fitting at peak stress: (a) lnέ − lnσ and (b) lnέ − σ.

Figure 4.
The linear relationship fitting at peak stress: (a) ln[sinh (ασ)] − 1/T and (b) ln έ − ln[sinh (ασ)].
Figure 4.
The linear relationship fitting at peak stress: (a) ln[sinh (ασ)] − 1/T and (b) ln έ − ln[sinh (ασ)].

Figure 5.
The relationship between lnZ and ln[ sinh (ασ)].

Figure 6.
(a) Peak stress at different strain rates and deformation temperatures. (b) The values of lnZ under different deformation conditions.
Figure 6.
(a) Peak stress at different strain rates and deformation temperatures. (b) The values of lnZ under different deformation conditions.

Figure 7.
Typical θ–σ plot obtained by deforming at the temperature of 300 °C and the strain rate of 0.01 s−1.
Figure 7.
Typical θ–σ plot obtained by deforming at the temperature of 300 °C and the strain rate of 0.01 s−1.

Figure 8.
The characteristic points of the flow curves as a function of Z.

Figure 9.
Predicted volume fraction of DRX obtained at different temperatures and strain rates.

Figure 10.
Microstructures at the strain rate of 0.01 s−1, the deformation rate of 60% and various temperatures of (a) 200 °C, (b) 300 °C and (c) 400 °C.
Figure 10.
Microstructures at the strain rate of 0.01 s−1, the deformation rate of 60% and various temperatures of (a) 200 °C, (b) 300 °C and (c) 400 °C.

Figure 11.
Microstructures at the temperature of 400 °C, the deformation rate of 60%, and various strain rates of (a) 0.01 s−1, (b) 0.1 s−1 and (c) 1 s−1..
Figure 11.
Microstructures at the temperature of 400 °C, the deformation rate of 60%, and various strain rates of (a) 0.01 s−1, (b) 0.1 s−1 and (c) 1 s−1..

Figure 12.
Inverse pole figure maps (a,c,e,g) and grain boundary maps (b,d,f,h) of the LA11 alloy under various deformations: (a,b) 200 °C/0.01 s−1, (c,d) 300 °C/0.01 s−1, (e,f) 400 °C/0.01 s−1 and (g,h) 400 °C/0.1 s−1.
Figure 12.
Inverse pole figure maps (a,c,e,g) and grain boundary maps (b,d,f,h) of the LA11 alloy under various deformations: (a,b) 200 °C/0.01 s−1, (c,d) 300 °C/0.01 s−1, (e,f) 400 °C/0.01 s−1 and (g,h) 400 °C/0.1 s−1.

Figure 13.
The grain boundary maps of samples deformed at (a) 200 °C/0.01 s−1, (b) 300 °C/0.01 s−1 and (c) 400 °C/0.01 s−1.
Figure 13.
The grain boundary maps of samples deformed at (a) 200 °C/0.01 s−1, (b) 300 °C/0.01 s−1 and (c) 400 °C/0.01 s−1.

Publisher’s Note: MDPI stays neutral with regard to jurisdictional claims in published maps and institutional affiliations. |
© 2021 by the authors. Licensee MDPI, Basel, Switzerland. This article is an open access article distributed under the terms and conditions of the Creative Commons Attribution (CC BY) license (https://creativecommons.org/licenses/by/4.0/).
Share and Cite
MDPI and ACS Style
Feng, X.; Pang, X.; He, X.; Li, R.; Jin, Z.; Ren, H.; Liu, T. Deformation Behavior and Dynamic Recrystallization of Mg-1Li-1Al Alloy. Metals 2021, 11, 1696. https://doi.org/10.3390/met11111696
AMA Style
Feng X, Pang X, He X, Li R, Jin Z, Ren H, Liu T. Deformation Behavior and Dynamic Recrystallization of Mg-1Li-1Al Alloy. Metals. 2021; 11(11):1696. https://doi.org/10.3390/met11111696
Chicago/Turabian StyleFeng, Xiaoyan, Xue Pang, Xu He, Ruihong Li, Zili Jin, Huiping Ren, and Tingting Liu. 2021. "Deformation Behavior and Dynamic Recrystallization of Mg-1Li-1Al Alloy" Metals 11, no. 11: 1696. https://doi.org/10.3390/met11111696
Note that from the first issue of 2016, this journal uses article numbers instead of page numbers. See further details here.