
Countermovement Jump in Female Sprinters: Kinetic Parameters and Asymmetry
by
 , ,
, ,
Nikola Prvulović
1,* ,
,
Milan Čoh
2,
Dražen Čular
3,
Mario Tomljanović
3,
Goran Sporiš
4 and
Suzana Žilič Fišer
5 1
Faculty of Sport and Physical Education, University of Niš, 18000 Niš, Serbia
2
Faculty of Sport, University of Ljubljana, Gortanova Ulica 22, 1000 Ljubljana, Slovenia
3
Faculty of Kinesiology, University of Split, Ruđera Boškovića 31, 21000 Split, Croatia
4
Faculty of Kinesiology, University of Zagreb, Horvaćanski Zavoj 15, 10110 Zagreb, Croatia
5
Institute of Media Communications, Faculty of Electrical Engineering and Computer Science, University of Maribor, Koroška Cesta 46, 2000 Maribor, Slovenia
*
Author to whom correspondence should be addressed.
Symmetry 2022, 14(6), 1130; https://doi.org/10.3390/sym14061130
Submission received: 29 April 2022
/
Revised: 18 May 2022
/
Accepted: 27 May 2022
/
Published: 31 May 2022
Abstract
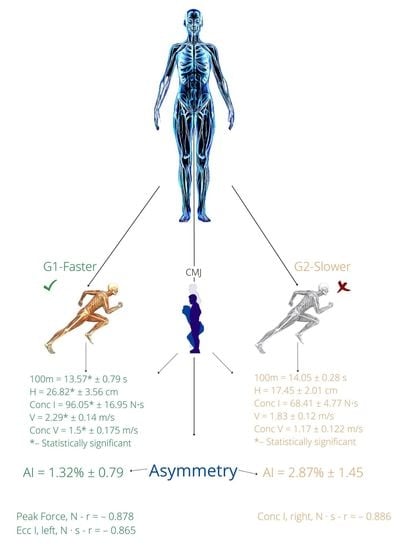
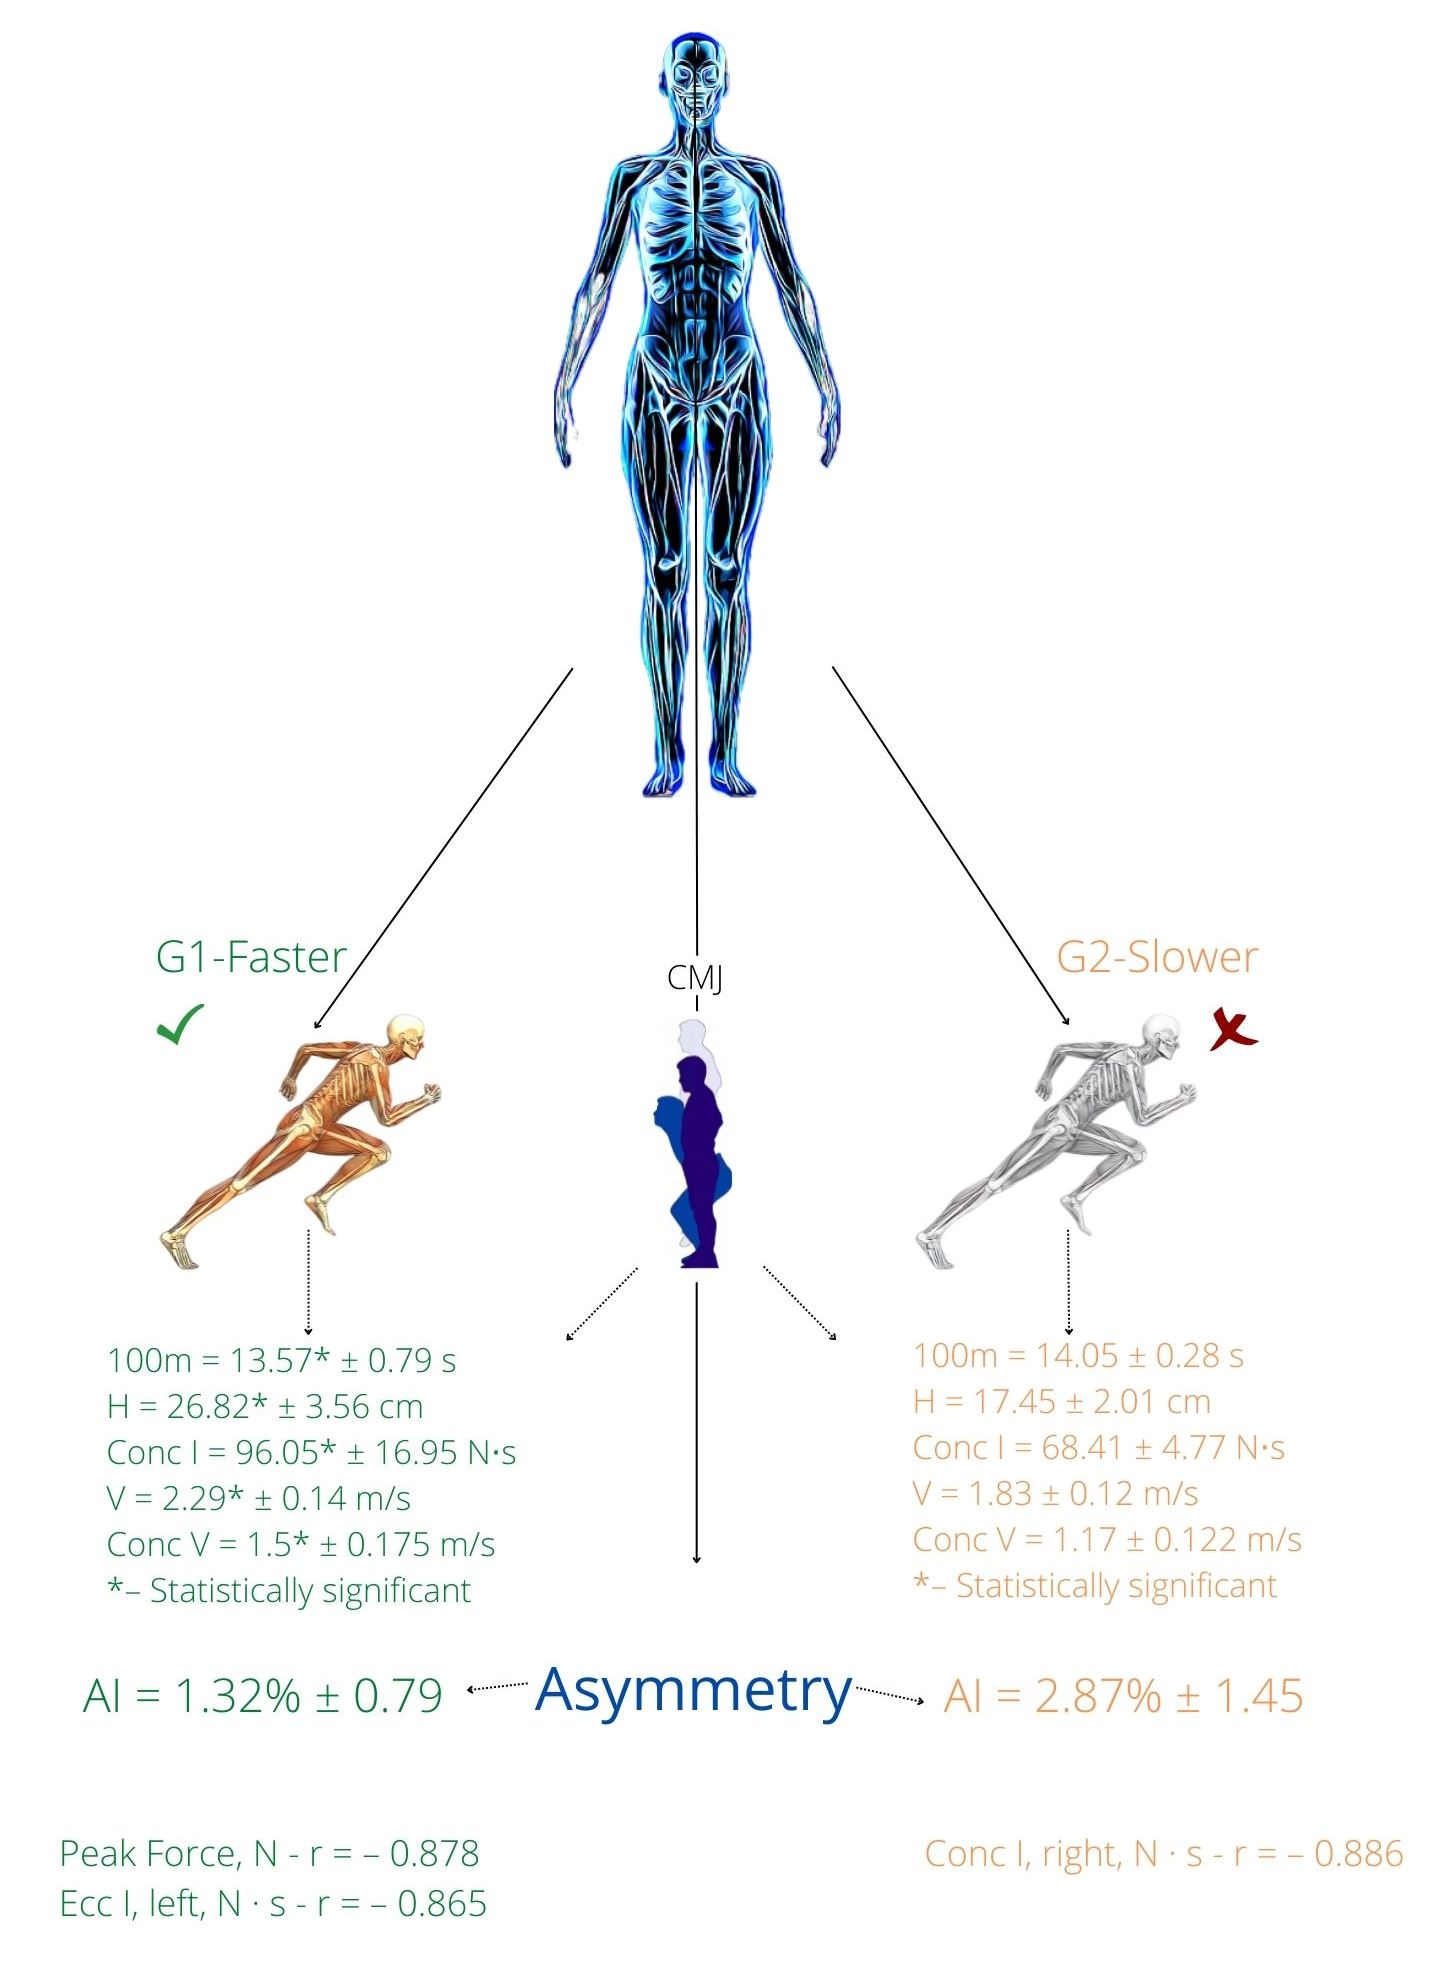
:Analyzing asymmetry from biomechanical parameters of the lower extremities has become a standard practice for accurate assessment of athletic performance, injury prevention, and rehabilitation. The aims of this study were (1) to determine differences between explosive strength and asymmetry of the lower extremities using kinetic parameters of the CMJ jump test in young female athletics, and (2) to investigate correlation between speed and asymmetry, as speed and kinetic parameters. The two groups of nine female sprinters (mean ± SD; G1-age 15.6 ± 1.34 years, height 170.1 ± 0.57 cm, body mass 62.54 ± 7.73 kg, and BMI 21.6 ± 2.05; G2-age 16.2 ± 1.3 years, height 168.4 ± 0.61 cm, body mass 57.69 ± 3.12 kg, and BMI 20.37 ± 1.38) performed the CMJ test without using an arm swing, as well as a 100 m test. Two tensiometric platforms were used for the kinetic parameters and asymmetry. Asymmetry was calculated by an AI equation, and the values of the takeoff velocities and jump height parameters were obtained by integral formula and the trapezoidal rule of impulse-momentum methods. The results show differences in four kinetic parameters: height (G1- 26.82 ± 3.56 cm, vs. G2- 17.45 ± 2.01 cm), concentric impulse, (G1- 96.05 ± 16.95 N⋅s, vs. G2- 68.41 ± 4.77 N⋅s), takeoff velocity, (G1- 2.29 ± 0.14 m/s, vs. 1.83 ± 0.12 m/s), and concentric velocity, m/s (G1- 1.5 ± 0.175 m/s, vs. 1.17 ± 0.122 m/s), as well as a negative strong and very strong correlation between asymmetry and kinetic parameters for three parameters: Peak Force (G1- r = −0.878, and all subjects r = −0.633), Eccentric Impulse of left leg (G1- r = −0.865) and Concentric Impulse of right leg (G2- r = −0.878), (p <.05). The younger sprinters did not show the principle of muscle activation in the form of a longer preparatory phase of contact time, eccentric and concentric phase, as well as a force impulse that is optimal. There was no correlation between asymmetry and sprint performance.
1. Introduction
Sprint running is a complex cyclic movement defined by the frequency and length of steps [1]. Both parameters are interdependent, and each is conditioned by central processes of movement regulation, biomotor abilities, energy processes, and morphological characteristics [2]. Several authors have stated that step frequency is more important than length of the stride to achieve maximum running speed [3,4,5,6]. On the other hand, several factors affect both parameters, such as muscle structure [7], running technique [8], speed strength, and musculoskeletal locomotor system elasticity [2]. Sprint running as a stereotype of movement consists of repeating strides in a unit of time. The stride length depends on body height and the length of the legs, as well as on the force developed by the extensor muscles of the hip, knee, and ankle in the contact phase. Execution of the contact phase is one of the most important generators of running speed efficiency [2]. The contact phase must be as short as possible, about 90-100 ms [9], with an optimal ratio between the braking phase and the drive phase. During the shortest contact time and the eccentric-concentric cycle, elastic energy of the competitors transforms into kinetic energy [10]. The correlation between the increase in muscle density and the decrease in contact time during a sprint leads to better results [11]. Thus, a study of kinetic parameters can create an image of the current state of the participants and improve their training programs as well as their results. The frequency of steps depends on the functioning of the central nervous system and is largely genetically determined [10]. An obvious observation confirmed by research [12], showed a negative correlation between the length and frequency of steps.
Sprint running consists of fast cyclic movements in the form of horizontal jumps-steps (strides) with a vertical lift of the body. Various vertical jump tests have performed in order to test athletes’ abilities [10]. There are several tests used to measure strength, the most commonly used one being the counter movement jump test (CMJ) with an arm swing, the CMJ with fixed arms, and the squat jump (SJ) [13]. This measurement with CMJ offers very high reliability in retesting [14], which is crucial for further research [15]. It should be pointed out that several studies have confirmed the correlation between the CMJ and performance in sprinting disciplines and explosive power sports [10,16,17,18,19]. Since the multi-jointed CMJ consists of an eccentric and concentric phrase, in cyclic sports we also find the same pattern of muscle contraction. Still, this association differs due to the takeoff on both legs required for the CMJ, while during sprinting there are phases of contact of one leg with the surface; therefore, the asymmetry and difference in the explosive power of the legs has multiple significance [10].
Assessment and monitoring of biomechanical parameters of the lower extremities from the aspect of asymmetries has become a common practice among researchers, and is used for accurate assessment of athletic performance, injury prevention, and rehabilitation [20]. More precisely, larger difference in explosiveness and asymmetry of the lower extremities is associated with a decrease in the jump height and running speed, as well as a decrease in the change direction speed [21]. Similarly, asymmetry in the pattern of movement is presented as a factor in increasing the risk of injury. Measuring asymmetry and explosiveness is also useful for assessing and directing an athlete returning to the training process after a rehabilitation process [22]. Asymmetry can be explained as the continuity of overload on one side of the body or muscle imbalance that occurs if it is not adequately compensated. The strength of the symmetry index over the lower extremities is defined as the inability to produce force and contraction equal to the m. quadriceps femoris and the left and right knee tendons [23]. Bilateral force deficit refers to the phenomenon that the maximum generated force in simultaneous bilateral muscle contractions is less than the sum of forces generated unilaterally [13]. In most athletics disciplines, the basic criterion of success is the development of the greatest possible reactive force in the shortest possible contact time with the ground or during the contact phase [24]. It is also important to maintain a proportional balance, i.e., symmetries of explosive power of the lower extremities in disciplines that have cyclic movements, and with acyclic movements (in throwing and jumping disciplines), a certain asymmetry is visible [10]. A small number of researchers have studied the association between asymmetry and sprinting performance among track and field athletes [25,26], even though other studies exist which include different types of athletes [27]; all of the results, with the exception of [28,29], showed no negative association.
The aim of the study was to establish the differences between explosive power and lower limb asymmetry using kinetic parameters with CMJ without an arm swing test in young sprinters, and to determine whether there is a relationship between velocity and asymmetries as well as velocity and kinetic parameters.
2. Materials and Methods
2.1. Participants
The total sample of participants numbered 18 female sprinters from Serbia. The age of the participants ranged from 15 to 17 years. All of them were sprinters in the 100 m discipline, and they trained according to the same training program. Participants trained at a moderate to high intensity before start of this study. The study was fully approved by a University of Niš, Faculty of Sport and Physical education Ethics Committee guidelines; ethical approval number: 04-227/2; approval date of Ethic Committee approval: 24 February 2022 and the protocol was conducted according to the Declaration of Helsinki [30]. The inclusion criterion included only female sprinters and aged 15 to 17 years who had been training following an athletic program for at least four years and had been physically healthy without injury for six months prior to the test. All the participants started a training cycle according to the program that aimed to raise general physical fitness, lasting for three months, with a weekly training session frequency of five days for a period of 90 min. The participants’ body height and weight were measured using an In Body 770 digital scale and a meter. The participants were further divided into groups based on their sprint test results; each group had an equal number of sprinters (n = 9).
2.2. Experimental Design and Measurement Procedures
For the purposes of testing this transversal study, the “Čair” sports hall in Niš was used in 2022. Asymmetry and explosive strength of the lower extremities were tested using a vertical CMJ jump test without arm swings. The temperature of the hall was measured with a thermometer and was 22 °C. The warm-up and exercise, which lasted 20 min, was followed by a careful demonstration of the CMJ without a swing of the hands by one researcher. All participants performed the initial warm-up and test jumps in running shoes. Each participant performed three jumps with 20 s breaks between jumps. Group 1 finished the first set of three jumps and after that Group 2 subjects started their set of jumps. Time differences between two groups were 10 min. Then, they had a sprint test on the tartan track outside; the air temperature was measured with a thermometer and was 20 C. During a 10 min additional warm-up, the installed Witty photocells were checked. The check was followed by a sprint test from a high start at a sign given by the researcher. Random groups of nine subjects ran the sprint test one after the other at 10 min intervals. The air temperature was measured with a thermometer and was 20 C. The whole testing period lasted 55 min. Researchers and the other participants provided equal support to each sprinter in order to achieve the best possible results.
2.3. Measurement of the CMJ and Asymmetry Kinetic Variables
Two Vernier tensiometer plates were used to collect the kinetic variables of the lower extremities, the eccentric and concentric phases of the individual limb jump and the total force of both legs. A “Logger Pro” program was used to process the obtained kinetic data of lower extremity explosive strength. The collected raw data were processed to obtain the results of the kinetic parameters of explosive strength of the lower extremities. Data on the asymmetry of explosive strength of the lower extremities were obtained using the AI formula AI = , [31]. Based on the momentum-momentum method using the integral formula and the trapezoidal rule = , (t0 = 0 s; Fgrf—ground reaction force; —takeoff velocity; —body mass), the participants’ initial jump velocity values were obtained [32]. With these initial velocity data, the jump heights were obtained using the formula: H = , (H—jump height) [33]. The absolute and relative values of the maximum force Peak F (N and N·kg−1) are shown. The 100 m sprint test was measured using Witty photocells.
2.4. Statistical Analysis
Data for the analysis and assessment of the asymmetry and explosive strength of the lower extremities were performed using the SPSS statistical analysis program (IBM Corp. Released 2010. IBM SPSS Statistics for Windows, Version 19.0. Armonk, NY, USA: IBM Corp.). Descriptive analysis was used to distribute all the data of mean values and standard deviations of the participants by groups. After that, the asymmetry coefficient and the mean value by groups were determined. Verification of the normality of the distribution was performed using the Kolmogorov-Smirnov test and then, based on the results, parametric analysis was used. An independent-samples t-test was used to determine the difference between the groups of the basic characteristics, the 100 m sprint test results, kinetic parameters of CMJ and asymmetry. Pearson’s correlation was performed to examine the relationship between the kinetic parameters of the vertical CMJ jump test without arm swings, asymmetry, and the 100 m sprint results. A significance level p < 0.05 was used for statistical significance of differences in the results between groups and correlations.
3. Results
The Kolmogorov-Smirnov test showed that the assumption of distribution normality was not violated for all measured variables (K-S, ps < 0.054 to < 0.96). The basic characteristics and the 100 m sprint test results of the participants are presented by group in Table 1.
Table 2 shows the results of mean values and standard deviations in both groups of participants, where the kinetic values of the results are shown separately for the left, right, and both legs together. The results show that there was a statistically significant difference between the groups for four parameters: Height (G1- 26.82 ± 3.56 cm, compared to G2- 17.45 ± 2.01 cm, p = 0.001), Concentric impulses, (G1- 96.05 ± 16.95 N⋅s, compared to G2- 68.41 ± 4.77 N⋅s, p = 0.019), Takeoff velocity, (G1- 2.29 ± 0.14 m/s, vs. 1.83 ± 0.12 m/s, p = 0.001), and Concentric velocity, m/s (G1- 1.5 ± 0.175 m/s, compared to 1.17 ± 0.122 m/s, p = 0.01) for both legs. While significant differences between groups for individual leg parameters were in favor of the left leg for Height (G1-diff, + 4.2%, and G2-diff, 14.2%, p = 0.015), Concentric impulses, (G1-diff, 0.92%, and G2-diff, 3.6%, p = 0.024), and Takeoff velocity, (G1- diff, + 1.7%, and G2- diff, 7.1%, p = 0.009), better results were determined for the right leg for Concentric velocity, m/s (G1- diff, 0.01%, and G2- diff, 2.5%, p = 0.011). Worth mentioning is that differences in asymmetry was not statistically significant (1.32% ± 0.79 vs. 2.87% ± 1.45), by p = 0.59, indicating that further research should include a larger number of subjects.
Table 3 shows values of the Pearson correlation between the kinetic parameters of the CMJ jump and the 100 m sprint test. Statistically significant correlation results for the left, right and both legs are presented. The results show a negative strong and very strong correlation for five parameters: Height, Total Impulse, Concentric Impulse, Concentric Velocity and Takeoff Velocity, (p < 0.05).
Table 4 shows the values of the Pearson correlation between asymmetry and the kinetic parameters for each group and all subjects. Statistically significant correlation results for Group 1, Group 2 and all subjects are presented. The results show a negative strong and very strong correlation for three parameters: for Peak Force (G1- r = −0.878, and All subjects r = −0.633), Eccentric Impulse of left leg (G1- r = −0.865) and Concentric Impulse of right leg (G2- r = −0.878), (p < 0.05).
4. Discussion
The aim of the study was to establish the difference between explosive strength and asymmetry of the lower extremities using kinetic parameters of the CMJ without arm swings between two groups of young sprinters, as well as to determine the correlation with the results of the sprint test.
Depending on muscle tone, physical fitness, and the age of the competitors, the results of the CMJ contractions were 40 ms slower when compared to contractions during various sprint disciplines, which ranged from 8.5 ms to 10–12 ms [16,19]. Authors in study [19], obtained results for a jump performance time of 39 ms for elite sprinters and 35 ms among semi-elite sprinters, but no statistically significant differences between the groups were found, while the results in this study present an expectedly greater value due to lower takeoff height, the age of the participants, as well as sprinting scores: 55 ms for the stronger and 65 ms for the weaker group, but again with no statistical significance. Takeoff height showed a significant difference of 8 cm between (the stronger group 65.39 ± 6.03 cm and the weaker group 57.55 ± 2.03 cm, p < 0.05) the left leg impulse during the concentric phrase in favor of the stronger group (123.91 ± 11.82 N·s, compared to 108.06 ± 8.32 N·s, p < 0.05), and initial speed (for the stronger 3.23 ± 0.15 m/s and 2.94 ± 0.09 m/s, p < 0.05 for the weaker group) [19]. However, the results of this study confirm the values for takeoff height, with a slightly greater difference of 9.4 cm, but a lower absolute value of takeoff (for the stronger 26.82 ± 3.56 cm and 17.45 ± 2.01 cm, p < 0.05 for the weaker group), initial speed of both legs (2.29 ± 0.14 m/s, compared to 1.83 ± 0.12 m/s), as well as for individual right and left legs. In addition, the results match those for the Concentric impulse, (G1- left leg, 96.93 ± 17.21 N⋅s, compared to the right, 95.16 ± 17.51 N⋅s, and G2- left leg, 70.88 ± 9.28 N⋅s, compared to the right, 65.94 ± 11.04 N⋅s, p < 0.05), with lower absolute values. After this the study was expanded, statistically significant differences were obtained for both legs (96.05 ± 16.95 N⋅s, and for the weaker group 68.41 ± 4.77 N⋅s, p < 0.05). Maximum force and duration of the eccentric phrase show better relative values, but no statistically significant difference between the groups was determined in this study, where the absolute values of maximum force were also presented.
A study of 20 junior multi-discipline competitors (11 male and 9 female) aged 16 to 18 by [16], showed greater values for the jump 41.1 ± 6.6 cm and also better values for the duration of the eccentric and concentric phase (23 ± 2 ms), unlike those obtained for the stronger group and the weaker group (30 ± 2 ms and 35 ± 5 ms, respectively), while the maximum force had a value of 2603 ± 575 N, as opposed to 1796.14 ± 291.75 N, compared to 1494.71 ± 218.65 N for the weaker group. It was expected that the total impulse would be greater (150.1 ± 34.3 N), compared to the stronger (138.09 ± 24.89 N) and the weaker group (123.49 ± 19.79 N). A correlation was also obtained for CMJ values, the test of sprints of various lengths r = −0.77, r = 0.001, and maximum force r = −0.79, r = 0.03. Similar results were obtained in the study carried out by [17], which included a smaller number of 17 female athletes who were a little older, aged 17.6 ± 2.2, and included data on the 100 m test with average values (12.90 ± 0.61 s), better average values for height of takeoff (33.8 ± 3.8 cm), as well as contact time (185 ± 18 ms). However, it should be mentioned that the researchers did not use tensiometric platforms but other means of measuring contact time (a kinematic analysis of the moment the foot leaves the surface, as well as the takeoff height based on the jump flight time). The different means which are found in the literature describe the problem of determining the precise moment for calculating the beginning of the jump, which is why there are differences in the absolute values of the duration of the jump and take off speed [34]. A negative correlation was noted between take off height and the results of the 100 m sprint (r = −0.55; p = 0.05), unlike the somewhat weaker results noted in this study, where the 100 m sprint time for the stronger group was 13.57 ± 0.79 s, take off height was 26.82 ± 3.56 cm, and there were higher correlation values r = −0.875; p = 0.001, for both legs. An expanded analysis indicates a negative correlation as well (r = −0.894; p = 0.001) for the right leg, and for the left leg (r = −0.801; p = 0.005).
Study [18], which included 10 older 20 ± 3 years male sprinters competing in the 100 m sprint had better results for takeoff height (57.2 ± 7.9 cm) and a higher correlation with the times on the sprint test (r = −0.70; p = 0.011). Study [19], outlined a pattern for the longer preparation phase during contact time and the eccentric and concentric phrase among elite sprinters. The association between force and power was such that greater speed creates a slower reaction contact force. It was also concluded that takeoff height does not depend solely on the force but also on the time of force production, that is, the force impulse. The results of this study also indicate a difference in the values of the concentric times which are negligibly longer for the stronger group, as well as significant differences during the concentric impulse of the left leg; however, the duration of the eccentric phase and the total contact time was significantly shorter. Concentric and eccentric impulses did not show significant differences, so the results do not show the optimum use of the muscle chain following the principle of the proximal distal activation during the CMJ. This principle is important for the stride phase in sprint disciplines [19]. The reason for is the level of physical fitness and age of the participants. From kinetic parameters for the precise determination of the explosiveness of both one leg and the other leg we obtained data on asymmetry, which can assist in injury prevention, a faster rehabilitation cycle, and faster training cycle planning [21].
In existing research, asymmetry is linked to certain motor tests, and is a feature present in poorly trained athletes [35]. It impacts asymmetry the level of training and the level of physical fitness, since there is lower asymmetry among stronger athletes [36]. This was corroborated by our research result since the group with better sprint results had a smaller asymmetry index (1.32 ± 0.79%) compared to the weaker group (2.87 ± 1.45%). A decrease in asymmetry was seen in the training cycle of poorly trained athletes with a bilateral [37], and unilateral type of program [38] (even though the result was noted in a case study), as well as in better results on jump tests [39].
That asymmetry has a negative impact on the results of explosiveness on jump tests was noted in the studies of [28,29] who studied 36 and 167 adult participants involved in various sports, respectively. Interestingly, [40], showed that the classification of asymmetry by group did not indicate a difference in takeoff height, the force or strength of the CMJ (takeoff height decreased only by 9 cm), which was linked to the group with a 10% asymmetry in the strength of the CMJ, even though the study was carried out on a small number of participants (nine). A contradictory finding was noted in the group with an asymmetry greater than 15% for the CMJ force (n = 7; 38.8 ± 7.9 cm), which showed the greatest value for takeoff height compared to the group with 0 to 5% asymmetry in force for the CMJ (n = 88; 36.1 ± 8.5 cm). If we compare our results of both groups that have asymmetry index from 1 to 3%, range, which falls to category from 0 to 5%, the better group had a 26.82 * ± 3.56 cm jump height and weaker group had a 17.45 ± 2.01 cm jump height. Lower values were due to subject age, gender and sport level.
The asymmetry results in this study are not statistically significant (1.32 ± 0.79%) when compared to the weaker group (2.87 ± 1.45%), (p = 0.59) and are not in agreement with existing studies [37] in which symmetry index was obtained for the stronger group of participants (1.9 ± 1.1%) and significantly lower than the one for the weaker group (3.9 ± 1.8%; p = 0.007), even though the testing was carried out on older recreational participants. In addition, a decrease in asymmetry was noted with increase in isokinetic power and the training process for the weaker group, which also confirms the association between level of training and asymmetry among athletes [37]. Based on the results of this study, it can be seen that in the stronger group there was a greater force in the flexors of the lower extremities, indicated by the imbalance in the eccentric impulses of the left leg in relation to the right leg, while in the weaker group there is a lack of force in the extensors lower extremities that directly affects the asymmetry of the limbs. This is shown by the lack of correlation of these parameters looking at the total number of subjects. There was also a decrease in the correlation value in maximal force when a weaker group was added, i.e., in the total number of subjects.
Even though a more detailed analysis of a small sample of eight sprinters using kinetic and kinematic data did not determine a correlation between asymmetry and sprint performance [25], as in [26], which analyzed 22 sprinters competing in the 100 m sprint, the same outcome was found for the group that included poorly trained sprinters, as in the results from this study that analyzed younger female athletes. However, there is a correlation between asymmetry and sprint times with individual results [25] that confirms the concept of self-organisation [40] and is a functional requirement to optimise performance. For some sprinters asymmetry may be both functional and dysfunctional. Furthermore, asymmetry can indicate poor running technique or that one side of the body is not performing as optimally as the other.
The reason for such results lies in the cyclic movement of sprints and training programs aimed at developing explosive strength and speed of the lower extremities equally. [19]. This has been shown in studies results in which better athletes have a smaller asymmetry index compared with weaker ones, without a correlation with sprint times [25,26].
5. Limitations
The limitation of the study is reflected in a relatively small number of subjects, and with weaker results of the sprint test. A small difference in the mean values of the sprint test between the groups limits the results of the differences for both the kinetic parameters and the correlation results.
6. Conclusions
It is concluded that younger sprinters do not manifest the principle of muscle activation in the form of a longer preparatory phase of contact time, the concentric phase, and the force impulse that is optimal and recognizable in better sprinters in other studies. With that difference, it can be concluded that the better sprinters in this paper produced a higher rate of explosive power transformation per unit of time, i.e., force impulse as well as CMJ concentric phase velocity, which correlated with sprint performance. Support for this was found in the values obtained for the highest negative correlation of the sprint test with the total impulse, both for the results of both legs and for the results for each leg individually. The results of the asymmetries agree with most of the findings so far, and it can be concluded that there is no correlation with sprint performance.
There are a small number of studies that analyzed younger of athletes, so the advantage and contribution of this research is the completion of data that help to properly guide and correction sprint techniques and improve the training process, all in order to improve sprint results and injury prevention. The limitation of the study is reflected in the small number of participants, and it is recommended that future research should increase this number, as well as expand the analyzed parameters to include kinematic and tensiomyographic measurements.
Author Contributions
Conceptualization, N.P., M.Č., D.Č. and G.S.; methodology, N.P., G.S., S.Ž.F. and M.Č; software, N.P.; validation, M.Č., G.S., S.Ž.F., D.Č. and M.T.; formal analysis, N.P. and M.T.; investigation, N.P.; resources, N.P.; data curation, S.Ž.F., D.Č. and M.T.; writing—original draft preparation, N.P., G.S. and M.Č.; writing—review and editing, N.P., M.Č., D.Č., S.Ž.F., M.T. and G.S.; visualization, N.P.; supervision, M.Č., G.S. and S.Ž.F. All authors have read and agreed to the published version of the manuscript.
Funding
This research received no external funding.
Institutional Review Board Statement
The study was conducted in accordance with the Declaration of Helsinki, and approved by the Ethics Committee of University of Niš, Faculty of Sport and Physical Education (ethical approval number: 04-227/2, 24 February 2022).
Informed Consent Statement
Informed consent was obtained from all subjects involved in the study.
Data Availability Statement
Not applicable.
Acknowledgments
The authors wish to praise the participants and their professional contribution to the study.
Conflicts of Interest
The authors declare no conflict of interest.
References
- Coh, M.; Peharec, S.; Bacic, P. The sprint start: Biomechanical analysis of kinematic, dynamic and electromyographic parameters. New Stud. Athl. 2007, 22, 29–38. [Google Scholar]
- Mero, A. Force-time characteristics and running velocity of male sprinters during the acceleration phase of sprinting. Res. Q. Exerc. Sport 1988, 59, 94–98. [Google Scholar] [CrossRef]
- Mero, A. Relationships between the maximal running velocity, muscle fiber characteristics, force production and force relaxation of sprinters. Scand. J. Sports Sci. 1981, 3, 16–22. [Google Scholar]
- Blickhan, R. The spring-mass model for running and hopping. J. Biomech. 1989, 22, 1217–1227. [Google Scholar] [CrossRef]
- Luhtanen, P.; Komi, P.V. Mechanical factors influencing running speed. Biomechanics 1978, 2, 23–28. [Google Scholar]
- Nagahara, R.; Mizutani, M.; Matsuo, A.; Kanehisa, H.; Fukunaga, T. Association of sprint performance with ground reaction forces during acceleration and maximal speed phases in a single sprint. J. Appl. Biomech. 2018, 34, 104–110. [Google Scholar] [CrossRef] [PubMed]
- Mero, A.; Kuitunen, S.; Harland, M.; Kyröläinen, H.; Komi, P.V. Effects of muscle-tendon length on joint moment and power during sprint starts. J. Sports Sci. 2006, 24, 165–173. [Google Scholar] [CrossRef]
- Mero, A.; Luhtanen, P.; Komi, V. Segmentalle Krafterzeugung und Geschwindigkeit des Koerperschwerpunkts in den Kontaktphasen beim sprint. Leistungssport 1986, 16, 35–39. [Google Scholar]
- Mero, A.; Komi, P.V. Effects of Supramaximal Velocity on Biomechanical Variables in Sprinting. Int. J. Sports Biomech. 1985, 1, 240–252. [Google Scholar] [CrossRef]
- Mero, A.; Komi, P.V.; Gregor, R.J. Biomechanics of sprint running. A review. Sports Med. 1992, 13, 376–392. [Google Scholar] [CrossRef]
- Arampatzis, A.; Brüggemann, G.P.; Metzler, V. The effect of speed on leg stiffness and joint kinetics in human running. J. Biomech. 1999, 32, 1349–1353. [Google Scholar] [CrossRef]
- Hunter, J.P.; Marshall, R.N.; McNair, P.J. Interaction of step length and step rate during sprint running. Med. Sci. Sports Exerc. 2004, 36, 261–271. [Google Scholar] [CrossRef] [PubMed] [Green Version]
- Maly, T.; Zahalka, F.; Mala, L.; Cech, P. The bilateral strength and power asymmetries in untrained boys. Open Med. 2015, 10, 224–232. [Google Scholar] [CrossRef] [PubMed]
- Slinde, F.; Suber, C.; Suber, L.; Edwén, C.E.; Svantesson, U. Test-retest reliability of three different countermovement jumping tests. J. Strength Cond. Res. 2008, 22, 640–644. [Google Scholar] [CrossRef] [PubMed]
- Ramirez-Campillo, R.; Andrade, D.C.; Nikolaidis, P.T.; Moran, J.; Clemente, F.M.; Chaabene, H.; Comfort, P. Effects of Plyometric Jump Training on Vertical Jump Height of Volleyball Players: A Systematic Review with Meta-Analysis of Randomized-Controlled Trial. J. Sports Sci. Med 2020, 19, 489–499. [Google Scholar]
- Young, W.; McLean, B.; Ardagna, J. Relationship between strength qualities and sprinting performance. J. Sports Med. Phys. Fit. 1995, 35, 13–19. [Google Scholar]
- Hennessy, L.; Kilty, J. Relationship of the stretch-shortening cycle to sprint performance in trained female athletes. J. Strength Cond. Res. 2001, 15, 326–331. [Google Scholar]
- Maulder, P.S.; Bradshaw, E.J.; Keogh, J. Jump kinetic determinants of sprint acceleration performance from starting blocks in male sprinters. J. Sports Sci. Med. 2006, 5, 359–366. [Google Scholar]
- Coh, M.; Mackala, K. Differences between the elite and subelite sprinters in kinematic and dynamic determinations of countermovement jump and drop jump. J. Strength Cond. Res. 2013, 27, 3021–3027. [Google Scholar] [CrossRef]
- Cormack, S.J.; Newton, R.U.; McGulgan, M.R.; Doyle, T.L.A. Reliability of measures obtained during single and repeated countermovement jumps. Int. J. Sports Physiol. Perform. 2008, 3, 131–144. [Google Scholar] [CrossRef] [Green Version]
- Bishop, C.; Turner, A.; Read, P. Effects of inter-limb asymmetries on physical and sports performance: A systematic review. J. Sports Sci. 2018, 36, 1135–1144. [Google Scholar] [CrossRef] [PubMed]
- Heishman, A.; Daub, B.; Miller, R.; Brown, B.; Freitas, E.; Bemben, M. Countermovement Jump Inter-Limb Asymmetries in Collegiate Basketball Players. Sports 2019, 7, 103. [Google Scholar] [CrossRef] [PubMed] [Green Version]
- Keeley, D.W.; Plummer, H.A.; Oliver, G.D. Predicting asymmetrical lower extremity strength deficits in college-aged men and women using common horizontal and vertical power field tests: A possible screening mechanism. J. Strength Cond. Res. 2011, 25, 1632–1637. [Google Scholar] [CrossRef] [PubMed]
- Čoh, M.; Babić, V.; Maćkała, K. Biomechanical, neuro-muscular and methodical aspects of running speed development. J. Hum. Kinet. 2010, 26, 73–81. [Google Scholar] [CrossRef]
- Haugen, T.; Danielsen, J.; McGhie, D.; Sandbakk, Ø.; Ettema, G. Kinematic stride cycle asymmetry is not associated with sprint performance and injury prevalence in athletic sprinters. Scand. J. Med. Sci. Sports 2018, 28, 1001–1008. [Google Scholar] [CrossRef]
- Exell, T.; Irwin, G.; Gittoes, M.; Kerwin, D. Strength and performance asymmetry during maximal velocity sprint running. Scand. J. Med. Sci. Sports 2017, 27, 1273–1282. [Google Scholar] [CrossRef] [Green Version]
- Lockie, R.G.; Callaghan, S.J.; Berry, S.P.; Cooke, E.R.A.; Jordan, C.A.; Luczo, T.M.; Jeffriess, M.D. Relationship between unilateral jumping ability and asymmetry on multidirectional speed in team-sport athletes. J. Strength Cond. Res. 2014, 28, 3557–3566. [Google Scholar] [CrossRef] [Green Version]
- Bailey, C.; Sato, K.; Alexander, R.; Chiang, C.Y.; Stone, M.H. Isometric force production symmetry and jumping performance in collegiate athletes. J. Train. 2013, 2, 1–5. [Google Scholar] [CrossRef] [Green Version]
- Bell, D.R.; Sanfilippo, J.L.; Binkley, N.; Heiderscheit, B.C. Lean mass asymmetry influences force and power asymmetry during jumping in collegiate athletes. J. Strength Cond. Res. 2014, 28, 884–891. [Google Scholar] [CrossRef] [Green Version]
- World Medical Association. World Medical Association Declaration of Helsinki: Ethical principles for medical research involving human subjects. JAMA 2013, 310, 2191–2194. [Google Scholar] [CrossRef] [Green Version]
- Bishop, C.; Read, P.; Lake, J.; Chavda, S.; Turner, A. Interlimb asymmetries: Understanding how to calculate differences from bilateral and unilateral tests. Strength Cond. J. 2018, 40, 1–6. [Google Scholar] [CrossRef] [Green Version]
- Linthorne, N.P. Analysis of standing vertical jumps using a force platform. Am. J. Phys. 2001, 69, 1198–1204. [Google Scholar] [CrossRef] [Green Version]
- Zahálka, F.; Malý, T.; Malá, L.; Gryc, T.; Hráský, P. Power assessment of lower limbs and strength asymmetry of soccer goalkeepers. Acta Gymnica 2013, 43, 31–38. [Google Scholar] [CrossRef] [Green Version]
- Owen, N.J.; Watkins, J.; Kilduff, L.P.; Bevan, H.R.; Bennett, M.A. Development of a criterion method to determine peak mechanical power output in a countermovement jump. J. Strength Cond. Res. 2014, 28, 1552–1558. [Google Scholar] [CrossRef] [PubMed] [Green Version]
- Maloney, S.J. The Relationship between Asymmetry and Athletic Performance: A Critical Review. J. Strength Cond. Res. 2019, 33, 2579–2593. [Google Scholar] [CrossRef]
- Bailey, C.A.; Sato, K.; Burnett, A.; Stone, M.H. Force-production asymmetry in male and female athletes of differing strength levels. Int. J. Sports Physiol. Perform. 2015, 10, 504–508. [Google Scholar] [CrossRef]
- Bazyler, C.D.; Bailey, C.A.; Chiang, C.Y.; Sato, K.; Stone, M.H. The effects of strength training on isometric force production symmetry in recreationally trained males. J. Train. 2014, 3, 6–10. [Google Scholar] [CrossRef] [Green Version]
- Brown, S.R.; Feldman, E.R.; Cross, M.; Helms, E.R.; Marrier, B.; Samozino, P.; Morin, J.-B. The Potential for a Targeted Strength-Training Program to Decrease Asymmetry and Increase Performance: A Proof of Concept in Sprinting. Int. J. Sports Physiol. Perform. 2017, 12, 1392–1395. [Google Scholar] [CrossRef]
- Suchomel, T.J.; Nimphius, S.; Stone, M.H. The Importance of Muscular Strength in Athletic Performance. Sports Med. 2016, 46, 1419–1449. [Google Scholar] [CrossRef]
- Kugler, P.N.; Turvey, M.T. Self-Organization, Flow Fields, and Information. Hum. Mov. Sci. 1988, 7, 97–129. [Google Scholar] [CrossRef]

Table 1.
Descriptive characteristics of subjects.
| Parameters | Group 1 Mean ± SD | Group 2 Mean ± SD | All Subjects Mean ± SD |
|---|---|---|---|
| Age | 15.6 ± 1.34 | 16.2 ± 1.30 | 15.9 ± 1.28 |
| Weight, kg | 62.54 ± 7.73 | 57.69 ± 3.12 | 60.12 ± 6.11 |
| Height, cm | 170.1 ± 1.57 | 168.4 ± 0.91 | 169.1 ± 1.36 |
| BMI | 21.6 ± 2.05 | 20.37 ± 1.38 | 20.98 ± 1.77 |
| 100 m, s | 13.57 * ± 0.79 | 14.05 ± 0.28 | 13.81 ± 0.32 |
*—The difference between the groups is statistically significant (p < 0.05).
Table 2.
Kinetic parameters of CMJ and asymmetry.
| Parameters | Group 1 | Group 2 | ||||||
|---|---|---|---|---|---|---|---|---|
| Left | Diff | Right | Both | Left | Diff | Right | Both | |
| Mean ± SD | % | Mean ± SD | Mean ± SD | Mean ± SD | % | Mean ± SD | Mean ± SD | |
| Height, cm | 27.95 * ± 4.58 | 4.21 | 25.69 * ± 2.67 | 26.82 * ± 3.56 | 19.93 ± 1.18 | 14.21 | 14.96 ± 3.29 | 17.45 ± 2.01 |
| Contact t, s | 0.564 ± 0.14 | 1.62 | .546 ± 0.12 | 0.555 ± 0.13 | 0.648 ± 0.06 | −2.56 | 0.682 ± 0.06 | 0.665 ± 0.1 |
| Ecc t, s | 0.138 ± 0.02 | −0.72 | .140 ± 0.2 | 0.139 ± 0.2 | 0.184 ± 0.05 | 0.55. | 0.182 ± 0.09 | 0.183 ± 0.04 |
| Conc t, s | 0.156 ± 0.03 | −1.89 | .162 ± 0.04 | 0.159 ± 0.03 | 0.154 ± 0.04 | −1.28 | 0.158 ± 0.22 | 0.156 ± 0.27 |
| Peak F, N | 896.6 ± 145.4 | 1.69 | 866.8 ± 156.4 | 881.7 ± 150.8 | 749.8 ± 118.6 | 2.28 | 716.4 ± 124.5 | 733.1 ± 121.1 |
| F, N-kg⋅s−1 | 283.1 ± 111.4 | 5.56 | 253.3 ± 118.3 | 268.2 ± 114.6 | 183.8 ± 97.9 | 9.99 | 150.4 ± 105.2 | 167.1 ± 101.1 |
| Ecc I, N⋅s | 87.6 ± 14.04 | 0.01 | 87.57 ± 15.64 | 87.59 ± 14.44 | 87.1 ± 22.65 | 5.07 | 78.69 ± 18.39 | 82.9 ± 19.57 |
| Conc I, N⋅s | 96.93 * ± 17.21 | 0.92 | 95.16 * ± 17.51 | 96.05 * ± 16.95 | 70.88 ± 9.28 | 3.61 | 65.94 ± 11.04 | 68.41 ± 4.77 |
| Total I, N⋅s | 145.6 * ± 15.0 | 2.77 | 137.79 * ± 15.5 | 141.71 * ± 14.51 | 113.65 ± 7.52 | 6.99 | 98.79 ± 15.83 | 106.2 ± 11.63 |
| T-off V, m/s | 2.33 * ± 0.19 | 1.75 | 2.24 * ± 0.11 | 2.29 * ± 14 | 1.96 ± 0.06 | 7.1 | 1.7 ± 196 | 1.83 ± 0.12 |
| Ecc V, m/s | 1.4 ± 0.17 | 0.72 | 1.39 ± 0.15 | 1.39 ± 0.15 | 1.47 ± 0.36 | 4.26 | 135 ± 0.24 | 141 ± 0.3 |
| Conc V, m/s | 1.5 ± 0.22 | 0.01 | 1.51 * ± 0.15 | 1.5 * ± 0.17 | 1.2 ± 0.21 | 2.56 | 114 ± 0.2 | 117 ± 0.12 |
| Asy % | 1.32 ± 0.79 | N/A | x | N/A | 2.87 ± 1.45 | N/A | x | N/A |
Legends: I—Impulse; V—Velocity; t—Time; Ecc—Eccentric; Conc—Concentric; T-off—Take-off; Asy—Asymmetry; Diff—Differences between one leg to both leg values; N/A—Not applicable; *—The difference between the groups is statistically significant (p < 0.05).
Table 3.
Correlation between 100 m sprint and kinetic parameters for each leg and together.
| Parameters | All Subjects | ||
|---|---|---|---|
| Left r | Right r | Both r | |
| Height, cm | −0.801 | −0.894 | −0.875 |
| Total impulse, N s | −0.834 | −0.812 | −0.883 |
| Concentric impulse, N s | −0.725 | −0.745 | −0.779 |
| Concentric velocity, m/s | x | −0.769 | −0.778 |
| Take-off velocity, m/s | −0.825 | −0.883 | −0.884 |
All results are statistically significant (p < 0.05).
Table 4.
Correlation between asymmetry and kinetic parameters for each group and all subjects.
| Parameters | Group 1 r | Group 2 r | All Subjects r |
|---|---|---|---|
| Peak Force, N | −0.878 | x | −0.633 |
| Ecc I left, N s | −0.865 | x | x |
| Conc I, right N s | x | −0.886 | x |
Legends: I—Impulse; Ecc—Eccentric; Conc—Concentric; All results are statistically significant (p < 0.05).
Publisher’s Note: MDPI stays neutral with regard to jurisdictional claims in published maps and institutional affiliations. |
© 2022 by the authors. Licensee MDPI, Basel, Switzerland. This article is an open access article distributed under the terms and conditions of the Creative Commons Attribution (CC BY) license (https://creativecommons.org/licenses/by/4.0/).
Share and Cite
MDPI and ACS Style
Prvulović, N.; Čoh, M.; Čular, D.; Tomljanović, M.; Sporiš, G.; Fišer, S.Ž. Countermovement Jump in Female Sprinters: Kinetic Parameters and Asymmetry. Symmetry 2022, 14, 1130. https://doi.org/10.3390/sym14061130
AMA Style
Prvulović N, Čoh M, Čular D, Tomljanović M, Sporiš G, Fišer SŽ. Countermovement Jump in Female Sprinters: Kinetic Parameters and Asymmetry. Symmetry. 2022; 14(6):1130. https://doi.org/10.3390/sym14061130
Chicago/Turabian StylePrvulović, Nikola, Milan Čoh, Dražen Čular, Mario Tomljanović, Goran Sporiš, and Suzana Žilič Fišer. 2022. "Countermovement Jump in Female Sprinters: Kinetic Parameters and Asymmetry" Symmetry 14, no. 6: 1130. https://doi.org/10.3390/sym14061130
Note that from the first issue of 2016, this journal uses article numbers instead of page numbers. See further details here.