Dow Jones (US30, YM) — Dow Jones Industrial Average, DJIA. Its price reflects the average cost of 30 companies from various sectors listed on the NYSE (New York Stock Exchange). Dow Jones comprises the largest US corporations, such as Apple, Walt Disney, Walmart, Nike, McDonald's, Microsoft, Coca-Cola, and others.
This Dow Jones forecast article will discuss the Dow Jones Stock Index and its past performance, factors that can affect the DJI, what experts have to say, and prediction charts.
We will also try to answer what a trader can do in this difficult time for investing.
The article covers the following subjects:
- Highlights and Main Points
- About the Dow Jones Stock Index
- Dow Jones index price today
- Forecast for Dow Jones price for 2024
- DJIA Technical analysis
- What will the Dow Jones rate be in 2024 according to technical analysis?
- Long-Term DJIA Trading Plan
- Forecast for Dow Jones price for 2025
- Long-term forecast for Dow Jones for 2026-2030
- Long-term forecast for Dow Jones for 2030-2040
- History of Dow Jones rate changes
- What’s the future of the Dow Jones? Is investing in Dow Jones still a good option?
- Dow Jones Forecast FAQ
Highlights and Main Points
- Dow Jones is one of the key indices of the American stock market, founded in the late 19th century by Wall Street Journal editors Charles Dow and Edward Jones. The Dow Jones index includes shares of the 30 largest corporations in the United States from various industries. The value of the index is tied to the price of these shares. The more expensive a stock is, the greater its weight in the index.
- The Dow Jones Index reflects the overall economic situation in the United States based on 30 companies from various sectors of the economy. The index directly affects financial markets, since the general mood of market participants depends on the dynamics of the DJIA rate.
- When trading an index, traders use scalping and day trading to make a profit on price movements within the trading session. They also use swing trading to make money over several days, weeks, or months.
- The choice of timeframe depends on the trading strategy. When trading intraday, it is better to use time frames from 3m to H1. When trading for a longer period, it is better to use time frames from H1 to W1.
- Stop loss settings depend on the chosen trading strategy and time frames used. Place stop orders behind liquid support and resistance levels, depending on the type of trade.
About the Dow Jones Stock Index
The Dow Jones index (Dow Jones) is an American stock index with a leading market position. It was created in 1896 by Charles Dow and Edward Jones, the founders of the famous financial media agency Dow Jones & Company and the first publishers of the Wall Street Journal.
Originally, the Dow Jones index consisted only of industrial companies, but this is no longer true. Of the original 12 companies, only General Electric still exists, but it was also removed in 2018. Procter & Gamble, included in the Dow since 1932, is the oldest company on the Dow Jones index.
The index's initial cost was $40.94, the average of the prices of 12 shares at the time. In 1916, the index was expanded to 20 stocks. Since 1928, the Dow has included 30 publicly listed companies, which is why it is also called "Dow 30."
You can buy the Dow Jones from S&P Dow Jones Indices LLC, just like other popular indexes, including the S&P 500. The Dow Jones Index's product code is #YM on the CME stock exchange.
It's worth noting that the Dow Jones is a price-weighted index, in contrast to, for example, the AEX. That means that an expensive stock can greatly impact the index's overall movement. In other words, not every company is equally important and counts equally for the stand of the fair, which provides a good picture of the financial situation in America.
The calculation of the final price of the index is quite complicated, given stock splits and dividends. The average is divided by the Dow Divisor, which maintains the index's accuracy. The Dow Divisor is regularly updated, affecting the Dow Jones forecast.
Dow Jones index price today
Currently, the Dow Jones index includes 30 companies from various sectors of the US economy.
The value of the index is calculated by adding the share prices of these companies and dividing the resulting amount by a specially calculated coefficient. This coefficient is used to avoid errors when splitting securities in the index structure. The capitalization of companies is not taken into account.
Index rebalancing occurs in the following cases:
- when a company's capitalization sharply increases or decreases.
- when global economic changes occur.
The index is calculated at the end of the trading session.
The Dow Jones index price reached its all-time high of $39283.2 on February 23, 2024. Quotes then corrected amid uncertain Fed rhetoric and an acceleration in consumer inflation to 3.2% in the US in February.
H2: Factors That Can Impact the Dow Jones Stock Price
A stock index is a difficult instrument for forecasting as it comprises various stocks. The price of stocks is subject to specific factors inherent in specific economic sectors. However, we can single out a few factors that affect the index as a whole.
Current news
The price of the Dow Jones in the stock market is based on information from the companies included. That is why it is important to keep a close eye on all the major news and financial performance of the companies that weigh the most in this reference index.
US Economic Data
Economic data published by US officials also play an important role in the index's price formation. These figures include the unemployment rate, trade balance, GDP growth rate, inflation data, retail sales, durable goods, industrial orders, business sentiment, and consumer confidence.
US Dollar Exchange Rate
The value of the US dollar against other currencies affects the export or import profitability of US-listed companies, so it also affects the Dow Jones index. If the US dollar goes down, the stock index's cost can drop, too.
US Federal Reserve Communications
The US Federal Reserve's rate decisions and press conferences also impact the value of the Dow Jones index stocks.
Today, the Dow Jones Industrial Average (#YM) is traded at $38 257.5.
Forecast for Dow Jones price for 2024
Due to its long history, the Dow Jones index is very popular among investors and traders. This makes YM a liquid and quite volatile instrument.
Will the price reverse from current levels or reach new highs this year? Let's consider the forecasts of the world's leading experts and analysts.
Bank of America
Bank experts are optimistic about changes in the stock market in 2024.
According to Capex experts, companies have successfully adapted to the Fed's tight monetary policy and high inflation. Today, market participants are focusing on the possibility of an economic downturn after a period of economic uncertainty. Analysts expect the price of the Dow Jones index to be between $39,000 and $40,000 this year.
JPMorgan
According to Capex, JPMorgan experts predict a decline in index quotes to $33,000. This scenario is based on several fundamental factors:
- updating stock price highs for many companies from different sectors of the US economy;
- decline in consumer demand;
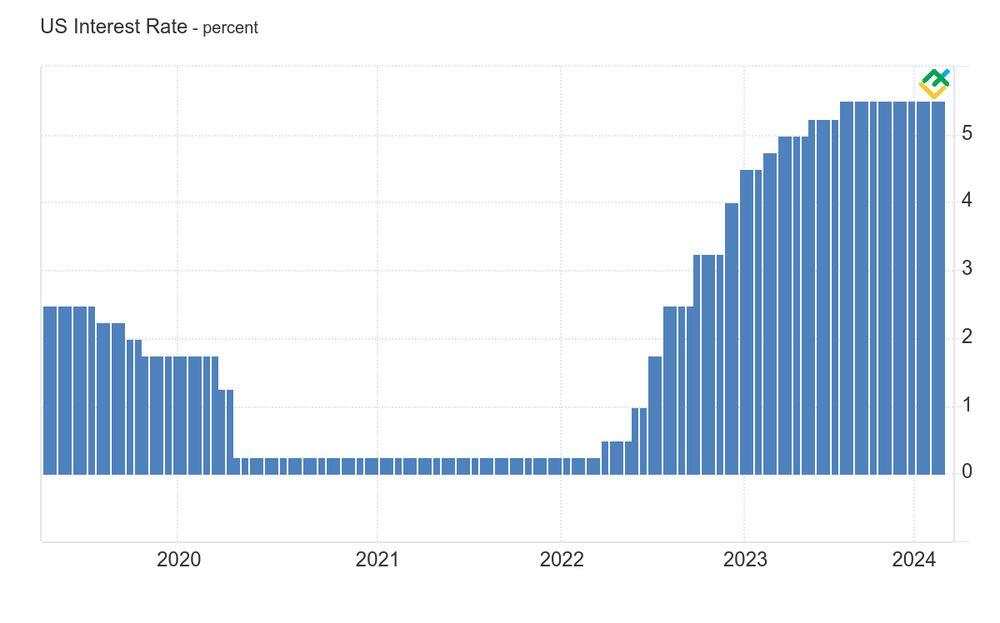
- maintaining the interest rate at a high level of 5.5% for a long time;
- high risk of recession in developed countries;
- growing geopolitical tensions.
Deutsche Bank
The bank's analysts give a positive forecast for the Dow Jones exchange rate in 2024.
In their opinion, index quotes will increase by 10% to $40,000 in 2024. If the US economy avoids recession, growth could reach up to 19%. This scenario is more likely due to cooling inflation and stable GDP growth.
Goldman Sachs
Goldman Sachs analysts' forecast is neutral. In 2024, the Dow Jones rate will be between $37,000 and $38,000.
Bank experts predict that corporate income will remain at the same level, which will support stocks during a recession. In addition, earnings growth shortfalls and minimal equity risk premiums are the main constraints on the index's growth.
Morgan Stanley
According to experts, index quotes may drop to $35,000 this year and remain at this level.
Analysts recommend that traders focus on buying defensive stocks from the healthcare, utilities, consumer staples, industrial, and energy sectors. At the same time, experts note that it is better to avoid investing in shares of technology companies.
Societe Generale
The French financial conglomerate provided a neutral forecast for the Dow Jones exchange rate.
A controlled recession, monetary tightening, and a sell-off in the credit market (second quarter) are expected in the middle of the year. According to experts, the index price will be around $37,500.
Wells Fargo
According to Wells Fargo, the Dow Jones index will remain at $36,000 this year.
The company's experts expect increased tension in the economy in the coming months as the Fed's monetary restrictions continue. Analysts also expect a moderate decline in real GDP in a number of countries from mid-2024.
Coin Price Forecast
According to Coin Price Forecast, the Dow Jones price could reach $40,000 by mid-2024. By the end of the year, quotes could rise to $43,947.
Long Forecast
According to Long Forecast, the price of the Dow Jones index could reach $46,983.
Below is a table with the opening/closing prices and minimums/maximums of YM for each month of 2024.
| Month | Open, $ | Minimum / Maximum, $ | Close, $ |
|---|---|---|---|
| April | 38345 | 35320/41902 | 37979 |
| May | 37979 | 35841/41237 | 38539 |
| June | 38539 | 36631/42145 | 39388 |
| July | 39388 | 38090/43824 | 40957 |
| August | 40957 | 40957/47737 | 44614 |
| September | 44614 | 41564/47820 | 44692 |
| October | 44692 | 41961/48277 | 45119 |
| November | 45119 | 42194/48546 | 45370 |
| December | 45370 | 43694/50272 | 46983 |
DJIA Technical analysis
The optimal time frames for determining medium- and long-term targets for the Dow Jones are H4, D1, W1 and MN.
It is recommended to use technical indicators in combination with candlestick and chart patterns. This will allow traders to more accurately determine liquid support and resistance levels, oversold/overbought zones, trend strength, as well as potential reversal points and opening/closing positions.
The best indicators to analyze the DJIA index are Stochastic, MACD, MFI, VWAP in combination with SMA.
Common candlestick patterns include bullish and bearish flags, pennants, engulfing patterns, belt hold, counterattack, hammer and hanging man reversal patterns.
Before starting a deeper analysis, let's look at the monthly chart and determine the market sentiment.
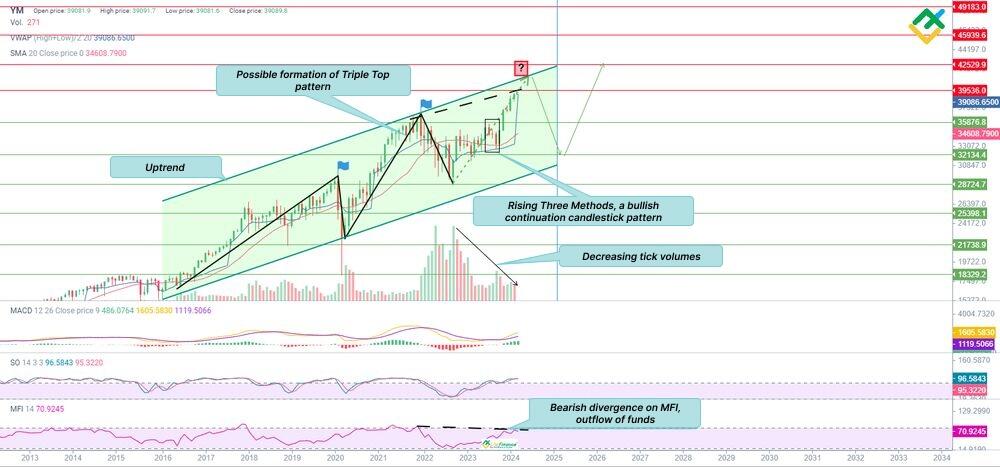
The monthly chart shows a steady DJIA uptrend since January 2016. The formation of the triple top pattern may soon be completed. The final top is currently unfolding at around $41076.3, which is near the trend border.
In addition, at the end of February the price reached a new high at $39283.2. Then it corrected to $38447.9. Currently, buyers are trying to recover, while quotes remain at $39144.1.
Bullish rising three methods pattern formed in the monthly chart also signals a likely uptrend continuation. However, technical indicators indicate that the instrument is overheated. Tick volumes decrease as prices rise. MFI also indicates the outflow of funds and the formation of bearish divergence.
The Stochastic indicator is located in the overbought zone at the level of 96.60, which may signal an imminent price reversal down. However, MACD values are growing moderately in the positive zone. The VWAP and SMA20 indicator lines are located below the price in the chart, which also confirms insignificant growth potential.
A preliminary analysis of the monthly #DJIA price chart showed that a downward correction to the level of $32134.4 may begin in the near future as part of an uptrend.
DJIA Forecast For Next Three Months
For a three-month forecast, let's use the H4 and D1 charts.
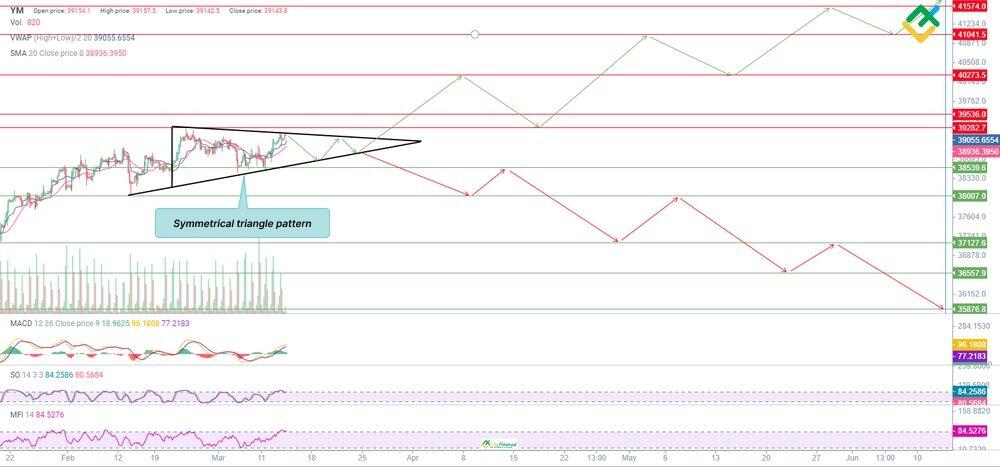
The H4 chart shows sideways price movement within the symmetrical triangle chart pattern. The price can break out the triangle both up and down.
MACD indicators are gradually decreasing in the positive zone towards the zero border. The values of the Stochastic indicator have pushed off from the upper border and are directed downwards. The MFI volume indicator also bounced off from the upper border and smoothly reversed at the top.
The VWAP and SMA lines are still below the chart's price, indicating a bullish trend.
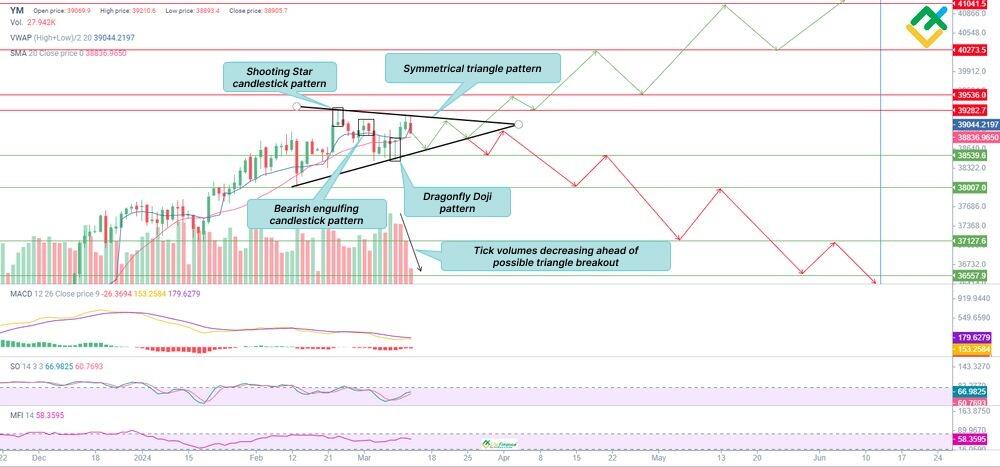
The daily chart also shows multidirectional dynamics within the symmetrical triangle pattern. However, it is worth highlighting the formation of shooting star and bearish engulfing reversal patterns near the new high.
The formation of the dragonfly doji pattern at the top signals an imminent downward price reversal rather than the uptrend continuation.
The chart shows a sharp decrease in tick volumes. This is usually typical for prices inside a triangle and occurs before the breakout of one of the sides of the pattern.
MACD is growing in the negative zone, approaching the zero border. The Stochastic indicator is directed upward and is above level 66. There is potential for growth. The MFI indicator gradually decreases.
Currently, the price has broken out the dynamic VWAP line down, which may signal a decline. However, the SMA line is still below the price.
Since the price has reached a new high and is trading in the high price zone, it will soon break out the lower border of the symmetrical triangle pattern. Successful consolidation of the price below $38539.6 will make entering short trades with targets in the zone of $38007.0-$36557.9 reasonable.
An alternative scenario implies a breakout and consolidation of the price above the resistance of $39282.7. After that, it could head towards new highs of $39536.0-$41041.5 over the next three months.
What will the Dow Jones rate be in 2024 according to technical analysis?
Since the asset has updated its price maximum and looks overheated, expect a downward correction to the lower border of the ascending channel, near the level of $35876.8. The correction will end in the fourth quarter of this year, followed by an upward reversal.
The weekly chart is optimal for conducting a more detailed technical analysis.
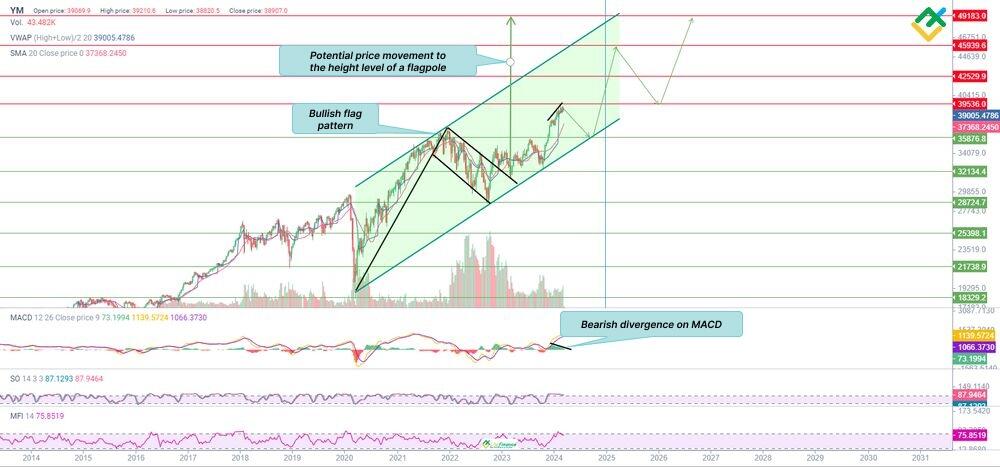
Long-Term YM Technical Analysis
Dow Jones has been in a steady uptrend since mid-March 2020. The chart shows a large continuation pattern bull flag which the price broke out in early November 2022.
Since then, the price has tested the broken out level of $32134.4 in March 2023 and continued to move up to the current all-time highs, holding under the resistance level of $39536.0.
Since the breakout of the bull flag pattern, tick volumes have decreased significantly. The MFI indicator shows a downward reversal in the overbought zone. Stochastic has been moving horizontally in the overbought zone since November 2023.
The MACD indicator values are actively decreasing in the positive zone towards the zero border. A bearish divergence has also formed, which warns of an imminent correction of the instrument to the support of $35876.8.
It should be emphasized that the remaining growth potential for the next few years after the correction this year (according to the trading rules of the bull flag pattern) is more than 37%. Dow Jones could reach new highs of 49183.0 in the next 3-5 years if the uptrend continues.
The table below shows the likely price minimums and maximums for 2024.
| Month | YM price forecast | |
|---|---|---|
| Minimum, $ | Maximum, $ | |
| April | 37832.2 | 38351.9 |
| May | 37026.8 | 38040.1 |
| June | 36741.0 | 37416.5 |
| July | 36351.1 | 36793.0 |
| August | 35779.7 | 36481.2 |
| September | 35753.7 | 36663.0 |
| October | 36481.2 | 37442.5 |
| November | 37416.5 | 38429.8 |
| December | 38222.0 | 39339.2 |
Long-Term DJIA Trading Plan
Technical analysis made it possible to determine liquid support and resistance levels, as well as profitable buy and sell zones. The results can be used to make a long-term trading plan.
Trading plan for 3 months
- key support levels: 38539.6, 38007.0, 37127.6, 36557.9;
- main resistance levels: 39282.7, 39536.0, 40273.5, 41041.5;
- H4 and D1 analysis showed that the asset quotes move in a symmetrical triangle. It is necessary to wait for the price to exit the triangle to determine further price dynamics. According to the main scenario, the price will break out the lower border of the pattern with a target in the zone of 38007.0 and below. An alternative scenario implies a breakout of the upper border followed by growth toward 40273.5 and higher.
Trading plan for 2024
- key support levels: 35876.8, 32134.4, 28724.7, 25398.1, 21738.9, 18329.2;
- main resistance levels: 39536.0, 42529.9, 45939.6, 49183.0;
- A bullish flag is being formed with a possible target in the zone of 49183.0. But this year the DJIA will correct to the level of 35876.8 with a subsequent upward reversal to the zone of new highs.
Start trading with a trustworthy broker
Forecast for Dow Jones price for 2025
The Dow Jones forecast for a longer period involves certain risks due to the current geopolitical situation and the global economic situation. Therefore, the forecast may change.
Below are expert forecasts for the Dow Jones index for 2025.
Long Forecast
According to Long Forecast, the price of the Dow Jones Industrial Average at the beginning of 2025 could be $46,983. At the end of March, the price will overcome the $50,000 mark and close at $50,402. By the end of 2025, it is expected to rise to $59,561.
| Month | Open, $ | Minimum / Maximum, $ | Close, $ |
|---|---|---|---|
| January | 46983 | 45473/52319 | 48896 |
| February | 48896 | 45803/52699 | 49251 |
| March | 49251 | 46874/53930 | 50402 |
| April | 50402 | 47753/54941 | 51347 |
| May | 51347 | 48254/55518 | 51886 |
| June | 51886 | 49630/57102 | 53366 |
| July | 53366 | 50081/57620 | 53850 |
| August | 53850 | 52752/60694 | 56723 |
| September | 56723 | 56723/68993 | 64479 |
| October | 64479 | 54413/64479 | 58509 |
| November | 58509 | 52519/60425 | 56472 |
| December | 56472 | 55392/63730 | 59561 |
Coin Price Forecast
Coin Price Forecast analysts expect the Dow Jones to reach $47,538 by mid-2025. By the end of the year, the price will rise to $48,954.
Predict-Price
According to Predict-Price experts, DJIA will be trading in a neutral trend in 2025. However, the price may rise to $71,000. An alternative scenario implies a decline to the level of $36,445.
Long-term forecast for Dow Jones for 2026-2030
According to some experts, Dow Jones companies do not have much growth potential in the long term. They believe that the current bullish trend will soon end. However, Sheaff Brock Investment Advisors founder and partner Dave S. Gilreath disagrees. He argues that companies normally increase profits over time. In turn, this may affect the further growth of YM quotes above $40,000 by 2025.
The owner of Madrona Funds and Bauer Evans CPA, chief investment officer, lead planner, and senior portfolio manager Brian Evans believes Dow Jones quotes will rise to $50,000 by 2030.
Coin Price Forecast
According to Coin Price Forecast, the Dow Jones index could reach $69,727 by the end of 2030, an increase of 80%.
| Year | Mid-year, $ | Year-end, $ | Beginning / end, % |
|---|---|---|---|
| 2025 | 49,426 | 50,899 | 29% |
| 2026 | 54,854 | 55,029 | 39% |
| 2027 | 55,690 | 55,935 | 42% |
| 2028 | 61,529 | 65,349 | 66% |
| 2029 | 65,364 | 67,246 | 70% |
| 2030 | 71,033 | 72,498 | 84% |
Predict-Price
According to Predict-Price, the probability of the Dow Jones index rising to $81,878 in 2026 is just over 30%. The chances of unidirectional uptrend are more than 69%. This means that the price will remain volatile and continue to fluctuate within a certain range.
The DJIA could also decline to $35,576 in 2026.
Long Forecast
According to analysts from Long Forecast, the price of the Dow Jones industrial index at the end of April 2028 could reach $53,195.
| Year | Open, $ | Minimum / Maximum, $ | Close, $ |
|---|---|---|---|
| December 2024 | 45370 | 43694/50272 | 46983 |
| January 2025 | 46983 | 45473/52319 | 48896 |
| December 2025 | 56472 | 55392/63730 | 59561 |
| January 2026 | 59561 | 52495/60397 | 56446 |
| December 2026 | 53164 | 48342/55620 | 51981 |
| January 2027 | 51981 | 50061/57597 | 53829 |
| December 2027 | 58509 | 52519/60425 | 56472 |
| January 2028 | 56472 | 55392/63730 | 59561 |
| April 2028 | 56165 | 49471/56919 | 53195 |
Note: The Dow Jones long-term forecast is based on assumptions and cannot be considered completely reliable.
Long-term forecast for Dow Jones for 2030-2040
The DJIA index consists of 30 large, publicly traded companies in the United States, representing various sectors of the economy. Their total capitalization exceeds $14 trillion.
Below are the top 3 companies by largest capitalization:
- Microsoft Corporation (MSFT) — $3.107 trillion.
The growth in the corporation's capitalization is due to investors beginning to purchase MSFT shares against the backdrop of the development of AI technologies and Microsoft's $13 billion investment in OpenAI's ChatGPT. In addition, the companies signed a long-term contract allowing Microsoft to use AI in its products.
- Apple Inc. (AAPL) — $2.704 trillion.
The growth of Apple's capitalization is associated with the recovery of demand for the American company's products against the backdrop of a favorable economic situation in this sector. The main sales segments are iPhone, Services, Mac, iPad, Wearables, Home & Accessories.
- Amazon Inc. (AMZN) — $1.815 trillion.
The main reason for Amazon's capitalization growth is the increase in revenue and operating profit to $7.7 billion. In addition, the corporation is actively optimizing its costs, making the rise in the cost of goods sold insignificant.
Long-term DJIA price prediction 2030
Despite disagreements between experts and world-class analysts, the former expect the continuation of the bullish trend within the borders of the ascending channel by 2030.
The Dow Jones Industrial Average may correct in 2024 due to uncertainty about future Fed policy, geopolitical tensions, and the upcoming US Presidential elections.
Unpredictable surges in geopolitical tensions and severe economic shocks could lead to a decline in the value of the Dow Jones index by 2030.
However, scientific and technological breakthroughs, further growth in corporate profits, as well as global economic development will contribute to the growth of the DJIA rate.
When making long-term price forecasts for the Dow Jones, it is extremely important to pay attention to the following factors:
- Economic development;
- Political news;
- Inflation and interest rate dynamics;
- US Federal Reserve's rhetoric.
DJIA quotes are expected to trade in the $60,000-$100,000 range in 2030. At the same time, the closing price for 2030 will be $80,000.
Long-term DJIA price prediction 2040
In current geopolitical and economic realities, predicting the YM rate 16 years in advance is difficult. However, let's look at the three most likely scenarios:
- Optimistic scenario. In conditions of stable economic and technological development, the price of the Dow Jones index may continue to grow at a steady pace of 10-20% per year.
- According to the neutral scenario, the index will grow moderately under favorable economic conditions and a stable rise in corporate profits and capitalization of companies.
- The negative scenario implies increased geopolitical tensions, disruption of supply chains, rising inflation, falling global demand and, accordingly, a decline in the index.
Experts predict that in 2040, the minimum price will be $75,000, and the maximum will be $200,000. By the end of 2040, the Dow Jones price will reach $125,000.
It should be emphasized that long-term forecasts may not coincide with actual financial market data. Results may vary significantly due to various factors.
History of Dow Jones rate changes
To assess the DJIA rate's moves and identify its patterns in the stock markets, let's take a detailed look at the history of the price changes since the creation of the index.
- DJIA creation, 1896. The index was first published on 26 May 1896 and comprised 12 industrial companies.
- Great Depression, 1929-1933. The index fell by over 80% during the Great Depression, reaching a low in 1932.
- Post-war recovery, 1940-1960. After World War II, the index grew rapidly, reflecting the US economic recovery.
- Crises and corrections, 1970-1980. Significant crises occurred in 1973-1974 and 1987, leading to the DJIA's decline.
- Internet boom, 1990-2000. In the late 1990s, the index grew along with high-tech companies.
- Profitability and recessions, 2000-2010. The Internet bubble burst in the early 2000s, and the 2008 financial crisis followed, pushing the Dow Jones down.
- Recovery period, 2010-2015. The exchange rate began to recover gradually after the crisis and reached some record levels by 2015.
- High-tech development, 2010-2020. Big tech stocks, such as Apple, Microsoft, and Amazon, became key growth drivers in the late 2010s.
- COVID-19 pandemic, 2020. At the beginning of 2020, the global financial market faced the COVID-19 pandemic. The DJIA declined in February-March 2020 but then began to recover quickly after the introduction of stimulus measures.
- Record levels, 2020-2021. As of September 2021, the Dow Jones Industrial Average reached record levels, exceeding 35,000 points. In 2021, investors expressed concerns over inflation and prospective Fed interest rate hikes, causing market fluctuations.
- Financial crisis, 2022. The DJIA showed a decline of 14.9% compared to 2021, closing at 30,273.96 points amid the Fed's attempts to handle inflation. That was the DJI's worst year since 2008 when it fell by 33.8%.
- The index reached its highest point at $39985.7 on 2024-04-01.
Here's a chart showing the events mentioned above that affected market conditions.
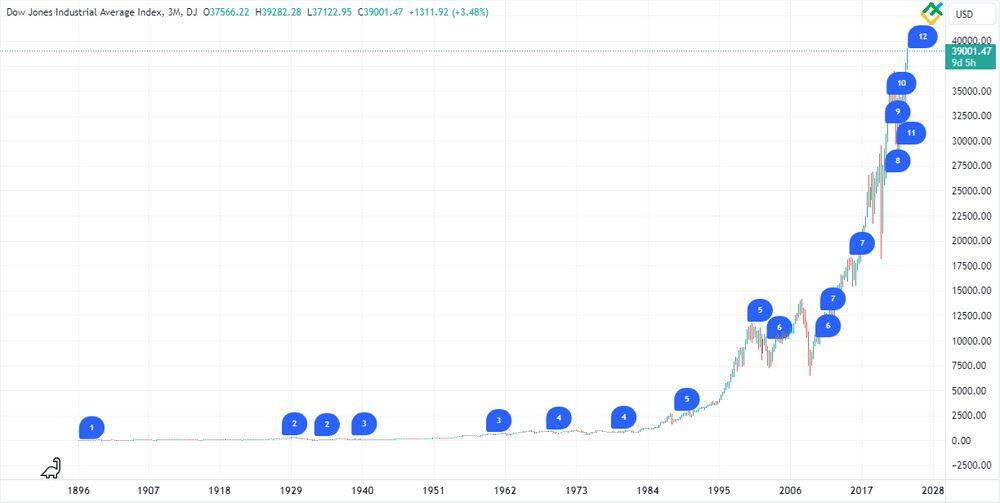
Source: TradingView.
What’s the future of the Dow Jones? Is investing in Dow Jones still a good option?
Over the past 25 years, the Dow Jones index has broken several price records.
Below are the historical highs for the Dow Jones Industrial Average price from 2000 to 2024:
- $11,750 in 2000;
- $14,198 in 2007;
- $18,351 in 2015;
- $26,951 in 2018;
- $29,568 in 2020;
- $36,952 in 2022;
- $39,282 in February 2024.
The Dow Jones index's value has increased by a record 234% over the past 25 years. On average, the DJIA grows 10% per year and up to 20% during a bullish trend.
The rising value of the industrial index makes it more volatile. The price during a trading session can fluctuate by hundreds and sometimes thousands of points.
Check out the Dow Jones price forecast for 2024-2025 below.
| Month | Open, $ | Minimum / maximum, $ | Close, $ | Change, % |
|---|---|---|---|---|
| 2024 | ||||
| April | 38345 | 35320/41902 | 37979 | -2,8% |
| May | 37979 | 35841/41237 | 38539 | -1,4% |
| June | 38539 | 36631/42145 | 39388 | 0,8% |
| July | 39388 | 38090/43824 | 40957 | 4,8% |
| August | 40957 | 40957/47737 | 44614 | 14,1% |
| September | 44614 | 41564/47820 | 44692 | 14,3% |
| October | 44692 | 41961/48277 | 45119 | 15,4% |
| November | 45119 | 42194/48546 | 45370 | 16,1% |
| December | 45370 | 43694/50272 | 46983 | 20,2% |
| 2025 | ||||
| January | 46983 | 45473/52319 | 48896 | 25,1% |
| February | 48896 | 45803/52699 | 49251 | 26,0% |
| March | 49251 | 46874/53930 | 50402 | 28,9% |
| April | 50402 | 47753/54941 | 51347 | 31,4% |
| May | 51347 | 48254/55518 | 51886 | 32,7% |
| June | 51886 | 49630/57102 | 53366 | 36,5% |
| July | 53366 | 50081/57620 | 53850 | 37,8 % |
| August | 53850 | 52752/60694 | 56723 | 45,1 % |
| September | 56723 | 56723/68993 | 64479 | 65,0 % |
| October | 64479 | 54413/64479 | 58509 | 49,7 % |
| November | 58509 | 52519/60425 | 56472 | 44,5 % |
| December | 56472 | 55392/63730 | 59561 | 52,4 % |
Source: LongForecast.com.
The Dow Jones Industrial Average remains an attractive and popular trading instrument. YM's historical value contributes to investors' and traders' high confidence in the index.
Shares of international multinational corporations included in the Dow Jones attract the attention of many market participants.
If you are interested in index investing and want to learn more about it, open a free demo account with LiteFinance. A wide range of trading instruments and analysis tools will help you to increase your profits.
Dow Jones Forecast FAQ
The current DJI price as of 27.04.2024 is $38 257.5.
Companies with the highest stock prices have a greater proportionate weight in the structure of the Dow Jones Industrial Average. The index is calculated by adding up the stock prices of all 30 component companies and dividing the total by a divisor.
The Dow Jones industrial index structure includes thirty large, publicly traded US companies. These companies are developing steadily, which attracts the attention of investors. Therefore, the Dow Jones index is a good investment.
The Dow Jones reached an all-time high in February 2024, which could subsequently trigger a downward correction. However, the growth in economic indicators of Dow Jones corporations indicates a partial recovery in consumer demand. This, in turn, may signal further growth of the DJIA value.
Since the beginning of 2024, the Dow Jones has gained more than 4%. Wall Street experts predict growth of 10% this year.
The Dow Jones price is rising within an uptrend, so investing in the index looks reasonable. Moreover, the companies included in the Dow Jones are quite stable. The index's diversified structure will allow traders to avoid high risk since it includes 30 companies from various sectors of the US economy.
Due to potential economic and geopolitical problems worldwide, a strong decline in the index cannot be ruled out. However, the DJIA includes only high-quality, economically relevant stocks. If they weaken, either in performance or relevance, they are excluded from the index and replaced by others.
The Dow Jones Industrial Average is a perfect indicator of the US general economic state. The Dow Jones index is quite responsive to domestic and foreign economic and political events. The stock index and local currency trends are often positively correlated. The correlation calculator and the instruction on its use are available here. To analyze the Dow Jones price, monitor the latest news and the signals of 10 technical indicators here.
Price chart of YM in real time mode
The content of this article reflects the author’s opinion and does not necessarily reflect the official position of LiteFinance. The material published on this page is provided for informational purposes only and should not be considered as the provision of investment advice for the purposes of Directive 2004/39/EC.


