Genome characterization and comparative analysis among three swimming crab species
 Ming Liu1*
  Shanshan Ge2*
  Shivish Bhandari1
  Chunlei Fan1
  Yu Jiao3 Chunlei Gai2 Youhong Wang2 Hongjun Liu2*
- 1Patuxent Environmental and Aquatic Research Laboratory, Morgan State University, St. Leonard, MD, United States
- 2Key Laboratory of Disease Control in Mariculture, Marine Science Research Institute of Shandong Province, Qingdao, China
- 3Fishery College, Guangdong Ocean University, Zhanjiang, China
In this study we sequenced the genomes of three economically important swimming crabs Portunus trituberculatus, Charybdis japonica, and Callinectes sapidus using the next-generation sequencing approach and made a basic assembly. The genomes of the three species are characterized with high heterozygosity (>1.2%) and high repeat content (>50%). Genome comparative analysis revealed 40 long conserved fragments (>5,000 bp) among the three species, most of them are involved in cardiac-related biological process. Relative higher genome similarity was found between P. trituberculatus and C. japonica that are belong to different subfamilies, compared to that between P. trituberculatus and C. sapidus which are from the same subfamily. It is inconsistent with their phylogenetic evolutionary trees inferred from previous mitochondrial DNA coding fragments and a conserved ANK2 protein fragment from this study. We speculated that the high genome similarity between P. trituberculatus and C. japonica might be attributed to their same inhabit range in which the genome is subject to the same environment selection, and the inconsistence between genome similarity and phylogenetic relationship is caused by the different evolutionary rates of coding DNA and non-coding DNA under environment selection.
Introduction
Crabs are decapod crustaceans of the infraorder Brachyura, typically with a very short tail hidden entirely under the thorax, a thick shell and a single pair of pincers. They are comprised of 98 families with over 7,000 described species that inhabit in oceans, freshwaters, as well as land (Ng et al., 2008; de Grave et al., 2009; Tsang et al., 2014). Crabs are a significant part of the fishery abundance of many countries and are a vital protein source (Lohani, 2011; Anderson and Alford, 2014; Krisfalusi-Gannon et al., 2018). Commercial crabs make up 26% of all crustaceans caught and farmed worldwide, with about 1.5 million tons being consumed annually (Food and Agriculture Organization (FAO), 2021). In most estuaries, the crab plays a key ecological role as a keystone predator on numerous species of smaller invertebrates and serves as prey for sea birds, turtles, and large fish species (Hines, 2007; Lipcius et al., 2007; Long et al., 2011).
The Gazami crab (Portunus trituberculatus), Asian paddle crab (Charybdis japonica) and blue crab (Callinectes sapidus) are three swimming crabs (belong to Portunidae family) that are characterized by the flattening of the fifth pair of legs into broad paddles which are used for swimming. All the three crabs are commercially important species. P. trituberculatus are widely distributed in the eastern coasts of Asia and North Australia (Figure 1A). It is the world’s most heavily fished crab species, with over 450,000 tons being caught annually (Figure 1B). C. japonica has a similar distribution with P. trituberculatus but mostly inhabits in the coasts of China, Japan and Korea, its capture production is about one tenth of P. trituberculatus. Both resources of P. trituberculatus and C. japonica declined largely recent years due to overfishing, farming practice of these two species have started in China to reduce the fishery pressure (Liu and Dai, 2000; Gu and Qiao, 2012). C. sapidus is native to the eastern coasts of America from Argentina to Cape Cod in MA, US (Williams, 1974). It is the dominant crab fishery in the US with the landing s of 71,400 tons in 2019, which is valued at $199.3 million (National Oceanic and Atmospheric Administration (NOAA) Fisheries, 2022). Both P. trituberculatus and C. sapidus belonged to Portuninae subfamily. They have similar morphological appearance. C. japonica is from a different subfamily, Thalamitinae, and its shell is rounder and thicker, and the sawtooth on the edge of the shell is larger compared to the other two Portuninae crabs (Figures 1C–E).
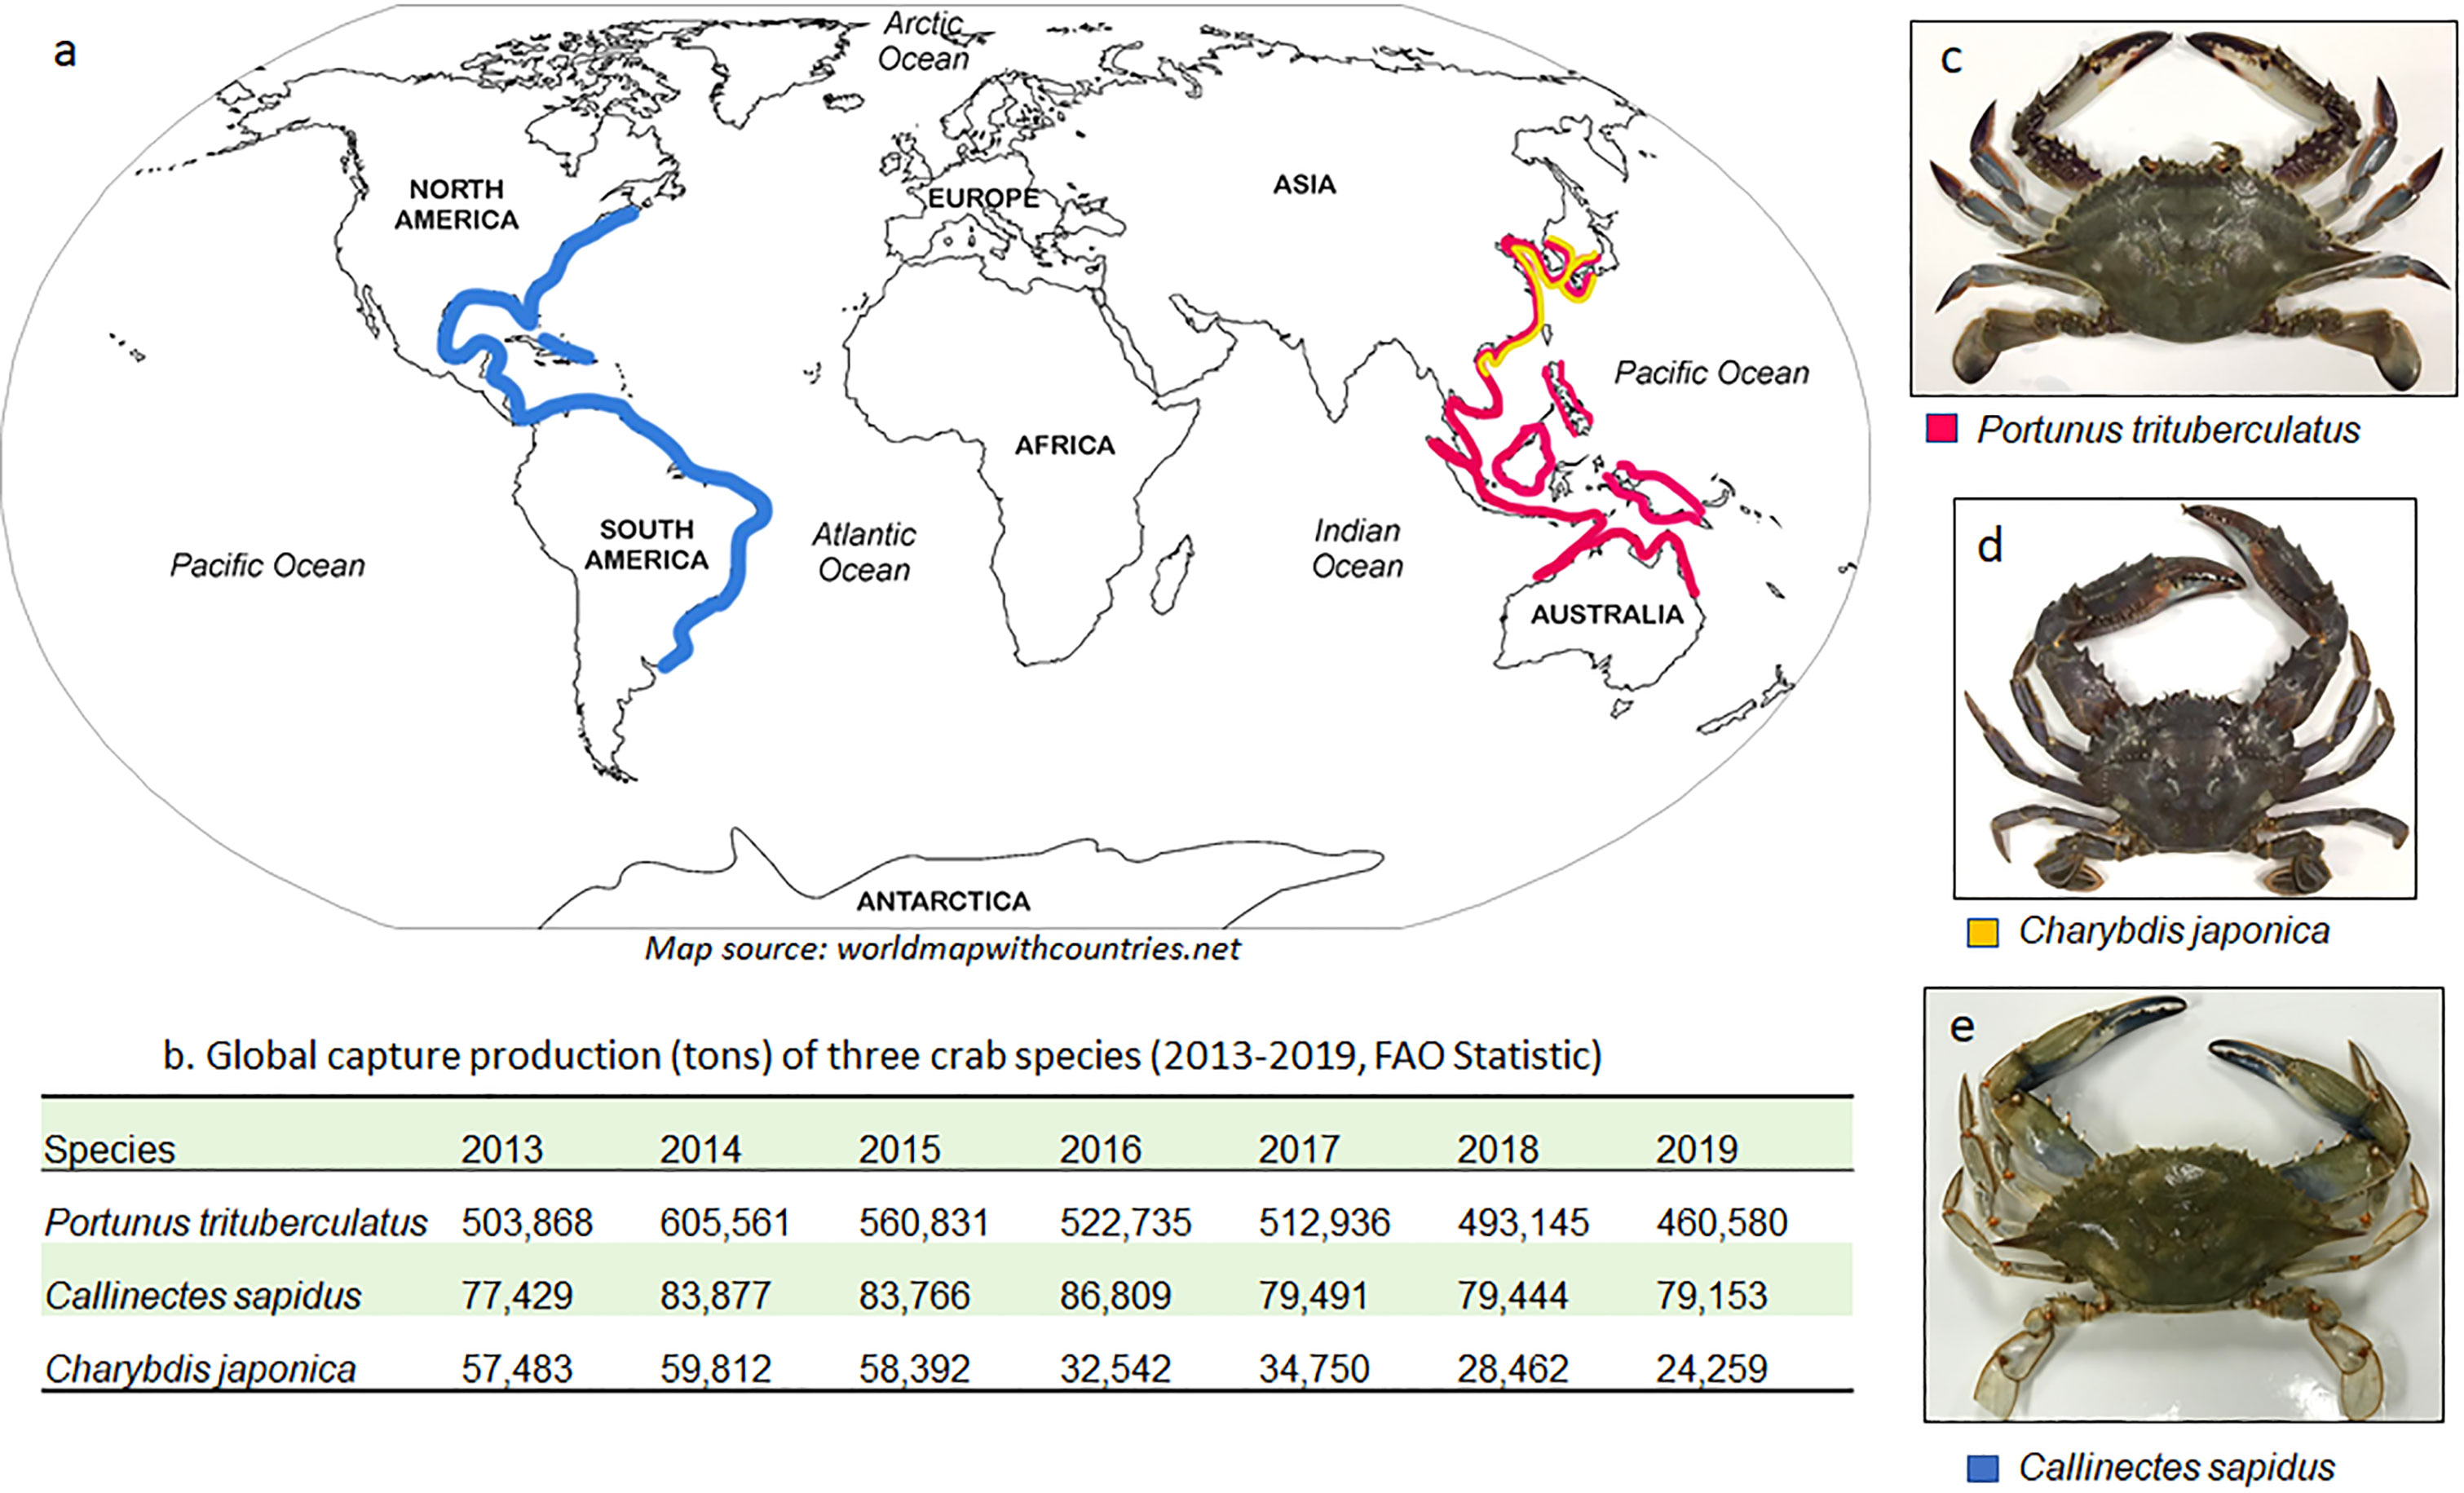
Figure 1 The distribution (A), global capture production (B) and photographs (C–E) of three swimming crabs.
The genome is all the nucleotide sequences of DNA (or RNA in viruses) in organisms (Roth, 2019), which is highly associated with biological processes and cell function and contains the information of evolution as well (Gao et al., 2018). With the rapid development of molecular biotechnologies, more and more organisms’ genomes are revealed, and they are playing important roles in modern medicine and agriculture such as disease diagnosis (Manolio, 2013; Yu et al., 2020) and genomic selection (Varshney et al., 2014; Meuwissen et al., 2016). The high-resolution intra-or-inter specific genomic data also brings new perspectives in species conservation and evolution (Primmer, 2009; Benestan et al., 2016). In the present study, we sequenced the genomes of the three swimming crab species and performed a comparative analysis. These genome sequences, despite a basic assembly, are useful for resource conservation and genetic breeding of crabs. Through the genome comparative analysis, it will help further understand the phylogenetic evolution and taxonomy relationship of the three species, and the conserved regions that may be part of the “homologous genes” can be identified. The homologous genes are important in shaping the characterized phenotypes of related species and adapting to climate and environment changes (Yuan et al., 2021). Our results may bring new insights in understanding the scenarios of speciation and adaptive evolution of genome in Decapoda species.
Materials and methods
Sampling and sequencing
C. japonica and P. trituberculatus were collected from a marine benthic survey at the coast of Yantai City (Yellow Sea, China) in June 2018. C. sapidus was purchased from local seafood market of St. Leonard, Maryland, US. The muscles of crab pincers were sampled and preserved in 95% ethanol for DNA extraction. The genomic DNA were extracted using traditional phenol-chloroform method. The DNA was broken into fragments of 350 bp using an ultrasonicator (Covaris Inc. Woburn, US), then the library was constructed through the steps of end repair, addition of A at the 3’ end, addition of connector, target fragment recovers using electrophoresis, PCR amplification of the target fragments. The libraries were sequenced on the Illumina HiSeq X platform at Gene Denovo Co. (Guangzhou, China). The raw data were generated after base calling from the sequencing with each base a quality score. The ratios of bases with quality score above 20 and 30 called Q20 and Q30 respectively were calculated. The raw data also include the adapter bases and unknown bases (N). The clean reads were obtained by removing those reads containing adaptor, the reads of containing >10% N, and low-quality reads (containing >40% base with Q <= 10).
Estimate and assembly of the genomes
The K-mer analysis was performed to predict the genome size, heterozygosity and repeat sequences. K-mers are substrings of length k contained within a biological sequence in bioinformatics. In sequence assembling, the term K-mer refers to all of a sequence’s subsequences of length k. The genome size can be estimated using the equation below:
Where the K-mer number is the total number of K-mer in the read set, the K-mer depth is the expected value. The K-mer depth frequency distribution is assumed to follow a Poisson distribution, therefore the expectation of K-mer depth can be estimated from the depth frequency distribution curve. The heterozygosity ratio and repeat sequences were estimated based on the methods described by Liu et al. (2013). All the K-mer analysis were performed using Jellyfish (Marçais and Kingsford, 2011) and GenomeScope (Vurture et al., 2017; http://qb.cshl.edu/genomescope/). In this study, we used k = 21 for K-mer analysis which is most frequently used. The clean reads were assembled into contigs in software SOAPdenovo2 by applying the de Bruijn graph structure (Luo et al., 2012), and then the contigs were spliced into scaffolds. Genome-wide Microsatellite Analyzing Tool Package (GMATA, Wang and Wang, 2016) was used to identify all the microsatellite loci, statistics the location, length, repetitions of the repeat motif, and design the primers for ideal microsatellite makers. The parameters were set as below: min-length of motif is 2, the max length is 6, and the min-repeat times is 5. The maker design parameters are min amplicon size = 120 bp, max amplicon size = 400 bp, optimal annealing temperature = 60°C.
Genome comparative analysis
We employed two approaches two measure the genome similarity among the three crab species, 1) the Average Nucleotide Identity (ANI, Ciufo et al., 2018; Jain et al., 2018) and 2) the number and cumulative length of conserved regions. The algorithm of ANI is described by the formula:
The ID%, Length of the Alignment, and Length of the shorter fragment terms refer to the individual blast hits from genome–genome comparisons (Gosselin et al., 2022). The ANI was calculated using FastANI v1.33 (Jain et al., 2018) with the parameter set-up of K-mer size = 16 and Fragment Length = 3,000. The genome conserved regions were identified using MUMmer 4.0 (Delcher et al., 2003; Marçais et al., 2018). The minimum length of a cluster of matches is 65, the minimum length of a single exact match is 20, and the maximum gap between two adjacent matches is 90. The alignment results were further filtered using identify > 85% and minimum aligned length > 1,000 bp and >5,000 bp respectively.
The nucleotide sequence of the identified conserved regions (>5,000 bp) that appear in all the three species were extracted using BEDTools (Quinlan and Hall, 2010). Because a chromosome-level assembled genome of P. trituberculatus has been available (Tang et al., 2020; NCBI Reference No. ASM1759143v1), the gene names of those conserved regions can be acquired through BLAST (Altschul et al., 1997), and then the gene ontology (GO) terms were obtained using gene name from NCBI database (https://www.ncbi.nlm.nih.gov). The GO enrichment analysis was performed using the OmicShare tools, a free online platform for data analysis (https://www.omicshare.com/tools).
The gene that has the longest conserved region in all three crab species was selected for further analysis. The gene characteristics and the location of the conserved region on the gene were identified by BLAST with P. trituberculatus genome (Tang et al., 2020) shown in NCBI Sequence Viewer (Rangwala et al., 2021). The protein domains were predicted using SMART (a Simple Modular Architecture Research Tool; Letunic et al., 2021; http://smart.embl-heidelberg.de). The homeotic gene fragments from other known-genome Decapoda species were obtained by BLAST the coding sequence of the similar region. A phylogenetic tree was constructed using MEGA 11 (Tamura et al., 2021) based on Neighbor-joining method (Saitou and Nei, 1987).
Results
Genome characterization of the three crab species
The summary for the sequencing data is shown in Table 1. The minimum Q20 and Q30 are 95.09% and 89.02% which meet the sequencing accuracy requirement of illumine platform that the Q20 and Q30 should be at least 90% and 85%. The estimated genome sizes based on the 21-mer analysis (Figure S1, Table 2) are 737.6 Mb, 994.4 Mb and 993.4 Mb for P. trituberculatus, C. japonica, and C. sapidus respectively. The observed heterozygous rate is larger than 1% for all three species. The repeat sequence content ranges from 58.4% to 62.6% (Table 2). The preliminary genome assembly results are shown in Table 3. Total of 485,821 scaffolds with the total length of 762 Mb were obtained for P. trituberculatus, 655,217 scaffolds with the total length of 1Gb were obtained for C. japonica, and 706,990 scaffolds with the total length of 858 Mb were obtained for C. sapidus. The N50 length is short for all three species, ranging from 1,397 (C. sapidus) to 2,131 (P. trituberculatus). The GC content for the assembled genome sequences ranges from 39% - 42% for the three species, which fall into the GC preference range of Illumina sequencing (25% - 65%). Total of 1.3 million, 1.0 million and 1.7 million microsatellite loci were identified from the assembled genome sequences of P. trituberculatus, C. japonica and C. sapidus (Table S1). Of the five motif repeat types, the dinucleotide repeat occurs most frequently in all the three species. The top grouped dinucleotide motifs are GT/AC in both P. trituberculatus and C. japonica, while it is different in C. sapidus (TC/GA, Figure S2). The microsatellite markers and their primers developed from these repeat motifs are listed in Table S2.
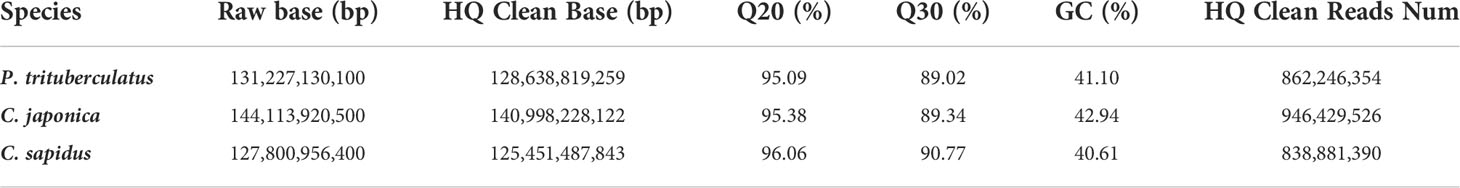
Table 1 Sequencing data statistics for three crab species.
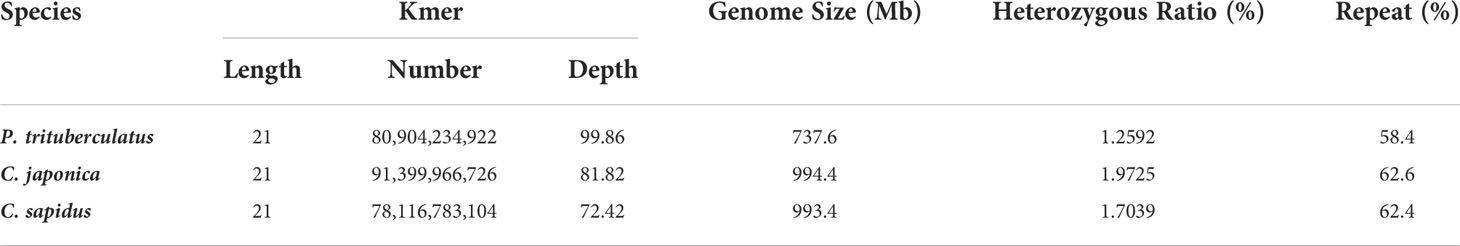
Table 2 K-mer statistics and genome estimates of three crab species.
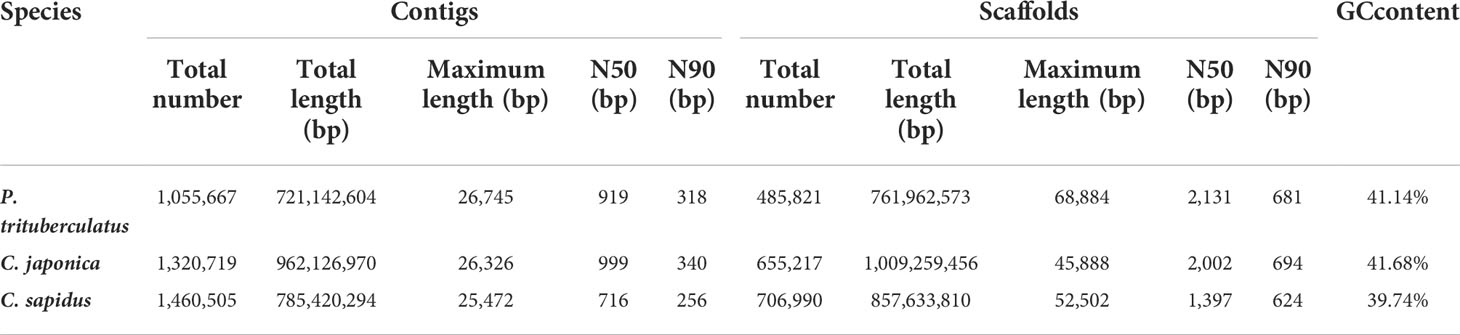
Table 3 Statistics of the assembled genome sequences for the three crab species.
Genome similarity and conserved fragments among three crab species
The ANI between P. trituberculatus and C. japonica (82.3%) is close with that between P. trituberculatus and C. sapidus (82.6%), while the ANI between C. japonica and C. sapidus is relative smaller (80.3%, Table 4). The MUMmer results revealed 16,414 conserved fragments (alignment length > 1,000 bp, identity > 85%) with total length of 26.5 Mb between P. trituberculatus and C. japonica, 12,745 conserved fragments with total length of 20 Mb between P. trituberculatus and C. sapidus, and 9,366 conserved fragments with total length of 14.7 Mb between C. japonica and C. sapidus (Table S3). The results were further filtered using alignment length > 5,000 bp, the numbers of conserved fragments are 126, 67, and 58 respectively (Table 4). Among these similar fragments, total of 40 were found in all three crab species. There are 34 fragments from 28 genes that have been annotated. The gene names are shown in Table 5. These genes are mostly involved in 22 biological processes, 6 molecular functions and 13 cellular components (Figure 2A). The top 20 significantly enriched ontologies are shown in Figure 2B, including regulation of cardiac conduction, circulatory system process, heart contraction, blood circulation, muscle structure development, synaptic membrane, etc.
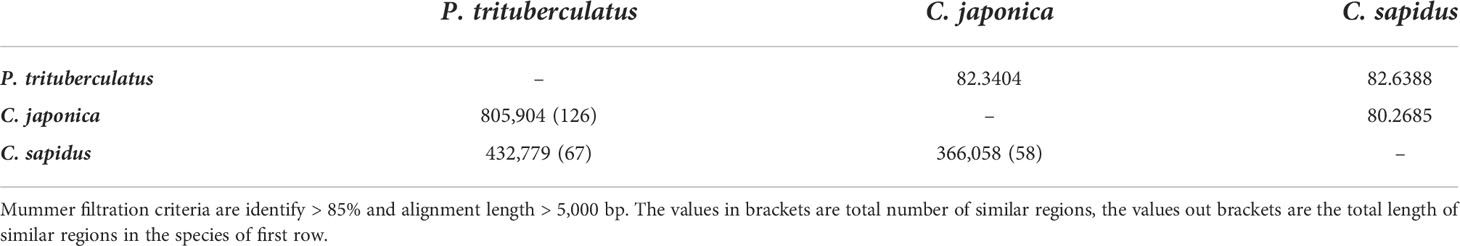
Table 4 Pairwise results of Mummer (lower diagonal) and Average Nucleotide Identity (upper diagonal) among three crab species.
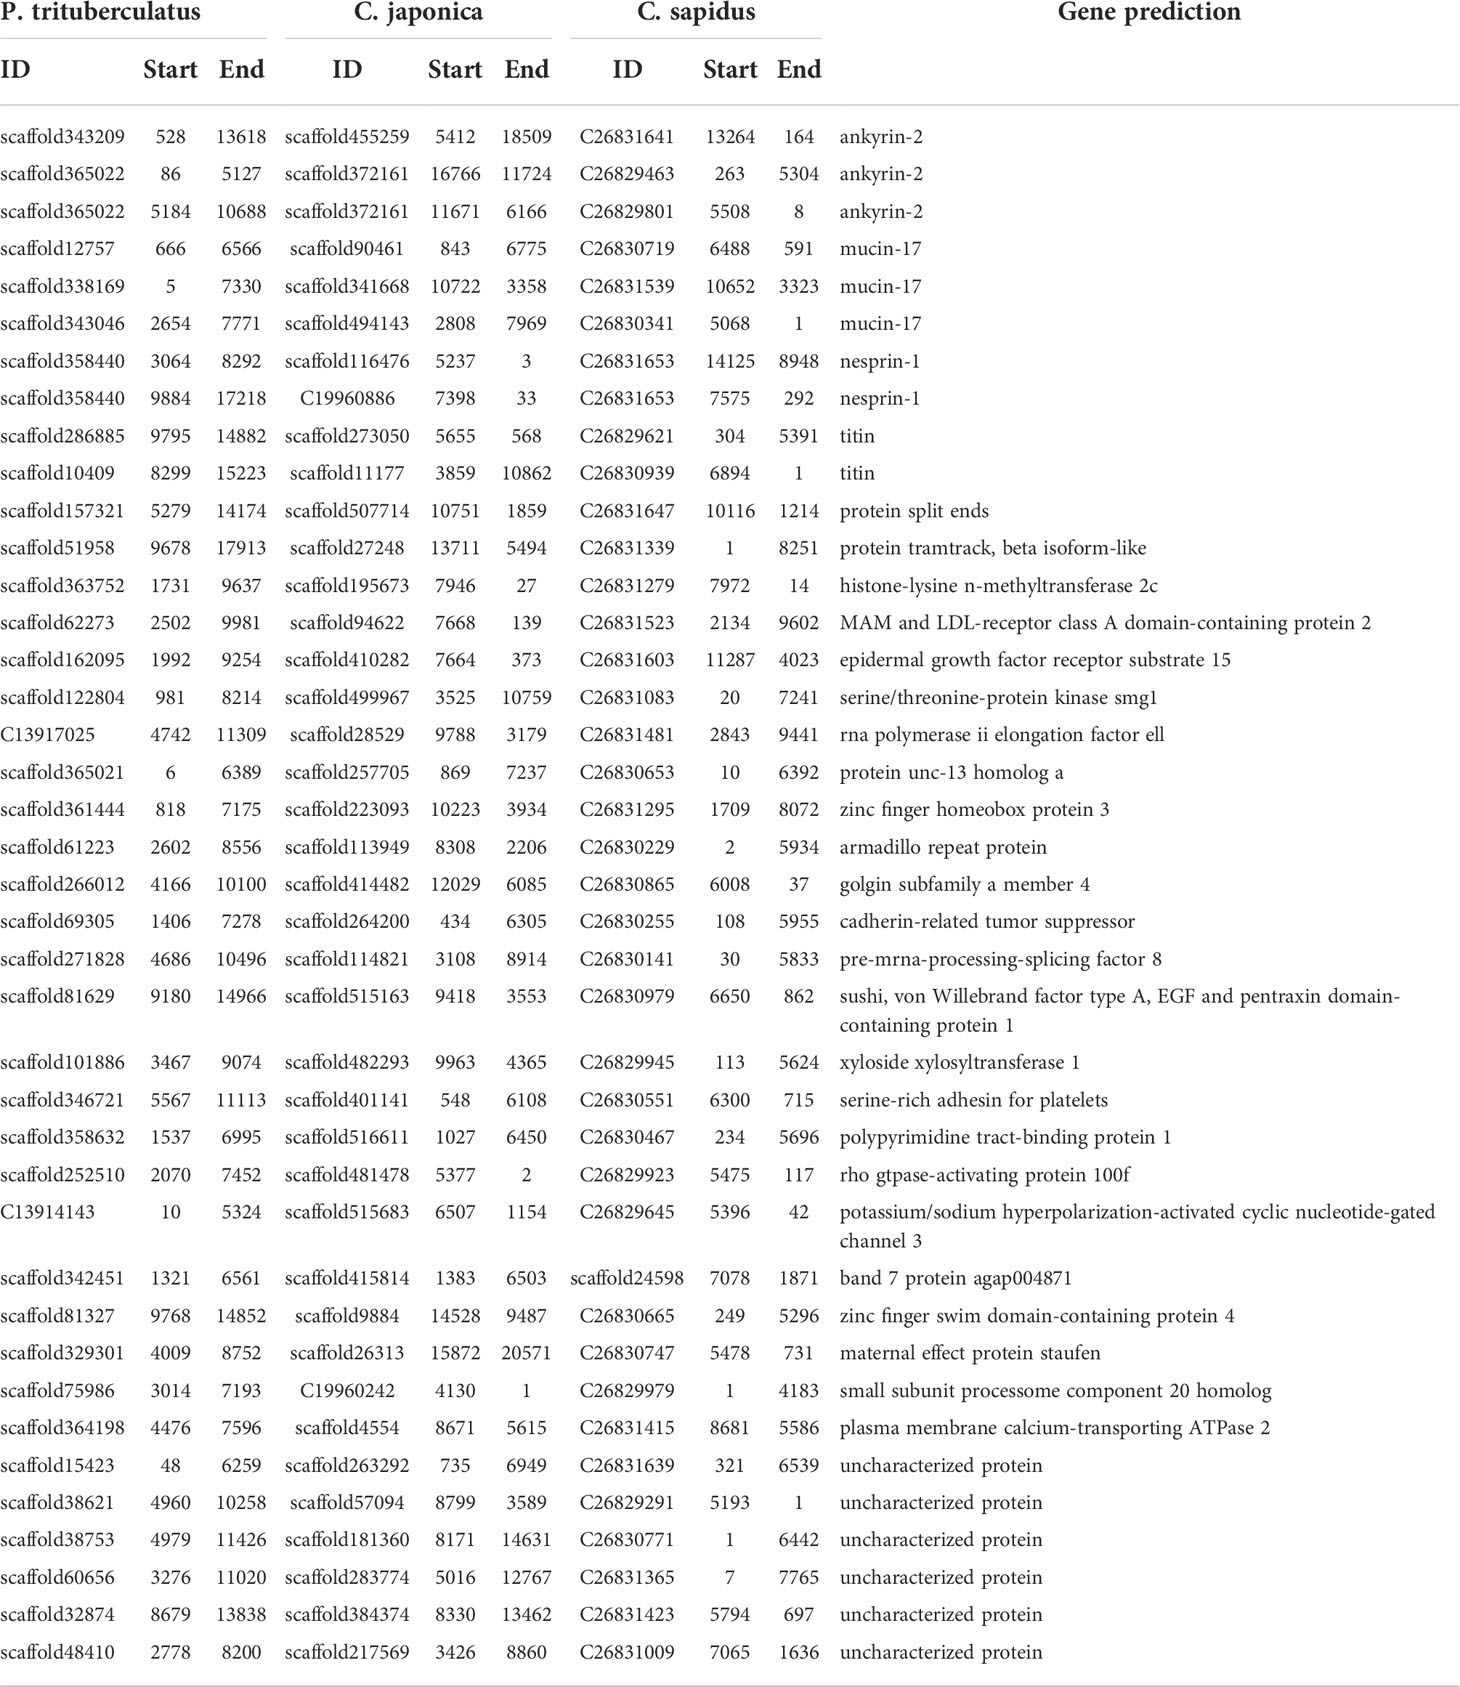
Table 5 Top 40 similar regions among the three crab species and their gene prediction .
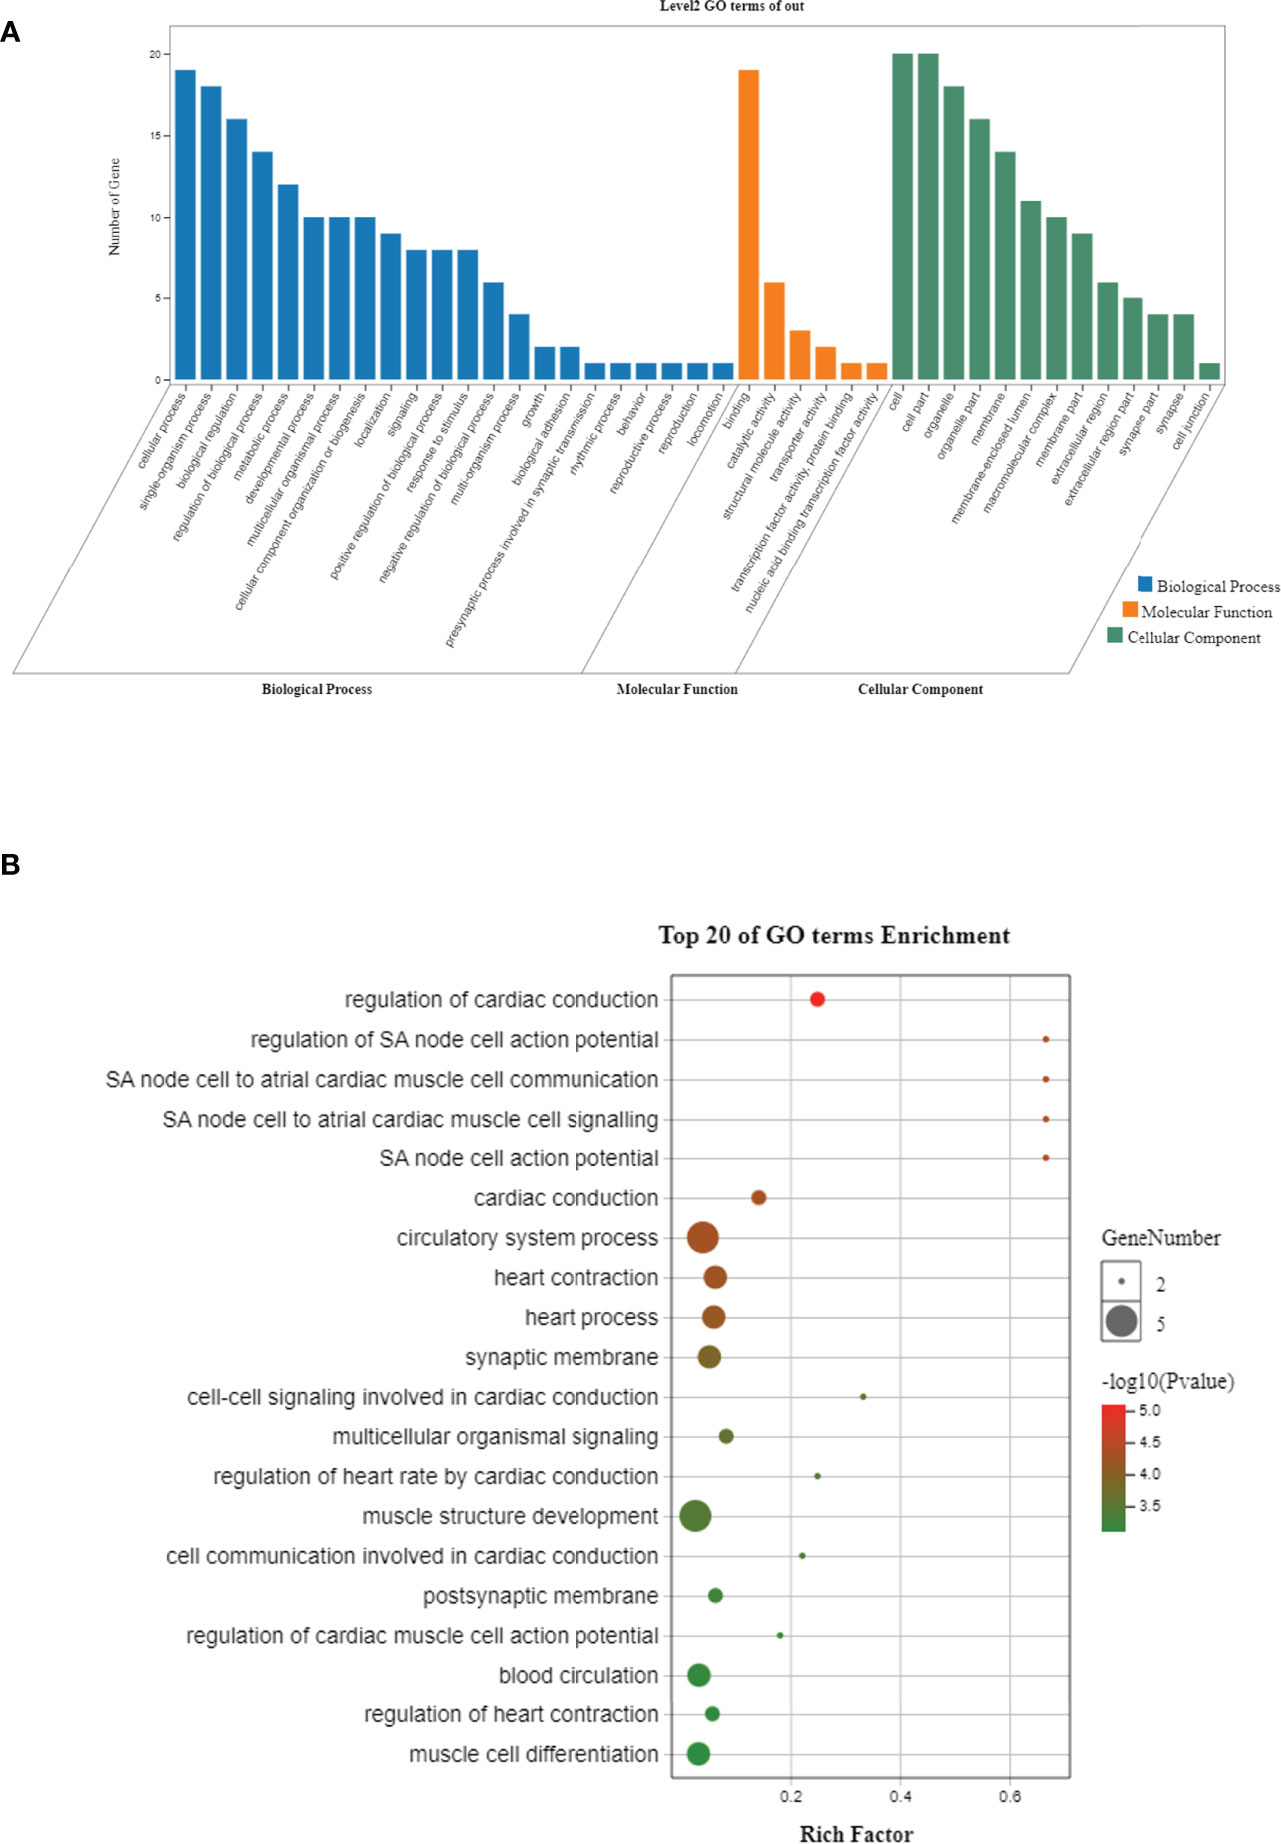
Figure 2 Histogram (A) and bubble plot (B) of Gene Ontology enrichment for the annotated similar regions.
The gene of ankyrin-2
The longest conserved region among the three species was found in the gene of ankyrin-2 (ANK2, Table 5). The whole length of P. trituberculatus ANK2 (PtANK2) is 391,211 bp, which has 34 isoforms with total of 25 - 43 exons (Tang et al., 2020). The identified conserved region in ANK2 consists of two separate fragments. The longer fragment (CF1) locates from 29,981,076 to 29,994,164 on Chromosome 46, which mostly locates in the intron area and contain 1 – 2 short exons. The shorter fragment (CF2) is a sequence of 10,602 bp that contains the longest exon of PtANK2. That exon appears in all isoforms (Figure 3). The PtANK2 protein contains a string of ankyrin repeats, a ZU5 domain and a DEATH domain in the first 1/3 region, the rest region is characterized by low complexity proteins where both CF1 and CF2 locate (Figure 3).
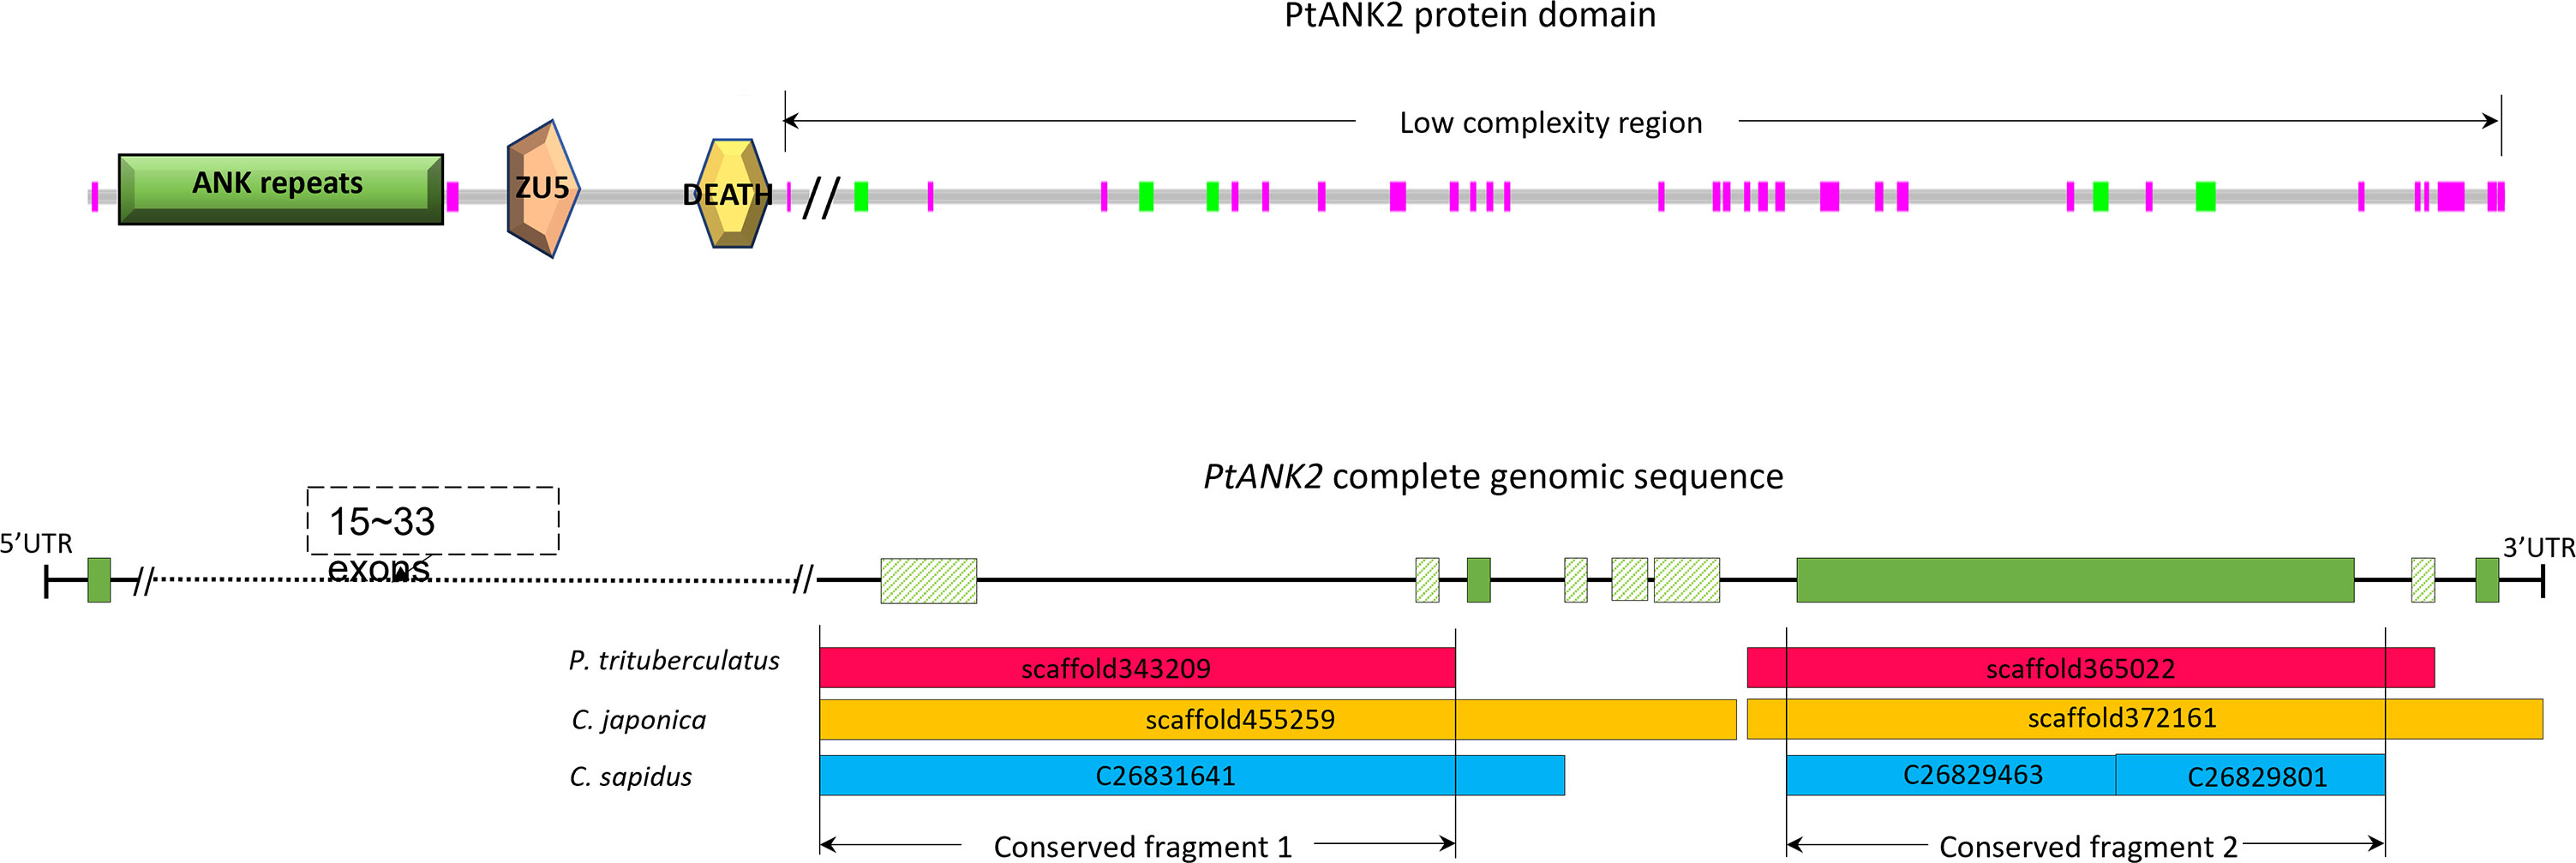
Figure 3 The illustration of the PtANK2 protein domain structure and the location of the two longest conserved region on PtANK2 gene.
The protein sequences translated from the long exon of CR2 were found highly conserved in other known-genome Decapoda species. Protein sequences from other 9 species including the Chinese mitten crab Eriocheir sinensis (Accession No.: PRJNA636904), the snow crab Chionoecetes opilio (PRJNA602365), the blue king crab Paralithodes platypus (PRJNA555178), the coconut crab Birgus latro (PRJNA704570), the American lobster Homarus americanus (PRJNA655509), the red swamp crayfish Procambarus clarkii (PRJNA727411), the Kuruma shrimp Penaeus japonicus (PRJDB11151), the whiteleg shrimp Penaeus vannamei (PRJNA438564), and Chinese white shrimp Penaeus chinensis (PRJNA691453) were extracted from their genome database in NCBI. The phylogenetic tree of the 12 species based on neighbor-joining method coincides with the current taxonomy and evolutionary relationship of Decapods (Figure 4). The P. trituberculatus and C. sapidus clustered first then connected to C. japonica. The three swimming crabs then grouped with the other two Brachyura crabs C. opilio and E. sinensis successively. B.latro and P. platypus forms a clade that belongs to Anomura. H. americanus and P. clarkia make up a cluster of Astacidea that consists of lobsters and crayfish. All Brachyura, Astacidea are infraorders of Pleocyemata suborder. The three prawn species belong to the other suborder Dendrobranchiata of Decapoda. The genetic distance reflected by tree branch length between Astacidea and prawns is smaller than that between either crab infraorder and prawns, indicating the lobsters and crayfish first diverged from prawn, this is consistent with “Carcinization” process (McLaughlin and Lemaitre, 1997).
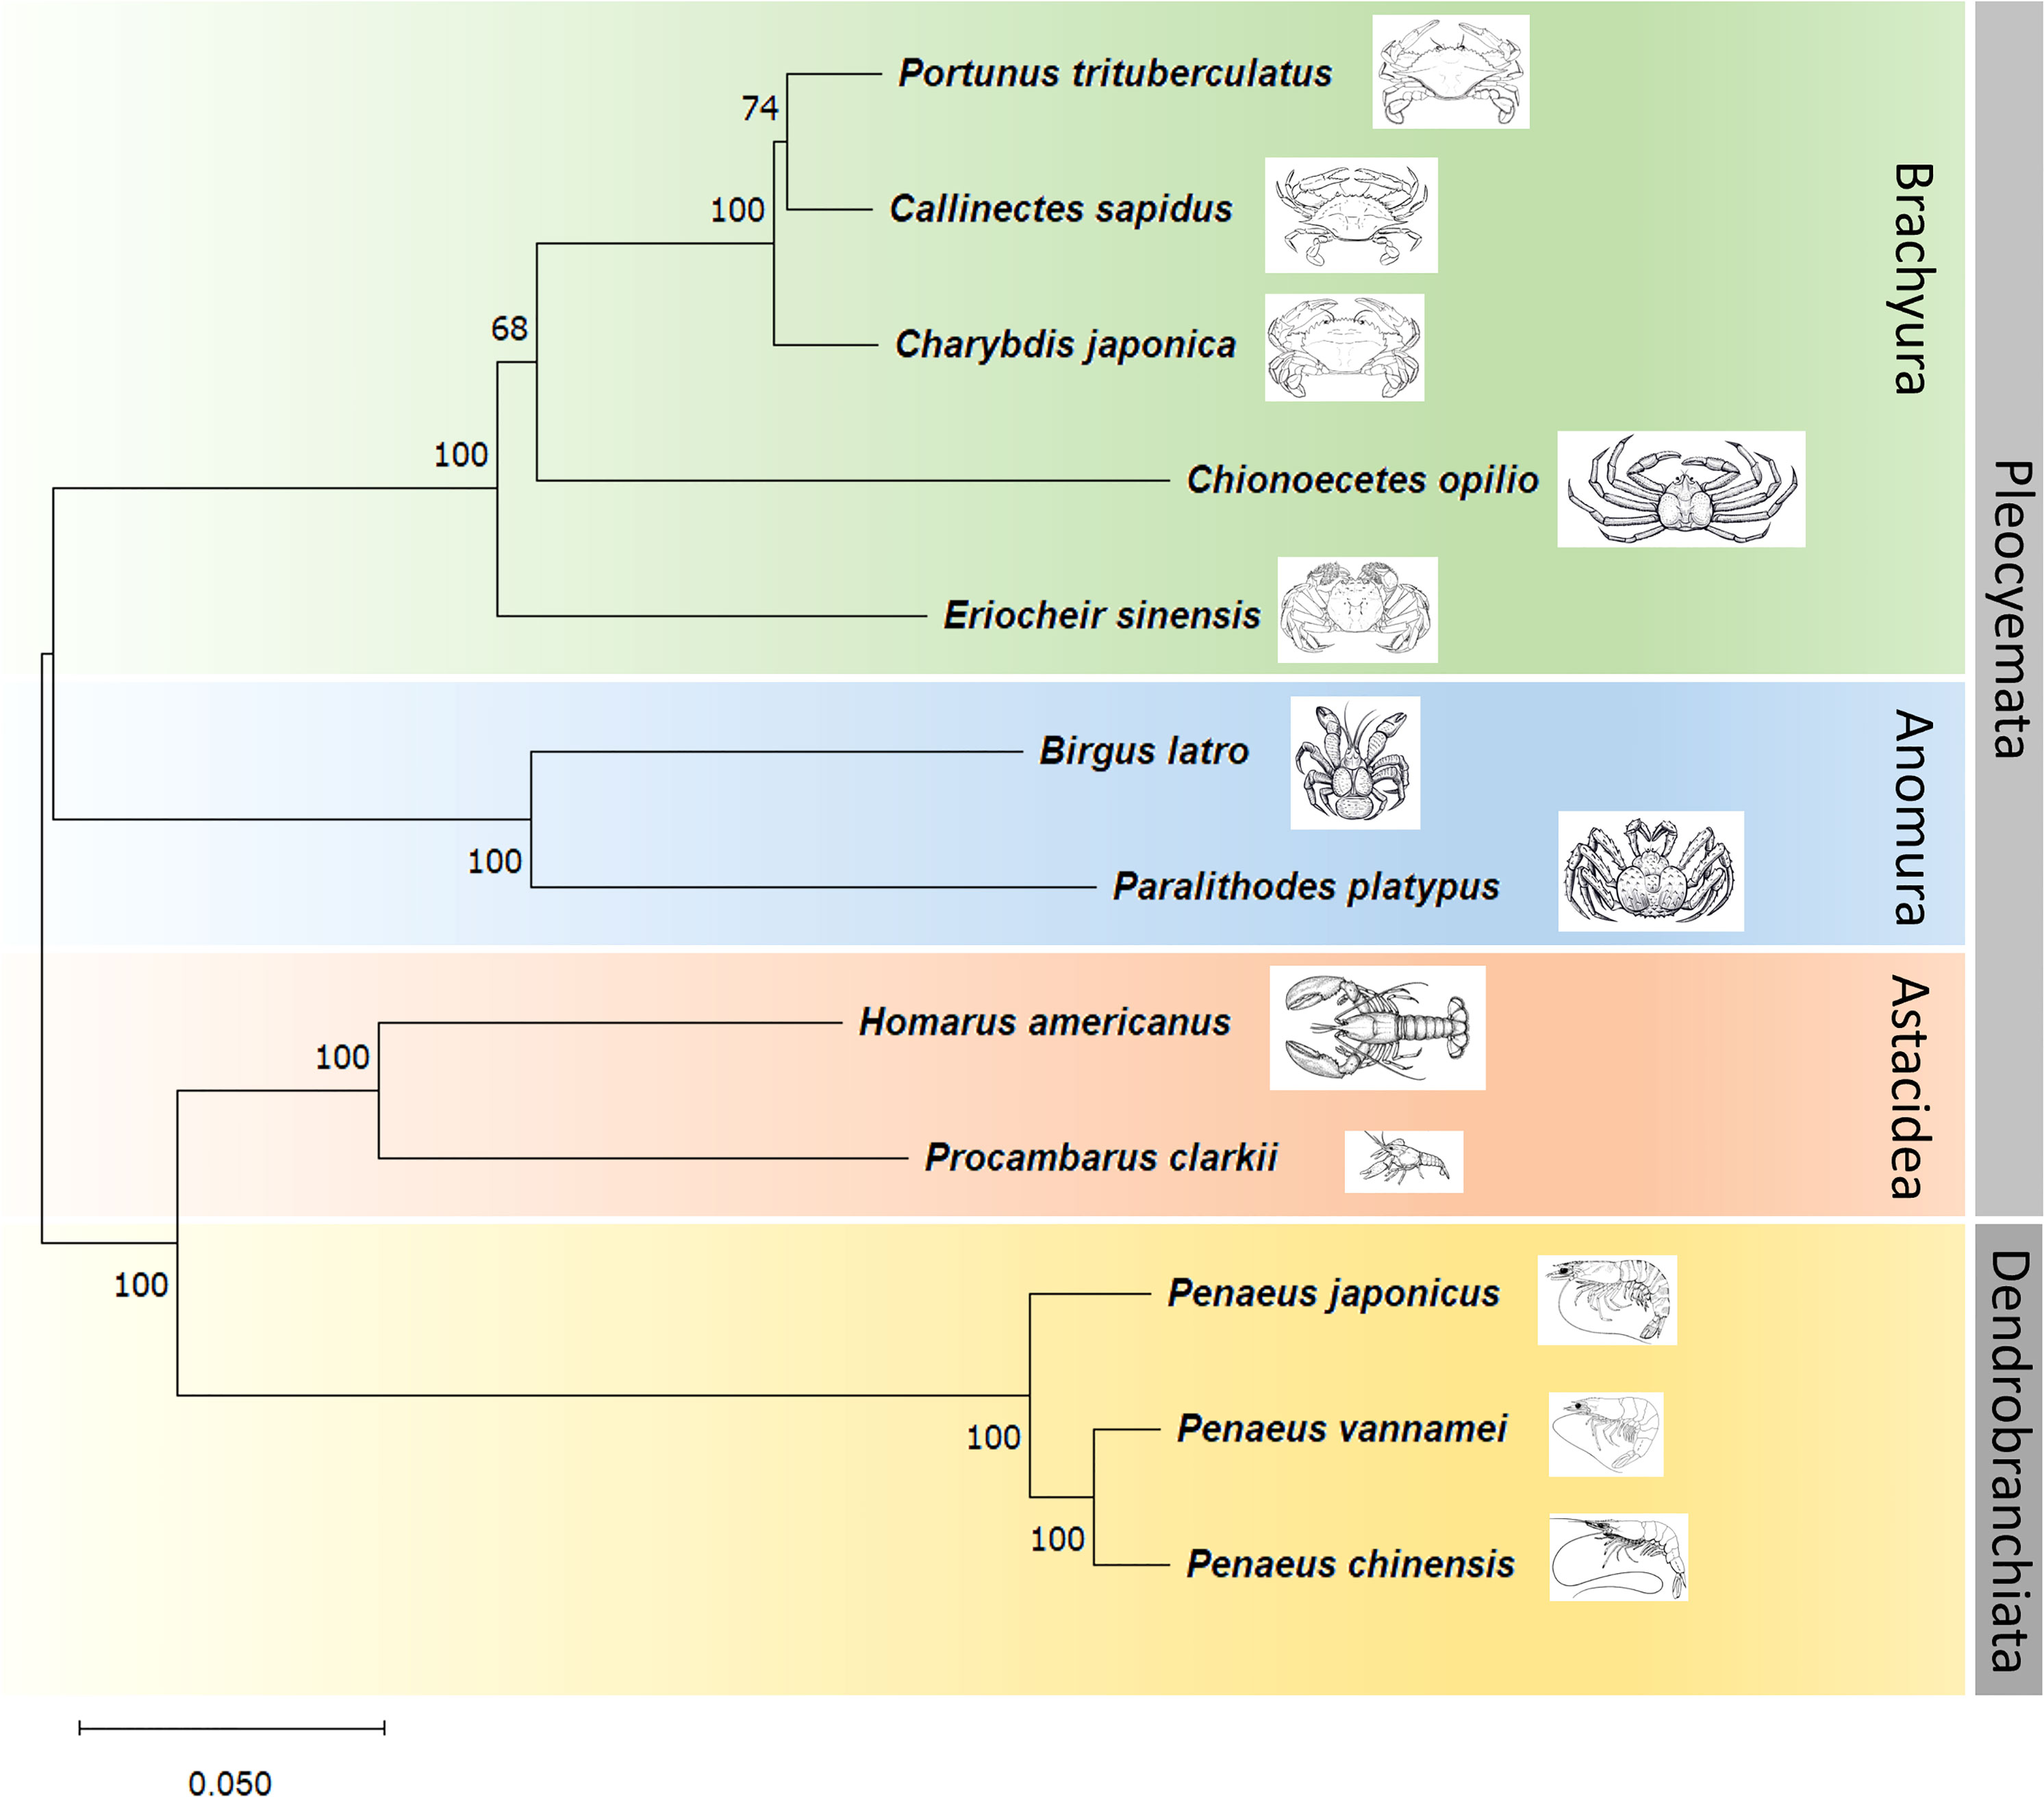
Figure 4 Neighbor-Joining tree based on the conserved ANK2 protein fragments of 12 Decapoda species.
Discussion
High genome heterozygosity and repeat sequence content
The heterozygosity is one of important characteristics of diploid or polyploid organism’s genome, which is caused by the genetic variations between different chromosomes. High heterozygosity has been a challenge for the estimation of genome size and genome assembly (Kajitani et al., 2014; Gao et al., 2018). For diploid or polyploid organisms, only the sequences from one set of chromosomes should be counted and assembled. However, the sequences from high heterozygous regions will be also included, therefore may double the region. On the K-mer depth frequency distribution curve, it often manifests as multiple peaks or tailing, which will cause deviation when estimating the expectation of the K-mer depth. The heterozygosity is usually used to divide genomes into low heterozygosity (0.5% ≤ heterozygous ratio <0.8%) and high heterozygosity (heterozygous ratio ≥0.8%) (Li et al., 2019). In this study, high heterozygosity was detected in all three crab species (>1.2%). The genome heterozygosity is generally high (ranging from 1% to 4%) for most crabs and bivalves according to the existing records (Cai et al., 2019; Bachvaroff et al., 2021; Penaloza et al., 2021; Tang et al., 2021), compared to fish genome with usually lower than 0.5% (Chen et al., 2020; Xu et al., 2020; Choi et al., 2021).
Organisms’ genome is also characterized of a certain fraction of repetitive sequences that may originated from DNA duplication and recombination during the evolution. The content of the repeat sequences increases from virus (<1%) to maize (77%; Gao et al., 2018). The human genome of about 66%–69% is repetitive (de Koning et al., 2011). When the repeat content is larger than 50%, it is recognized as high repetitive genome (Tang et al., 2015). In this study, the repeat sequences of all the three crab species are above 50%, the C. japonica and C. sapidus are larger than 60%. The assembly becomes very difficult for high repetitive genome when only using the next-generation short-read sequencing. The high heterozygosity and high repeat content of all the three crab species resulted in that the assembled scaffolds are very short. For high-quality assembly of a high heterozygosity and high repeat content genome, the combination method of second-generation short-read sequencing (Illumina) and third-generation long-read sequencing (PacBio) supplemented with Hi-C technology are usually used (Li et al., 2019; Tang et al., 2020; Bachvaroff et al., 2021).
Microsatellites is one kind of tandem repeat sequences typically with motif of 1–6 nucleotides (Richard et al., 2008). It is widely distributed on the whole genome, characterized by high polymorphism, co-dominant inheritance and easy to capture (Bhattarai et al., 2021). The microsatellites are very dense in the genomes of all the three species (~1,320/Mb). The microsatellite loci developed from this study provide useful tools for population genetics and selective breeding, such as fingerprinting, linkage mapping, parentage identification, or marker assisted selection etc.
Inconsistency between genome similarities and their taxonomy relationship
In taxonomy, both P. trituberculatus and C. sapidus are from Portuninae subfamily and they have more similar morphological appearance, compared to C. japonica that is from a different subfamily - Thalamitinae. The previous phylogenetic evolutionary trees constructed using mitochondrial DNA coding sequences also showed that P. trituberculatus and C. sapidus clustered together with small genetic distance and were in the Portuninae branch, which had an explicit separation with the Thalamitinae species that C. japonica is included (Mantelatto et al., 2018; Evans, 2018). Moreover, our phylogenetic tree constructed using a highly conserved ANK2 protein fragment is consistent with the phylogenetic and taxonomy relationship in which P. trituberculatus is closer with C. sapidus rather than C. japonica. However, for the comparison of genome similarity among three crab species based on the genome draft of this study, a high ANI was observed between P. trituberculatus and C. japonica that are from different subfamilies. It is very close to the ANI between P. trituberculatus and C. sapidus, the species within subfamily. In contrast, the C. sapidus genome is less similar with C. japonica that may reflect a normal subfamily-level differentiation. In addition, both the number and the cumulative length of the identified conserved regions (>1,000 bp and >5,000 bp) between P. trituberculatus and C. japonica are larger than those between P. trituberculatus and C. sapidus, which may indicate the genome of P. trituberculatus is more similar with C. japonica compared to C. sapidus.
We speculate that the high genome similarity between P. trituberculatus and C. japonica might be attributed to their similar living environments. Both P. trituberculatus and C. japonica occupy the same areas across the western coast of Pacific, while C. sapidus lives in the west coasts of Atlantic which is totally separate in geography from P. trituberculatus’ inhabit range, where the hydrological conditions, climate and biological communities are different. The environment cannot change the genome directly but may play as a selection pressure to impact the genome evolution. Based on the theories of natural selection (Darwin, 1859) and modern synthesis (Fisher, 1958; Wright, 1932; Dobzhansky, 1937), mutations randomly occurred in the genome of organisms, the genome evolved by retaining the mutations that adapt to selection pressures and wiping out the ones that do not adapt.
However, the inconsistency between entire genome similarities and phylogenetic evolutionary relationship inferred from previous studies might be caused by the difference of rate of evolution between coding DNA (cDNA) and non-coding DNA (ncDNA). The organism’s genome consists of coding cDNA and ncDNA sequences. The cDNA encodes proteins that are the basic component for the cell structure, function, and regulation of the body’s tissues and organs, but only comprises 1% of the entire genome (Rands et al., 2014), whereas the other 99% does not encode any proteins which had been ever thought as useless “junk” (Ohno, 1972). The cDNA has much slower mutation rate than ncDNA (Kimura, 1983) because they are so related to the life activities of the organisms and therefore the mutations are hardly retained. Compared to cDNA, the super high occupation ratio of ncDNA on the genome means much higher mutation occurring frequency and more mutations. Because they do not encode protein, their mutations would have higher possibility to be retained. Despite the mutations are considered occurring neutrally based on the neutral theory (Kimura, 1983), they are subject to selection as long as the genome region where they are located are functional. It is becoming clear that the ncDNA plays essential roles in the regulation of gene expression (Ludwig, 2016). A comparative genome study between D. melanogaster and its related sibling species D. simulans demonstrated that a large fraction of ncDNA regions is functionally important and subject to both purifying selection and adaptive evolution. Adaptive changes to ncDNA might have been considerably more common in the evolution of D. melanogaster (Andolfatto, 2005). High mutation occurrence and subjecting to selection for ncDNA make it possible that the similarity in the entire-genome is higher than some conserved cDNA sequences between related species that live in the same environment.
Arkyrin-2 gene and its conservative protein fragment in Decapoda
The identified longest conserved region in all three crab species is contained in the arkyrin-2 gene (ANK2). The ANK2 encodes a member of the ankyrin protein family that are adapters facilitating the local organization of integral membrane proteins with cytoskeletal elements (Cunha and Mohler, 2008; National Center for Biotechnology Information (NCBI), 2022). The ankyrin protein also play important roles in activities such as cell motility, activation, proliferation, contact and the maintenance of specialized membrane domains (National Center for Biotechnology Information (NCBI), 2022). This protein is active in many cell types, particularly in the brain and in cardiac muscle. It interacts with ion channels and ion transporters that generates the electrical signals controlling the heartbeat and maintain a normal heart rhythm (Mohler and Bennett, 2005; Cunha and Mohler, 2008). Such function of ANK2 coincides with the GO enrichment result those the most significant gene ontologies are cardiac-related. Most ankyrins are typically composed of three structural domains: a consecutive ANK repeats (EMBL-EBI ID: IPR002110) that associate with ion channels, transporters, and cell adhesion molecules, such as the Na+/Ca2+ exchanger and Na/K-ATPase; a central region with a highly conserved spectrin binding domain (ZU5, EMBL-EBI ID: IPR000906) that participates in induction of apoptosis and binding of melanoma-associated antigen; and an Alpha-helical domain (Death, EMBL-EBI ID: IPR000488) that is related in sequence and structure to the death effector domain and the caspase recruitment domain. None of the similar regions that we identified spans the domain area, this is because the proteins of this area are encoded by very short exons, the genetic variations in introns are more than those in exons, the longer exons mainly distribute in the second half area, thus the similar regions (>1,000 bp) are mostly detected in this area. The mRNA of ANK2 contain multiple isoforms. The number of isoforms is very high in some known Decapoda genomes (P. trituberculatus: 38; H. americanus:32; P. japonicus: 34). These isoforms are generated by alternative splicing. Alternative splicing is the primary mechanism through which the genome generates mRNA and protein diversity from a given coding repertoire. Alternative splicing plays important roles in regulating development, physiology and homeostatis, providing an alternative program in response to environmental stress (Mastrangelo et al., 2012; Kelemen et al., 2013; Liu and Guo, 2017). The P. trituberculatus ANK2 contains 25 ~ 43 exons, almost all of which are missing in some isoforms except the longest exon close to the 3’ end. That exon is included in one of the two longest conserved regions (CR2, Figure 3).
The protein sequence translated by this exon is found very conserved in other Decapoda species. The phylogenetic analysis using this protein fragment from 12 Decapoda species revealed a clear taxonomy and evolution relationship. The specification of crabs referring to a “Carcinization” or “Brachyurization” (McLaughlin and Lemaitre, 1997). Under that hypothesized scenario, the prawns (Dendrobranchiata) first diverged from Decapod ancestors, then a group evolved from swimming to crawling to walking (Reptantia, the ancestors of lobster/crayfish and crabs), during this process, their abdomen and tail gradually become short and flat, and start folding toward below the carapace, finally a clade of this group formed the nowadays’ crab shape. In the phylogenetic tree, the genetic relationship between lobster/crayfish and crabs is closer than that between lobster/crayfish and prawns or between crabs and prawns, indicating later divergence of these two clades, however, the genetic distance between lobster/crayfish and prawns is smaller than that between crabs and prawns indicating the lobster/crayfish first diverged from prawns and their appearance is also more like the spawns than crabs. The evolution of this ANK2 gene may occur accompanying the evolution process of the species.
Data Availability Statement
The data presented in the study are deposited in the National Center for Biotechnology Information https://www.ncbi.nlm.nih.gov/, accession numbers are SAMN26565628, SAMN26565629 and SAMN26565630.
Author Contributions
Conceptualization: ML and SG; methodology: ML, SG, and SB; software: ML; formal analysis: ML, SG, and SB; data interpretation: ML and YJ; writing original draft preparation: ML and SB; writing review and editing: all authors; visualization: CG and YW; supervision: CF and HL; funding acquisition: HL and CF. All authors contributed to the article and approved the submitted version.
Funding
This research was supported by China Agriculture Research System of MOF and MARA, Modern Agriculture Technology - Shrimp and Crab Technical System of Shandong Province # SDAIT-13. It was also partially supported by the NSF award #2022887 to the Morgan State University.
Conflict of Interest
The authors declare that the research was conducted in the absence of any commercial or financial relationships that could be construed as a potential conflict of interest.
Publisher’s Note
All claims expressed in this article are solely those of the authors and do not necessarily represent those of their affiliated organizations, or those of the publisher, the editors and the reviewers. Any product that may be evaluated in this article, or claim that may be made by its manufacturer, is not guaranteed or endorsed by the publisher.
Supplementary Material
The Supplementary Material for this article can be found online at: https://www.frontiersin.org/articles/10.3389/fmars.2022.895119/full#supplementary-material
Supplementary Table 1 | Statistics of microsatellite loci for the three crab species
Supplementary Table 2 | The primer information of identified unique microsatellite makers.
Supplementary Table 3 | The identified similar regions of alignment length of >1,000 bp among three crab species.
Supplementary Figure 1 | K-mer depth distribution curves of three crab species that are generated by GenomeScope. The X-axis is the coverage (depth) of K-mer and the Y-axis is the frequency of the K-mer at that depth.
Supplementary Figure 2 | The top 20 microsatellite motifs with highest occurrence frequencies (A), and the top 9 scaffolds with most microsatellite distribution (B) in the three crab species.
References
Altschul S. F., Madden T. L., Schäffer A. A., Zhang J., Zhang Z., Miller W., et al. (1997). Gapped BLAST and PSI-BLAST: a new generation of protein database search programs. Nucleic Acids Res. 25 (17), 3389–3402. doi: 10.1093/nar/25.17.3389
Anderson J. A., Alford A. B. (2014). Ghost fishing activity in derelict blue crab traps in Louisiana. Mar. pollut. Bull. 79 (1-2), 261–267. doi: 10.1016/j.marpolbul.2013.12.002
Andolfatto P. (2005). Adaptive evolution of non-coding DNA in drosophila. Nature 437 (7062), 1149–1152. doi: 10.1038/nature04107
Bachvaroff T. R., McDonald R. C., Plough L. V., Chung J. S. (2021). Chromosome-level genome assembly of the blue crab, callinectes sapidus. G3 11 (9), jkab212. doi: 10.1093/g3journal/jkab212
Benestan L. M., Ferchaud A. L., Hohenlohe P. A., Garner B. A., Naylor G. J., Baums I. B., et al. (2016). Conservation genomics of natural and managed populations: building a conceptual and practical framework. Mol. Eol. 25, 2967–2977. doi: 10.1111/mec.13647
Bhattarai G., Shi A., Kandel D. R., Solís-Gracia N., da Silva J. A., Avila C. A. (2021). Genome-wide simple sequence repeats (SSR) markers discovered from whole-genome sequence comparisons of multiple spinach accessions. Sci. Rep. 11 (1), 1–6. doi: 10.1038/s41598-021-89473-0
Cai H., Li Q., Fang X., Li J., Curtis N. E., Altenburger A., et al. (2019). A draft genome assembly of the solar-powered sea slug elysia chlorotica. Sci. Data 6 (1), 1–3. doi: 10.1038/sdata.2019.22
Chen B., Sun Z., Lou F., Gao T. X., Song N. (2020). Genomic characteristics and profile of microsatellite primers for acanthogobiusommaturus by genome survey sequencing. Biosci. Rep. 40 (11):BSR20201295. doi: 10.1042/BSR20201295
Choi E., Kim S. H., Lee S. J., Jo E., Kim J., Kim J. H., et al. (2021). A first genome survey and genomic SSR marker analysis of trematomusloennbergii Regan 1913. Animals 11 (11), 3186. doi: 10.3390/ani11113186
Ciufo S., Kannan S., Sharma S., Badretdin A., Clark K., Turner S., et al. (2018). Using average nucleotide identity to improve taxonomic assignments in prokaryotic genomes at the NCBI. Int. J. Systemat. Evol. Microbiol. 68 (7), 2386. doi: 10.1099/ijsem.0.002809
Cunha S. R., Mohler P. J. (2008). Obscurin targets ankyrin-b and protein phosphatase 2A to the cardiac m-line. J. Biol. Chem. 283 (46), 31968–31980. doi: 10.1074/jbc.M806050200
Darwin C. (1859). On the origin of species by means of natural selection, or, the preservation of favoured races in the struggle for life (London: J. Murray).
de Grave S., Pentcheff N. D., Ahyong S. T., Chan T. Y., Crandall K. A., Dworschak P. C, et al. (2009). A classification of living and fossil genera of decapod crustaceans. raffles bull zool suppl. 21:1–109. Raffles Bull Zool Suppl. 211–109
de koning A. J., Gu W., Castoe T. A., Batzer M. A., Pollock D. D. (2011). repetitive elements may comprise over two-thirds of the human genome. PloS Genet. 7 (12), e1002384. doi: 10.1371/journal.pgen.1002384
Delcher A. L., Salzberg S. L., Phillippy A. M. (2003). Using MUMmer to identify similar regions in large sequence sets. Curr. Protoc. Bioinf. 1), 10–13. doi: 10.1002/0471250953.bi1003s00
European Molecular Biology Laboratory (EMBL) (European Bioinformatics Institute (EBI). Available at: https://www.ebi.ac.uk/.
Evans N. (2018). Molecular phylogenetics of swimming crabs (Portunoidea rafinesque 1815) supports a revised family-level classification and suggests a single derived origin of symbiotic taxa. PeerJ 6, e4260. doi: 10.7717/peerj.4260
Food and Agriculture Organization (FAO) (2021). Global capture production 1950-2019. Available at: https://www.fao.org/figis/servlet/TabSelector
Gao S. H., Yu H. Y., Wu S. Y., Wang S., Geng J. N., Luo Y. F., et al. (2018). Advances of sequencing and assembling technologies for complex genomes. Yi. Chuan Hereditas. 40 (11), 944–963. doi: 10.16288/j.yczz.18-255
Gosselin S., Fullmer M. S., Feng Y., Gogarten J. P. (2022). Improving phylogenies based on average nucleotide identity, incorporating saturation correction and nonparametric bootstrap support. Sys. Biol. 71 (2), 396–409. doi: 10.1093/sysbio/syab060
Gu X. L., Qiao Z. G. (2012). Progress of the crab seed cultivation in earthen pond in China. Mar. Fish. 34, 110–116. doi: 10.13233/j.cnki.mar.fish.2012.01.017
Hines A. H. (2007). “Ecology of juvenile and adult blue crabs,” in Kenney V. S., Cronin E. Biology of the blue crab 575–665. College Park, Maryland: Maryland Sea Grant Program
Jain C., Rodriguez-R L. M., Phillippy A. M., Konstantinidis K. T., Aluru S. (2018). High throughput ANI analysis of 90K prokaryotic genomes reveals clear species boundaries. Nat. Commun. 9 (1), 1–8. doi: 10.1038/s41467-018-07641-9
Kajitani R., Toshimoto K., Noguchi H., Toyoda A., Ogura Y., Okuno M., et al. (2014). Efficient de novo assembly of highly heterozygous genomes from whole-genome shotgun short reads. Genome Res. 24 (8), 1384–1395. doi: 10.1101/gr.170720.113
Kelemen O., Convertini P., Zhang Z., Wen Y., Shen M., Falaleeva M., et al. (2013). Function of alternative splicing. Gene 514 (1), 1–30. doi: 10.1016/j.gene.2012.07.083
Kimura M. (1983). The neutral theory of molecular evolution (Cambridge: Cambridge University Press).
Krisfalusi-Gannon J., Ali W., Dellinger K., Robertson L., Brady T. E., Goddard M. K., et al. (2018). The role of horseshoe crabs in the biomedical industry and recent trends impacting species sustainability. Front. Mar. Sci. 185. doi: 10.3389/fmars.2018.00185
Letunic I., Khedkar S., Bork P. (2021a). SMART: recent updates, new developments and status in 2020. Nucleic Acids Res. 49 (D1), D458–D460. doi: 10.1093/nar/gkaa937
Letunic I., Khedkar S., Bork P. (2021b). SMART: recent updates, new developments and status in 2020. Nucleic Acids Res. 49 (D1), D458–D460. doi: 10.1093/nar/gkaa937
Lipcius R. N., Eggleston D. B., Heck K. L. Jr., Seitz R. D., van Montrans J. (2007). “Post-settlement abundance, survival, and growth of postlarvae and young juvenile blue crabs in nursery habitats,” in The blue crab callinectes sapidus (Maryland: Maryland Sea Grant College, College Park), 535–564.
Li G. Q., Song L. X., Jin C. Q., Li M., Gong S. P., Wang Y. F. (2019). Genome survey and SSR analysis of apocynum venetum. Biosci. Rep. 39 (6). doi: 10.1042/BSR20190146
Liu H. J., Dai Y. R. (2000) 24 (8), 23–27. Studies on the Technique for Seed Rearing and the Culture of Charybdis (charybdis) japonicus. Marine Sciences – Qingdao- Chinese Edition.
Liu M., Guo X. (2017). A novel and stress adaptive alternative oxidase derived from alternative splicing of duplicated exon in oyster crassostrea virginica. Sci. Rep. 7 (1), 1–0. doi: 10.1038/s41598-017-10976-w
Liu B., Shi Y., Yuan J., Hu X., Zhang H., Li N, et al. (2013). Estimation of genomic characteristics by analyzing k-mer frequency in de novo genome projects. Cornell University, arXiv preprint arXiv:1308.2012. doi: 10.48550/arXiv.1308.2012
Lohani U. (2011). Traditional uses of animals among jirels of central Nepal. Ethno. Med. 5 (2), 115–124. doi: 10.1080/09735070.2011.11886398
Long W. C., Grow J. N., Majoris J. E., Hines A. H. (2011). Effects of anthropogenic shoreline hardening and invasion by phragmites australis on habitat quality for juvenile blue crabs (Callinectes sapidus). J. Exp. Mar. Biol. Ecol. 409 (1-2), 215–222. doi: 10.1016/j.jembe.2011.08.024
Ludwig M. Z. (2016). Noncoding DNA evolution: junk DNA revisited. Ency. Evol. Biol. 3, 124–129. doi: 10.1016/B978-0-12-800049-6.00168-2
Luo R., Liu B., Xie Y., Li Z., Huang W., Yuan J., et al. (2012). SOAPdenovo2: an empirically improved memory-efficient short-read de novo assembler. Gigascience 1 (1), 2047–217X. doi: 10.1186/2047-217X-1-18
Manolio T. A. (2013). Bringing genome-wide association findings into clinical use. Nat. Rev. Genet. 14 (8), 549–558. doi: 10.1038/nrg3523
Mantelatto F. L., Robles R., Wehrtmann I. S., Schubart C. D., Felder D. L. (2018). New insights into the molecular phylogeny of the swimming crabs of the genera portunus weber 1795 and achelous de haan 1833 (Brachyura: Portunidae) of the americas. J. Crustacean. Biol. 38 (2), 190–197. doi: 10.1093/jcbiol/rux119
Marçais G., Delcher A. L., Phillippy A. M., Coston R., Salzberg S. L., Zimin A. (2018). MUMmer4: A fast and versatile genome alignment system. PLoS Comput. Biol. 14 (1), e1005944. doi: 10.1371/journal.pcbi.1005944
Marçais G., Kingsford C. (2011). A fast, lock-free approach for efficient parallel counting of occurrences of k-mers. Bioinformatics 27 (6), 764–770.
Mastrangelo A. M., Marone D., Laidò G., De Leonardis A. M., De Vita P. (2012). Alternative splicing: enhancing ability to cope with stress via transcriptome plasticity. Plant Sci. 185, 40–49. doi: 10.1016/j.plantsci.2011.09.006
McLaughlin P. A., Lemaitre R. (1997). Carcinization in the anomura-fact or fiction? i. evidence from adult morphology. Contri. To. Zool. 67 (2), 79–123.
Meuwissen T., Hayes B., Goddard M. (2016). Genomic selection: A paradigm shift in animal breeding. Anim. Front. 6 (1), 6–14. doi: 10.2527/af.2016-0002
Mohler P. J., Bennett V. (2005). Ankyrin-based cardiac arrhythmias: a new class of channelopathies due to loss of cellular targeting. Curr. Opin. Cardiol. 20 (3), 189–193. doi: 10.1097/01.hco.0000160372.95116.3e
National Center for Biotechnology Information (NCBI) (2022) Gene, ANK2 ankyrin 2 [Homo sapiens (human)]. Available at: https://www.ncbi.nlm.nih.gov/gene/287.
National Oceanic and Atmospheric Administration (NOAA) Fisheries (2022) Annual commercial landing statistics. Available at: https://www.fisheries.noaa.gov/foss.
Ng P. K., Guinot D., Davie P. J. (2008). Systema brachyurorum: Part i. an annotated checklist of extant brachyuran crabs of the world. Faffle. Bull. Zool. 17 (1), 1–286.
Ohno S. (1972). So much'junk'DNA in our genome. In Evolution of Genetic Systems, Brookhaven. Symp. Biol., 366–370.
Penaloza C., Gutierrez A. P., Eory L., Wang S., Guo X., Archibald A. L., et al. (2021). A chromosome-level genome assembly for the pacific oyster crassostrea gigas. GigaScience 10 (3), giab020. doi: 10.1093/gigascience/giab020
Primmer C. R. (2009). From conservation genetics to conservation genomics. Ann. New York. Acad. Sci. 1162 (1), 357–368. doi: 10.1111/j.1749-6632.2009.04444.x
Quinlan A. R., Hall I. M. (2010). BEDTools: a flexible suite of utilities for comparing genomic features. Bioinformatics 26 (6), 841–842. doi: 10.1093/bioinformatics/btq033
Rands C. M., Meader S., Ponting C. P., Lunter G. (2014). 8.2% of the human genome is constrained: variation in rates of turnover across functional element classes in the human lineage. PLoS Genet. 10 (7), e1004525. doi: 10.1371/journal.pgen.1004525
Rangwala S. H., Kuznetsov A., Ananiev V., Asztalos A., Borodin E., Evgeniev V., et al. (2021). Accessing NCBI data using the NCBI sequence viewer and genome data viewer (GDV). Genome Res. 31 (1), 159–169. doi: 10.1101/gr.266932.120
Richard G. F., Kerrest A., Dujon B. (2008). Comparative genomics and molecular dynamics of DNA repeats in eukaryotes. Microbiol. Mol. Biol. Rev. 72 (4), 686–727. doi: 10.1128/MMBR.00011-08
Roth S. C. (2019). What is genomic medicine? J. Med. Lib. Ass.: JMLA. 107 (3), 442. doi: 10.5195/jmla.2019.604
Saitou N., Nei M. (1987). The neighbor-joining method: a new method for reconstructing phylogenetic trees. Mol. Biol. Evol. 4 (4), 406–425.
Tamura K., Stecher G., Kumar S. (2021). MEGA11: molecular evolutionary genetics analysis version 11. Mol. Biol. Evol. 38 (7), 3022–3027. doi: 10.1093/molbev/msab120
Tang Q., Ma X.J., Mo C.M., Pan L.M., Wei R.C., Zhao H., Xuan F., et al. (2015). Genome survey analysis in Siraitia grosvenorii. Guihaia 6, 789–791. doi: 10.11931/guihaia.gxzw201404041
Tang B., Zhang D., Li H., Jiang S., Zhang H., Xuan F., et al. (2020). Chromosome-level genome assembly reveals the unique genome evolution of the swimming crab (Portunus trituberculatus). GigaScience 1, giz161. doi: 10.1093/gigascience/giz161
Tang B., Wang Z., Liu Q., Wang Z., Ren Y., Guo H., et al. (2020). Chromosome–level genome assembly of Paralithodes platypus provides insights into evolution and adaptation of king crabs. Mol. Ecol. Resour. 21 (2), 511–525. doi: 10.1111/1755-0998.13266
Tsang L. M., Schubart C. D., Ahyong S. T., Lai J. C., Au E. Y., Chan T. Y., et al. (2014). Evolutionary history of true crabs (Crustacea: Decapoda: Brachyura) and the origin of freshwater crabs. Mol. Biol. Evol. 31 (5), 1173–1187. doi: 10.1093/molbev/msu068
Varshney R. K., Terauchi R., McCouch S. R. (2014). Harvesting the promising fruits of genomics: applying genome sequencing technologies to crop breeding. PLoSbiology 12 (6), e1001883. doi: 10.1371/journal.pbio.1001883
Vurture G. W., Sedlazeck F. J., Nattestad M., Underwood C. J., Fang H., Gurtowski J., et al. (2017). GenomeScope: fast reference-free genome profiling from short reads. Bioinformatics 33 (14), 2202–2204. doi: 10.1093/bioinformatics/btx153
Wang X., Wang L. (2016). GMATA: an integrated software package for genome-scale SSR mining, marker development and viewing. Front. Plant Sci. 7, 1350. doi: 10.3389/fpls.2016.01350
Wright S. (1932). The roles of mutation, inbreeding, crossbreeding, and selection in evolution. Proc. VI. Int. Congress. Genetrics. 1, 356–366.
Xu S. Y., Song N., Xiao S. J., Gao T. X. (2020). Whole genome survey analysis and microsatellite motif identification of sebastiscusmarmoratus. Biosci. Rep. 40 (2), BSR20192252. doi: 10.1042/BSR20192252.
Yu A. M., Choi Y. H., Tu M. J.. (2021). RNA drugs and RNA targets for small molecules: principles, progress, and challenges. Pharmacol. Rev. 72 (4), 862–898. doi: 10.1124/pr.120.019554
Keywords: Portunus trituberculatus, Charybdis japonica, Callinectes sapidus, genome heterozygosity, genome repeat sequences, genome similarity, environment selection, ankyrin-2
Citation: Liu M, Ge S, Bhandari S, Fan C, Jiao Y, Gai C, Wang Y and Liu H (2022) Genome characterization and comparative analysis among three swimming crab species. Front. Mar. Sci. 9:895119. doi: 10.3389/fmars.2022.895119
Received: 13 March 2022; Accepted: 01 July 2022;
Published: 27 July 2022.
Edited by:
Libin Zhang, Institute of Oceanology (CAS), ChinaReviewed by:
Zhiqiang Han, Zhejiang Ocean University, ChinaYinghui Dong, Zhejiang Wanli University, China
Louis V. Plough, University of Maryland, United States
Copyright © 2022 Liu, Ge, Bhandari, Fan, Jiao, Gai, Wang and Liu. This is an open-access article distributed under the terms of the Creative Commons Attribution License (CC BY). The use, distribution or reproduction in other forums is permitted, provided the original author(s) and the copyright owner(s) are credited and that the original publication in this journal is cited, in accordance with accepted academic practice. No use, distribution or reproduction is permitted which does not comply with these terms.
*Correspondence: Ming Liu, ming.liu@morgan.edu; Shanshan Ge, ge_gss@163.com; Hongjun Liu, hongjunl@126.com