Is Amazon.com Inc (AMZN) Significantly Undervalued? A Comprehensive GF Value Analysis
Amazon.com Inc (NASDAQ:AMZN) recently saw a daily gain of 2.95%, with an Earnings Per Share (EPS) of $0.42. This article aims to answer the question: Is Amazon.com (NASDAQ:AMZN) significantly undervalued? We will delve into a valuation analysis to provide an answer. Let's explore the financial landscape of Amazon.com and its GF Value.
Company Introduction
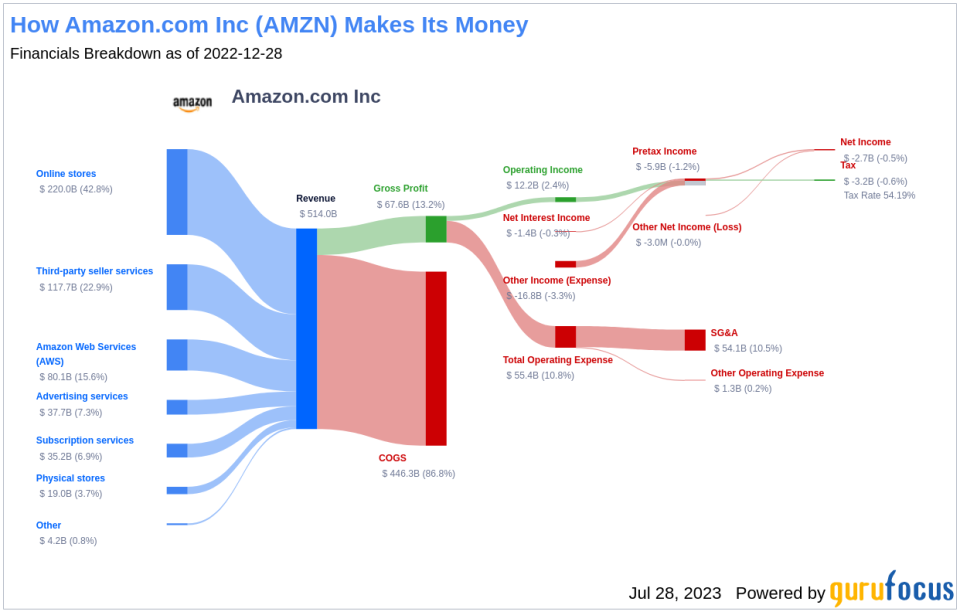
Amazon.com, a leading online retailer, is one of the highest-grossing e-commerce aggregators, with $386 billion in net sales and approximately $578 billion in estimated physical/digital online gross merchandise volume in 2021. The company's operations span across retail-related revenue, Amazon Web Services' cloud computing, storage, database, and other offerings, advertising services, and more. International segments constitute 25%-30% of Amazon.com's non-AWS sales, led by Germany, the United Kingdom, and Japan.
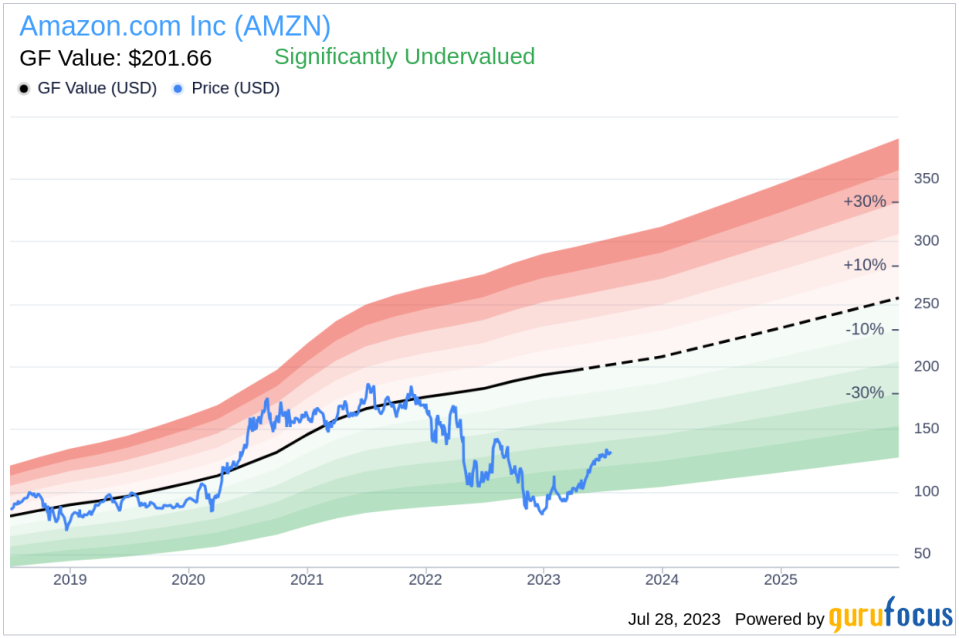
With the current stock price of $132.03 per share, Amazon.com Inc (NASDAQ:AMZN) is significantly undervalued according to the GF Value, which stands at $201.66. This GF Value is an estimation of the fair value at which the stock should be traded.
Understanding the GF Value
The GF Value is a proprietary measure of a stock's intrinsic value, derived from historical trading multiples, a GuruFocus adjustment factor based on past performance and growth, and future business performance estimates. The GF Value Line provides an overview of the fair value at which the stock should ideally trade.
If the stock price is significantly above the GF Value Line, it is overvalued and its future return is likely to be poor. Conversely, if it is significantly below the GF Value Line, its future return will likely be higher.
For Amazon.com, the stock is estimated to be significantly undervalued. The current price of $132.03 per share and the market cap of $1.4 trillion suggest that Amazon.com's stock is likely to yield much higher returns in the long term than its business growth.
Link: These companies may deliver higher future returns at reduced risk.
Amazon.com's Financial Strength
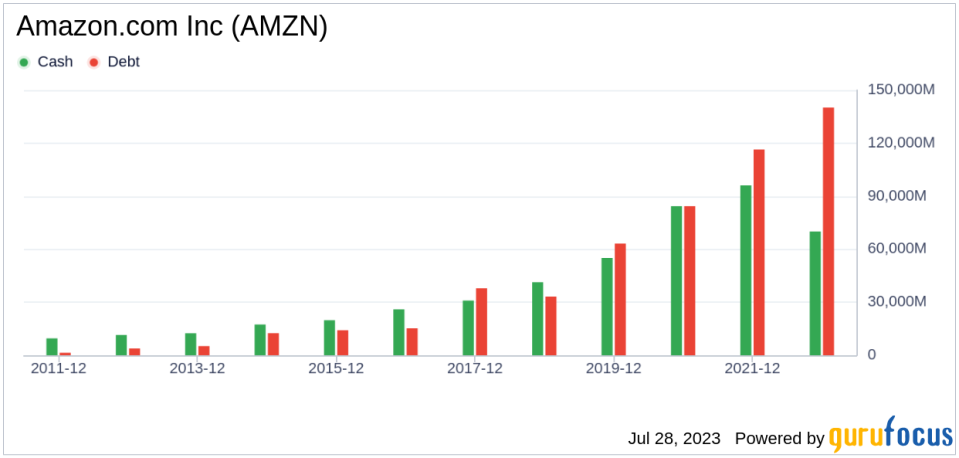
Investing in companies with low financial strength could result in permanent capital loss. Therefore, it's essential to review a company's financial strength before deciding to buy shares. Looking at the cash-to-debt ratio and interest coverage can provide a good initial perspective.
Amazon.com has a cash-to-debt ratio of 0.46, ranking worse than 51.41% of companies in the Retail - Cyclical industry. Based on this, GuruFocus ranks Amazon.com's financial strength as 6 out of 10, suggesting a fair balance sheet.
Profitability and Growth
Investing in profitable companies, especially those that have demonstrated consistent profitability over the long term, poses less risk. A company with high profit margins is also typically a safer investment than one with low profit margins. Amazon.com has been profitable 8 over the past 10 years. Over the past twelve months, the company had a revenue of $524.9 billion and Earnings Per Share (EPS) of $0.42. Its operating margin is 2.54%, ranking worse than 56.27% of companies in the Retail - Cyclical industry. Overall, GuruFocus ranks the profitability of Amazon.com at 8 out of 10, indicating strong profitability.
Growth is probably the most important factor in the valuation of a company. GuruFocus research has found that growth is closely correlated with the long-term stock performance of a company. A faster-growing company creates more value for shareholders, especially if the growth is profitable. The 3-year average annual revenue growth of Amazon.com is 21.9%, ranking better than 83.35% of companies in the Retail - Cyclical industry. However, the 3-year average EBITDA growth rate is 0.5%, ranking worse than 67.04% of companies in the Retail - Cyclical industry.
ROIC vs WACC
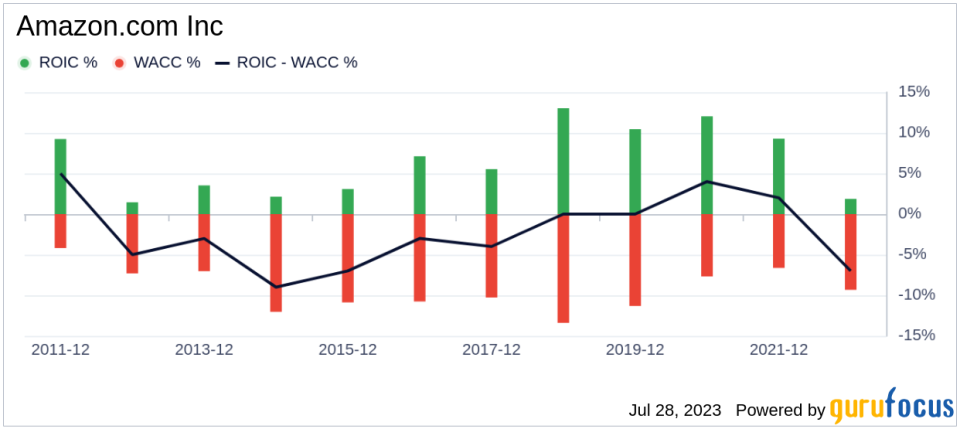
Comparing a company's return on invested capital (ROIC) and the weighted cost of capital (WACC) can provide another perspective on its profitability. ROIC measures how well a company generates cash flow relative to the capital it has invested in its business. WACC is the rate that a company is expected to pay on average to all its security holders to finance its assets. For the past 12 months, Amazon.com's ROIC is 5.3, and its WACC is 11.13.
Conclusion
Overall, Amazon.com (NASDAQ:AMZN) stock is estimated to be significantly undervalued. The company's financial condition is fair, and its profitability is strong. Its growth ranks worse than 67.04% of companies in the Retail - Cyclical industry. To learn more about Amazon.com stock, you can check out its 30-Year Financials here.
To find out the high-quality companies that may deliver above-average returns, please check out GuruFocus High Quality Low Capex Screener.
This article first appeared on GuruFocus.

